| Param | Original file | Final file |
|---|---|---|
| Filename | modeM0/AS1C03_001T01_9000002270_15394cztM0_level2.evt | modeM0/AS1C03_001T01_9000002270_15394cztM0_level2_quad_clean.evt |
| Size (bytes) | 1,873,056,960 | 257,028,480 |
| Size | 1.7 GB | 245.1 MB |
| Events in quadrant A | 8,568,705 | 1,687,111 |
| Events in quadrant B | 11,821,003 | 1,657,924 |
| Events in quadrant C | 9,663,948 | 1,684,154 |
| Events in quadrant D | 25,411,841 | 1,463,161 |
| Mode SS | |||
|---|---|---|---|
| Quadrant | BADHDUFLAG | Total packets | Discarded packets |
| A | 0 | 380 | 0 |
| B | 0 | 380 | 0 |
| C | 0 | 380 | 0 |
| D | 0 | 380 | 0 |
| Mode M0 | |||
|---|---|---|---|
| Quadrant | BADHDUFLAG | Total packets | Discarded packets |
| A | 0 | 38475 | 5 |
| B | 0 | 47835 | 4 |
| C | 0 | 41135 | 4 |
| D | 0 | 88645 | 4 |
| Mode M9 | |||
|---|---|---|---|
| Quadrant | BADHDUFLAG | Total packets | Discarded packets |
| A | 0 | 23 | 0 |
| B | 0 | 23 | 0 |
| C | 0 | 23 | 0 |
| D | 0 | 23 | 0 |
| Quadrant | Total seconds | Saturated seconds | Saturation percentage |
|---|---|---|---|
| A | 18746 | 114 | 0.608130% |
| B | 18746 | 761 | 4.059533% |
| C | 18746 | 299 | 1.595007% |
| D | 18746 | 3917 | 20.895124% |
Noise dominated data is calculated using 1-second bins in cleaned event files. If a bin has >2000 counts, and if more than 50% of those come from <1% of pixels, then it is considered to be noise-dominated and hence unusable.
| Quadrant | # 1 sec bins | Bins with >0 counts | Bins with >2000 counts | High rate bins dominated by noise | Noise dominated (total time) | Noise dominated (detector-on time) | Marked lightcurve |
|---|---|---|---|---|---|---|---|
| A | 20967 | 18750 | 16 | 16 | 0.08% | 0.09% | 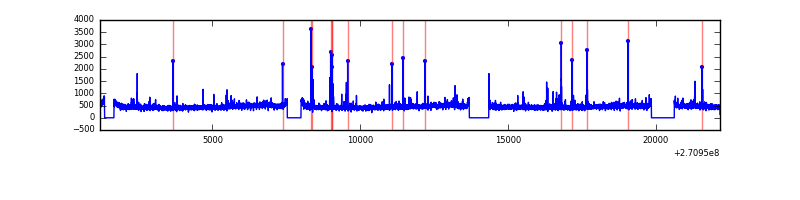 |
| B | 20967 | 18750 | 416 | 416 | 1.98% | 2.22% | 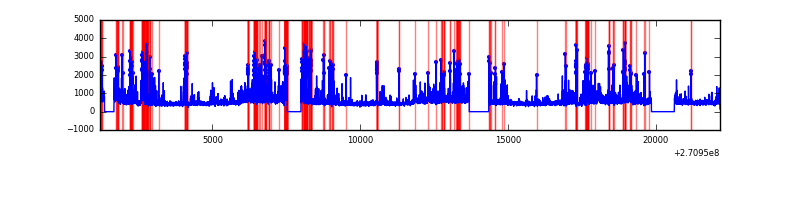 |
| C | 20967 | 18751 | 213 | 213 | 1.02% | 1.14% | 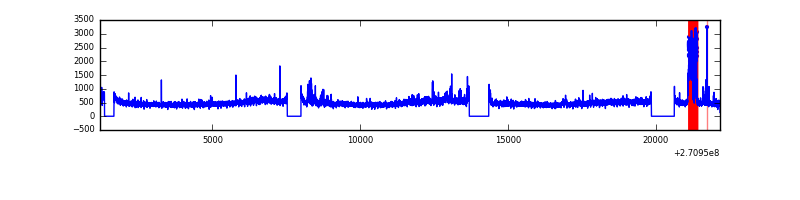 |
| D | 20967 | 18750 | 3688 | 3688 | 17.59% | 19.67% | 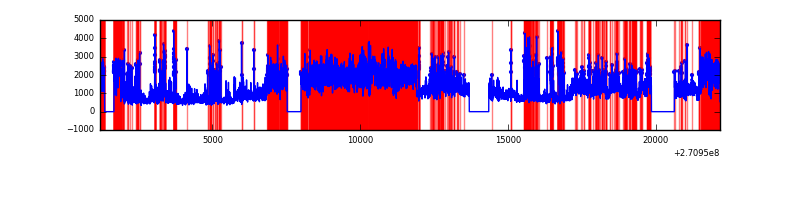 |
Top three noisy pixels from each quadrant. If the there are fewer than three noisy pixels in the level2.evt file, extra rows are filled as -1
| Pixel properties | Quadrant properties | ||||||
|---|---|---|---|---|---|---|---|
| Quadrant | DetID | PixID | Counts | Sigma | Mean | Median | Sigma |
| A | 14 | 238 | 112357 | 254.04 | 2157 | 2107 | 434.0 |
| A | 9 | 143 | 78488 | 176.0 | 2157 | 2107 | 434.0 |
| A | 12 | 96 | 55369 | 122.73 | 2157 | 2107 | 434.0 |
| B | 10 | 245 | 1555991 | 3875.09 | 2136 | 2078 | 401.0 |
| B | 10 | 16 | 577726 | 1435.53 | 2136 | 2078 | 401.0 |
| B | 7 | 220 | 316649 | 784.46 | 2136 | 2078 | 401.0 |
| C | 3 | 233 | 1454329 | 3005.78 | 2098 | 2106 | 483.1 |
| C | 13 | 61 | 15101 | 26.9 | 2098 | 2106 | 483.1 |
| C | 7 | 247 | 11121 | 18.66 | 2098 | 2106 | 483.1 |
| D | 13 | 122 | 13970902 | 28967.05 | 1980 | 1920 | 482.2 |
| D | 2 | 33 | 2849723 | 5905.4 | 1980 | 1920 | 482.2 |
| D | 9 | 68 | 340215 | 701.51 | 1980 | 1920 | 482.2 |
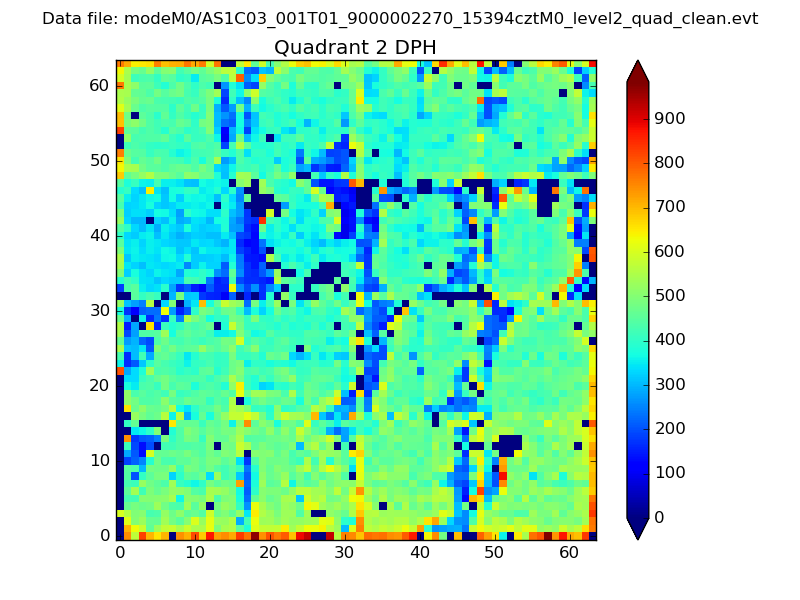
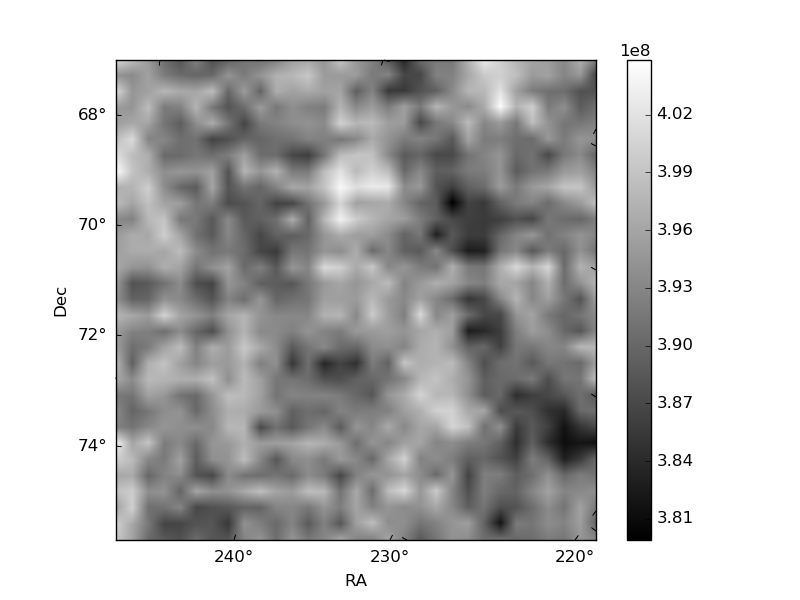
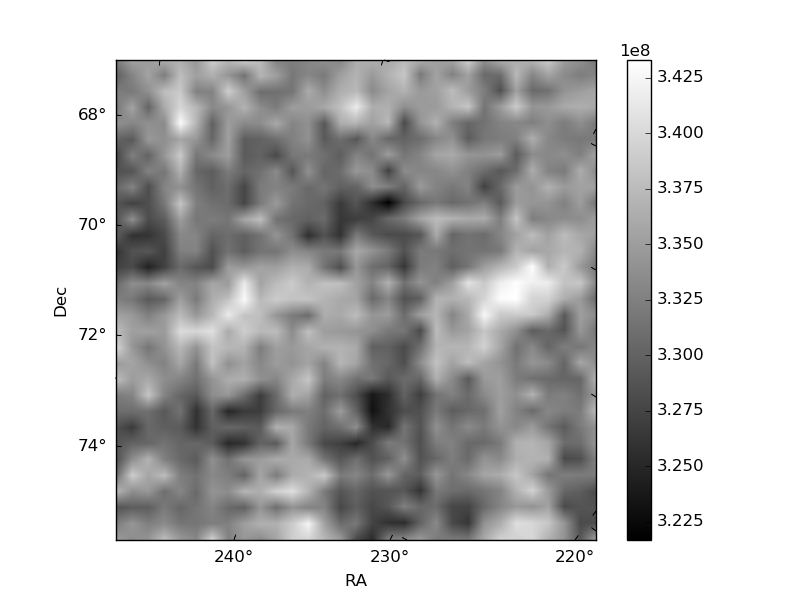
Histogram calculated using DETX and DETY for each event in the final _common_clean file
| Quadrant A | 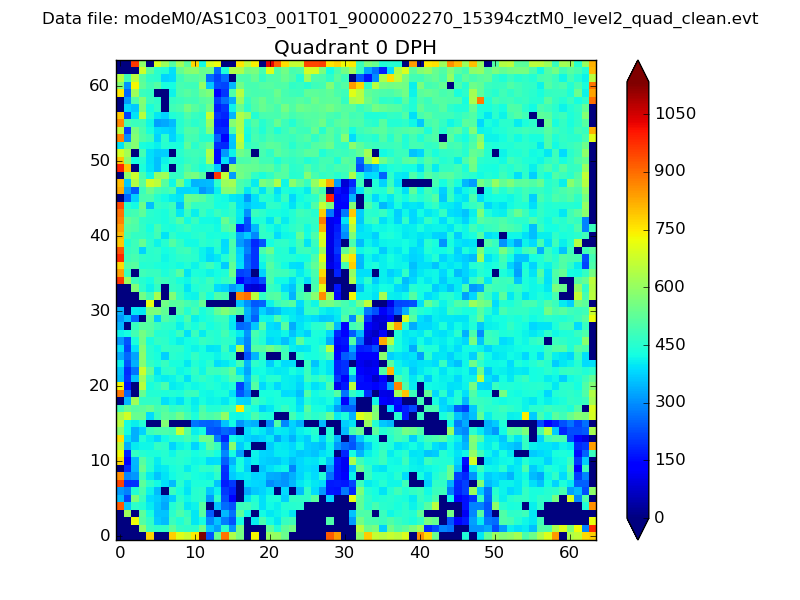 |
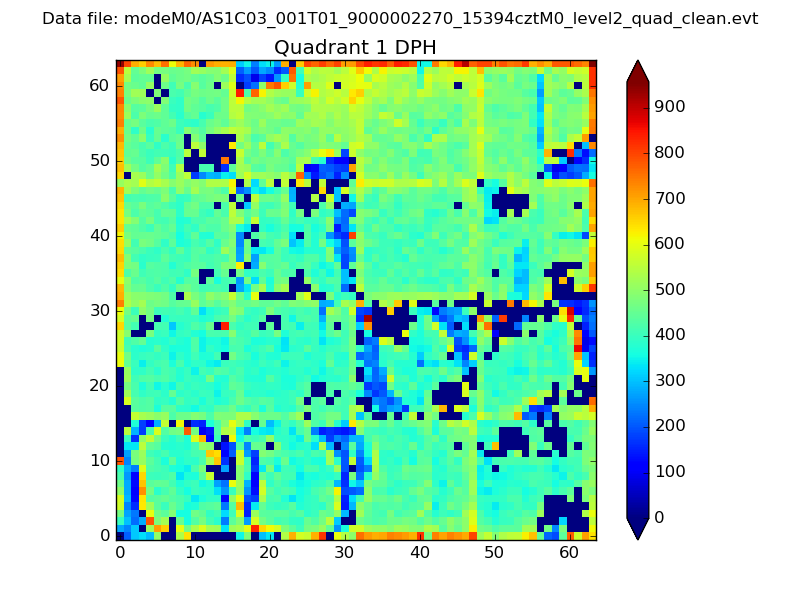 |
Quadrant B |
|---|---|---|---|
| Quadrant D | 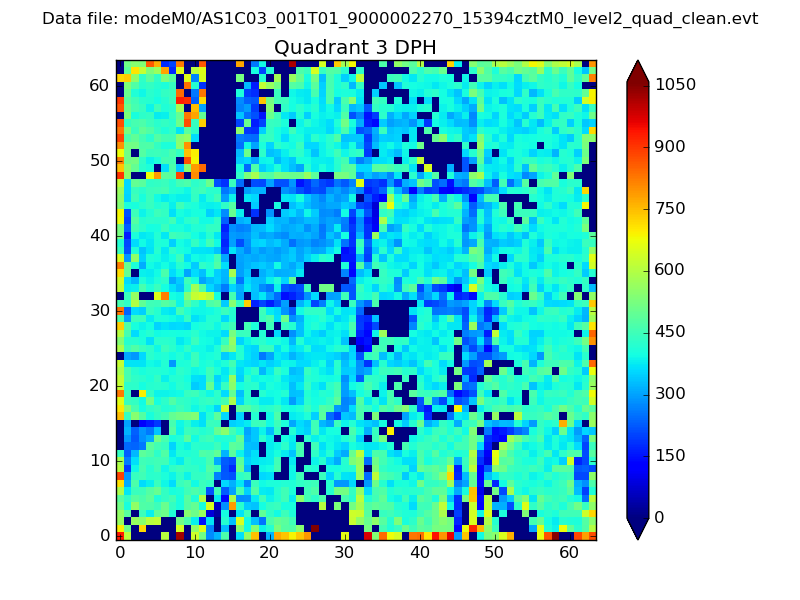 |
 |
Quadrant C |
| Plot type | Count rate plots | Images |
|---|---|---|
| Comparison with Poisson distribution Blue bars denote a histogram of data divided into 1 sec bins. Red curve is a Poisson curve with rate = median count rate of data. |
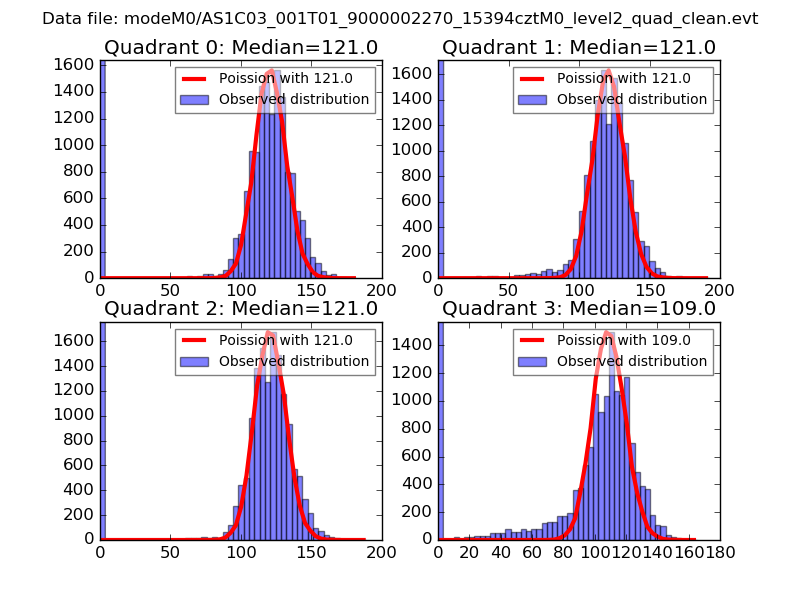 |
 |
| Quadrant-wise count rates Data is divided into 100 sec bins |
 |
|
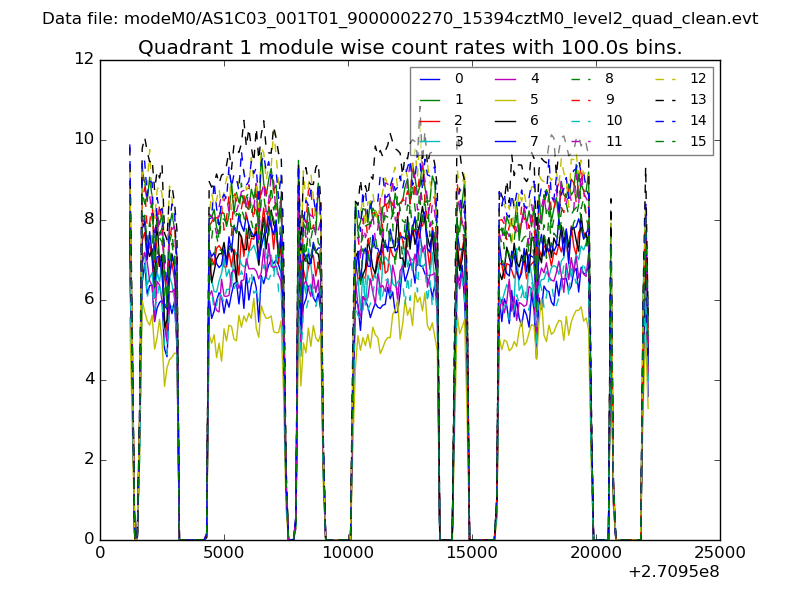
| Module-wise count rates for Quadrant A Data is divided into 100 sec bins |
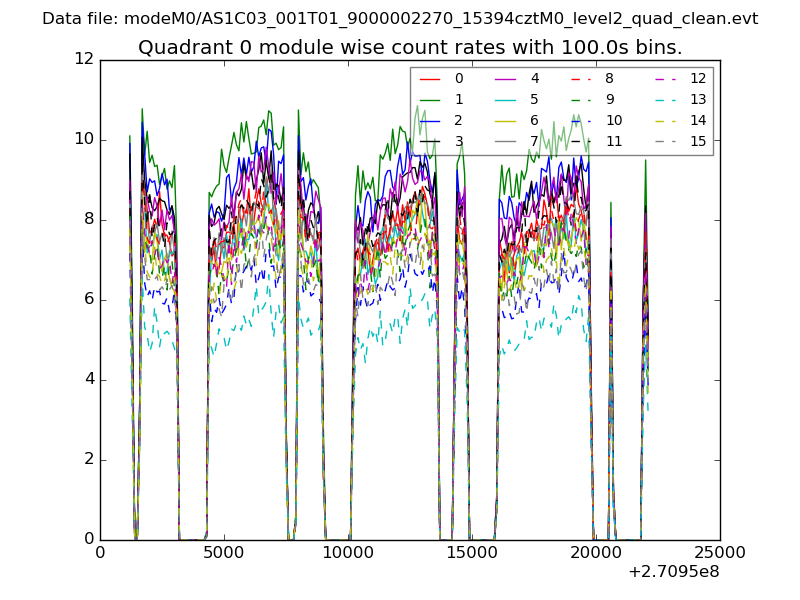 |
 |
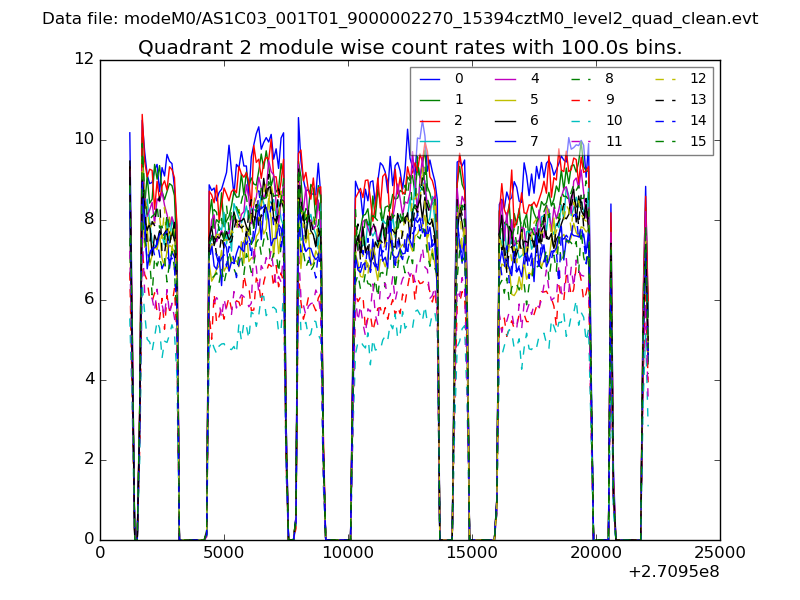
| Module-wise count rates for Quadrant B Data is divided into 100 sec bins |
 |
 |
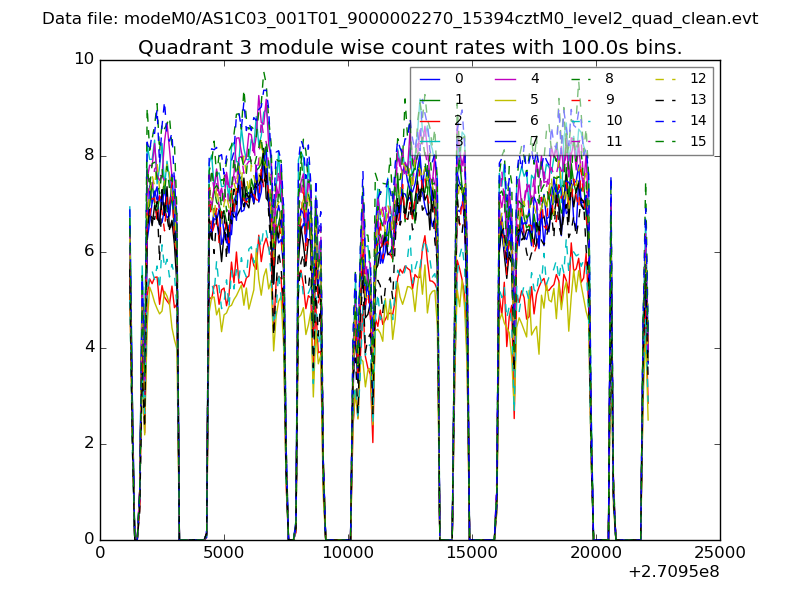
| Module-wise count rates for Quadrant C Data is divided into 100 sec bins |
 |
 |
| Module-wise count rates for Quadrant D Data is divided into 100 sec bins |
 |
 |
| Parameter | Plot |
|---|---|
| CZT HV Monitor | 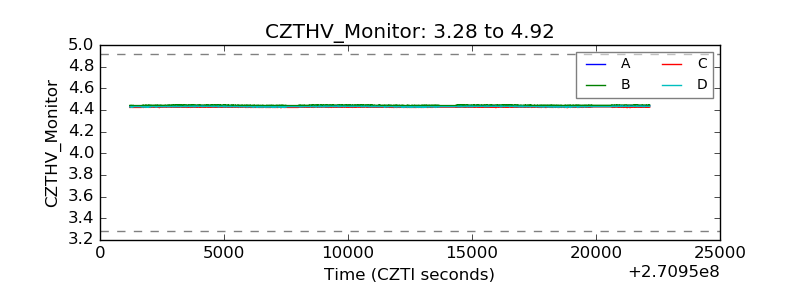 |
| D_VDD | 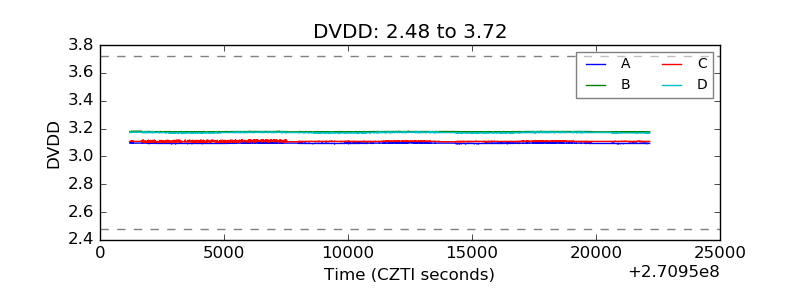 |
| Temperature 1 | 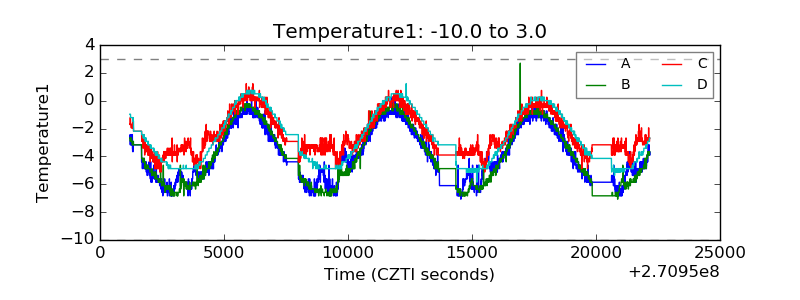 |
| Veto HV Monitor | 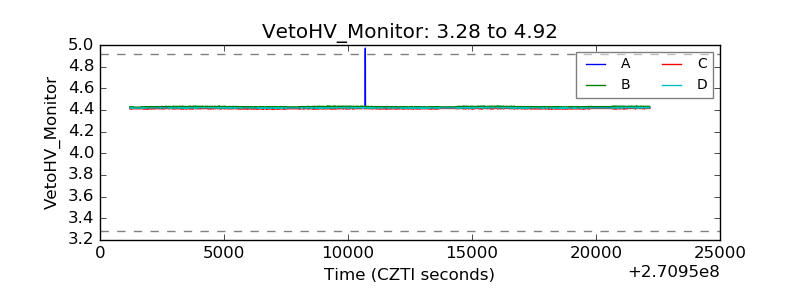 |
| Veto LLD | 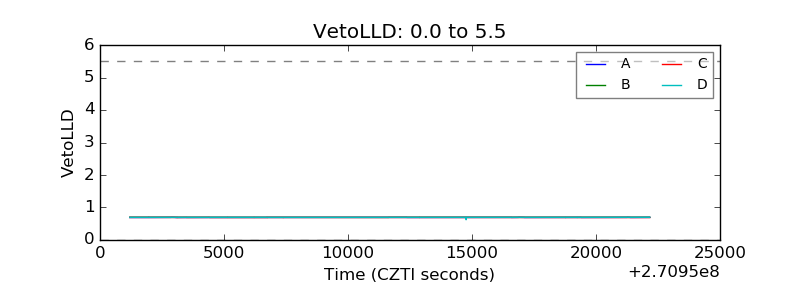 |
| Alpha Counter |  |
| _CPM_Rate | 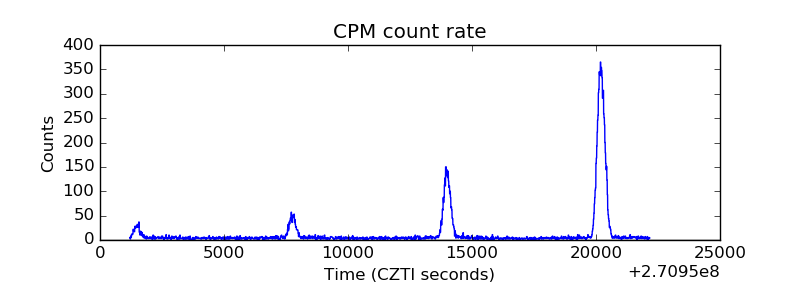 |
| CZT Counter |  |
| +2.5 Volts monitor |  |
| +5 Volts monitor |  |
| _ROLL_ROT | 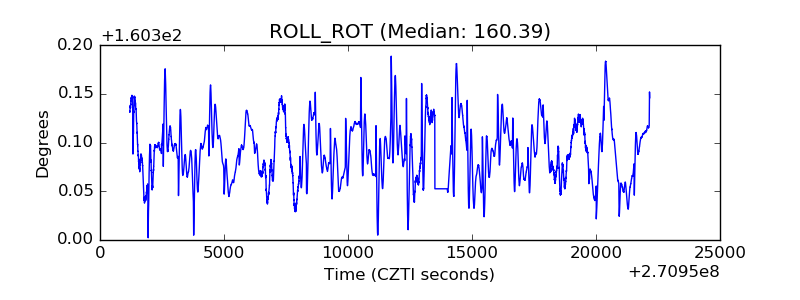 |
| _Roll_DEC | 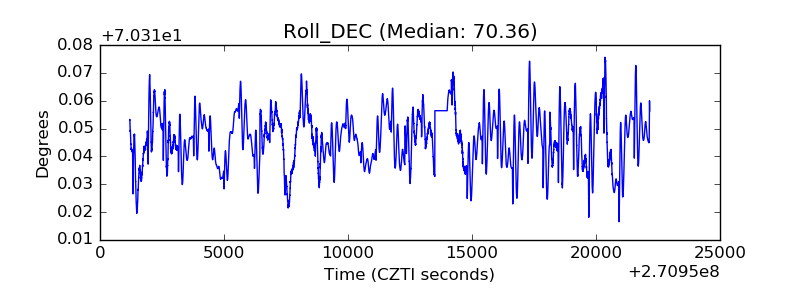 |
| _Roll_RA |  |
| Veto Counter | 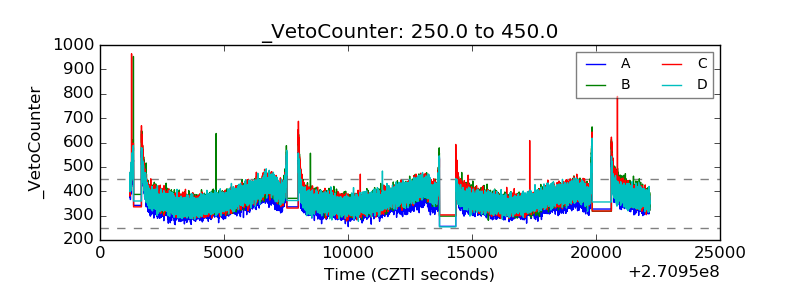 |