| Param | Original file | Final file |
|---|---|---|
| Filename | modeM0/AS1C03_001T01_9000002270_15395cztM0_level2.evt | modeM0/AS1C03_001T01_9000002270_15395cztM0_level2_quad_clean.evt |
| Size (bytes) | 720,213,120 | 83,715,840 |
| Size | 686.8 MB | 79.8 MB |
| Events in quadrant A | 2,967,053 | 552,250 |
| Events in quadrant B | 4,302,058 | 539,635 |
| Events in quadrant C | 3,599,411 | 549,235 |
| Events in quadrant D | 10,516,188 | 451,963 |
| Mode SS | |||
|---|---|---|---|
| Quadrant | BADHDUFLAG | Total packets | Discarded packets |
| A | 0 | 128 | 0 |
| B | 0 | 128 | 0 |
| C | 0 | 128 | 0 |
| D | 0 | 128 | 0 |
| Mode M0 | |||
|---|---|---|---|
| Quadrant | BADHDUFLAG | Total packets | Discarded packets |
| A | 0 | 13066 | 2 |
| B | 0 | 16981 | 1 |
| C | 0 | 14718 | 1 |
| D | 0 | 35604 | 1 |
| Mode M9 | |||
|---|---|---|---|
| Quadrant | BADHDUFLAG | Total packets | Discarded packets |
| A | 0 | 10 | 0 |
| B | 0 | 10 | 0 |
| C | 0 | 10 | 0 |
| D | 0 | 10 | 0 |
| Quadrant | Total seconds | Saturated seconds | Saturation percentage |
|---|---|---|---|
| A | 6323 | 59 | 0.933101% |
| B | 6323 | 332 | 5.250672% |
| C | 6323 | 269 | 4.254310% |
| D | 6323 | 2045 | 32.342243% |
Noise dominated data is calculated using 1-second bins in cleaned event files. If a bin has >2000 counts, and if more than 50% of those come from <1% of pixels, then it is considered to be noise-dominated and hence unusable.
| Quadrant | # 1 sec bins | Bins with >0 counts | Bins with >2000 counts | High rate bins dominated by noise | Noise dominated (total time) | Noise dominated (detector-on time) | Marked lightcurve |
|---|---|---|---|---|---|---|---|
| A | 7239 | 6324 | 13 | 13 | 0.18% | 0.21% | 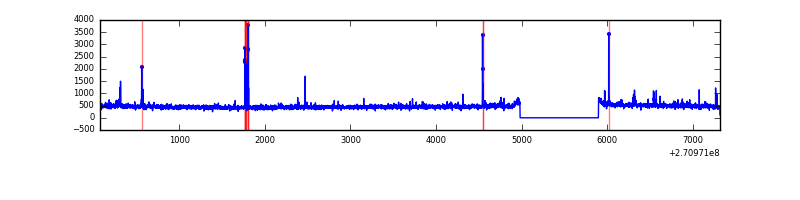 |
| B | 7239 | 6324 | 211 | 211 | 2.91% | 3.34% | 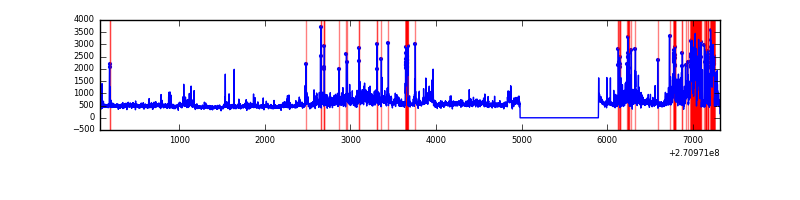 |
| C | 7239 | 6324 | 214 | 214 | 2.96% | 3.38% | 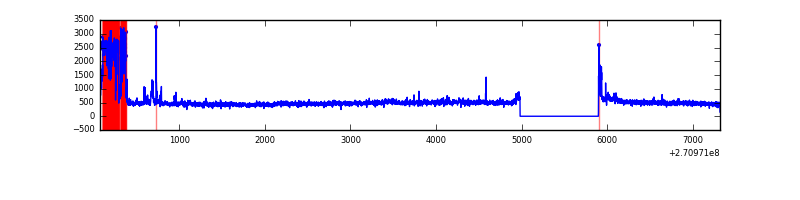 |
| D | 7239 | 6324 | 1928 | 1928 | 26.63% | 30.49% | 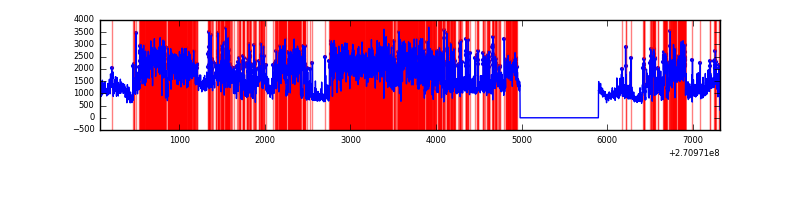 |
Top three noisy pixels from each quadrant. If the there are fewer than three noisy pixels in the level2.evt file, extra rows are filled as -1
| Pixel properties | Quadrant properties | ||||||
|---|---|---|---|---|---|---|---|
| Quadrant | DetID | PixID | Counts | Sigma | Mean | Median | Sigma |
| A | 15 | 69 | 44735 | 291.27 | 742 | 726 | 151.1 |
| A | 9 | 143 | 30682 | 198.26 | 742 | 726 | 151.1 |
| A | 14 | 238 | 12090 | 75.21 | 742 | 726 | 151.1 |
| B | 10 | 245 | 575014 | 4167.92 | 725 | 706 | 137.8 |
| B | 8 | 3 | 257482 | 1863.5 | 725 | 706 | 137.8 |
| B | 10 | 16 | 225537 | 1631.66 | 725 | 706 | 137.8 |
| C | 3 | 233 | 853931 | 5286.87 | 700 | 703 | 161.4 |
| C | 7 | 247 | 11583 | 67.42 | 700 | 703 | 161.4 |
| C | 13 | 61 | 5050 | 26.94 | 700 | 703 | 161.4 |
| D | 13 | 122 | 6638155 | 41317.92 | 659 | 640 | 160.6 |
| D | 2 | 33 | 799598 | 4973.44 | 659 | 640 | 160.6 |
| D | 9 | 68 | 233650 | 1450.47 | 659 | 640 | 160.6 |
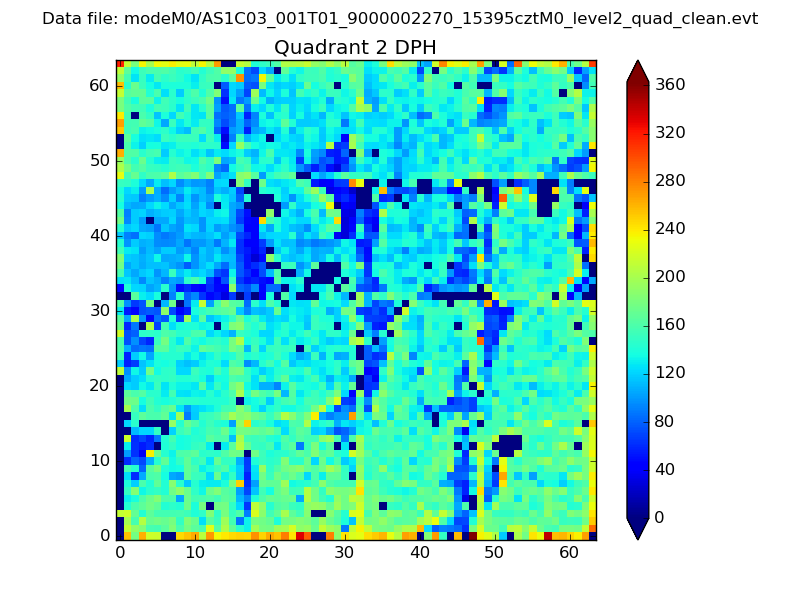
Histogram calculated using DETX and DETY for each event in the final _common_clean file
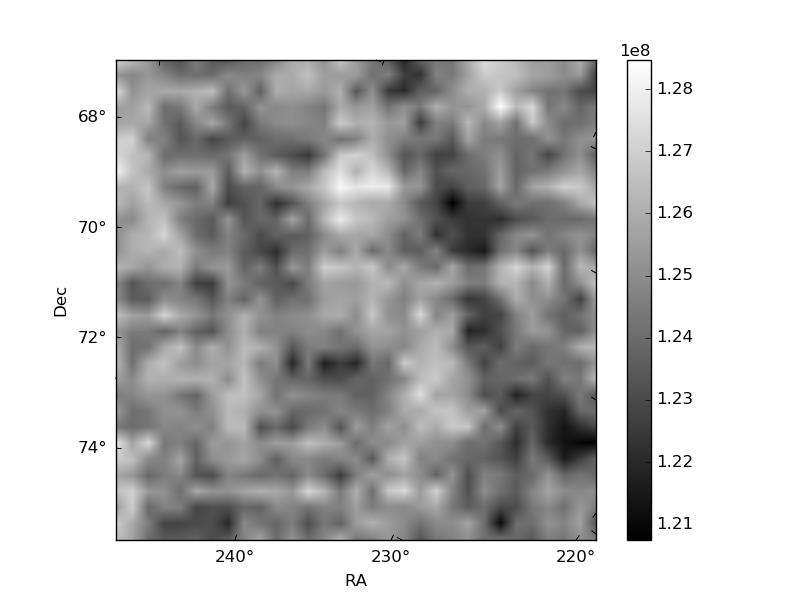
| Quadrant A | 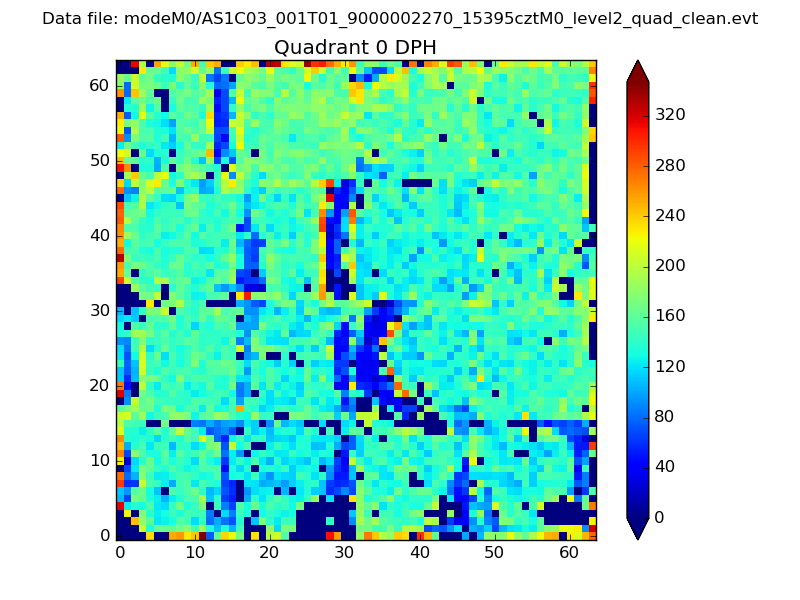 |
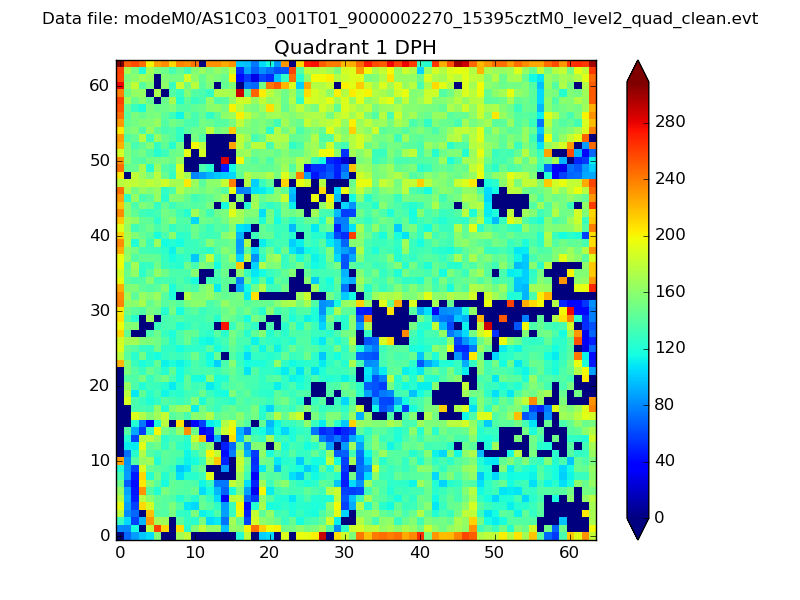 |
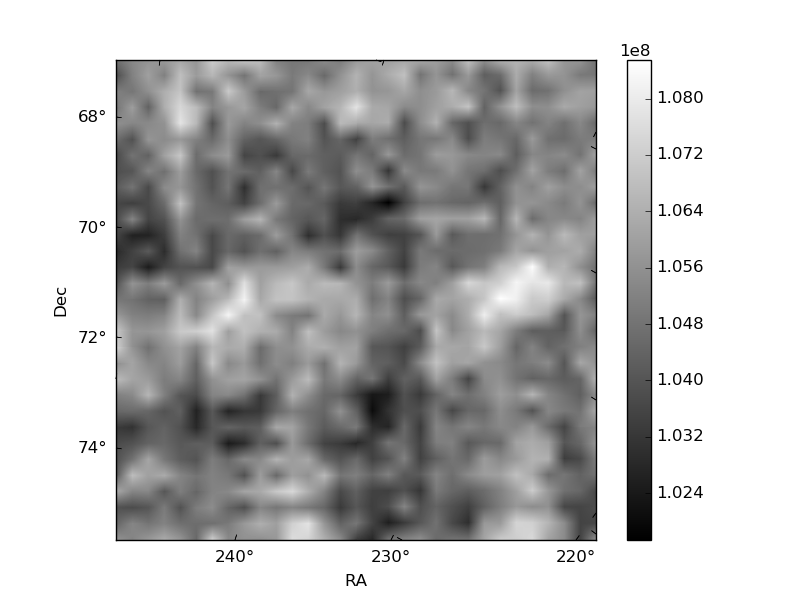
Quadrant B |
|---|---|---|---|
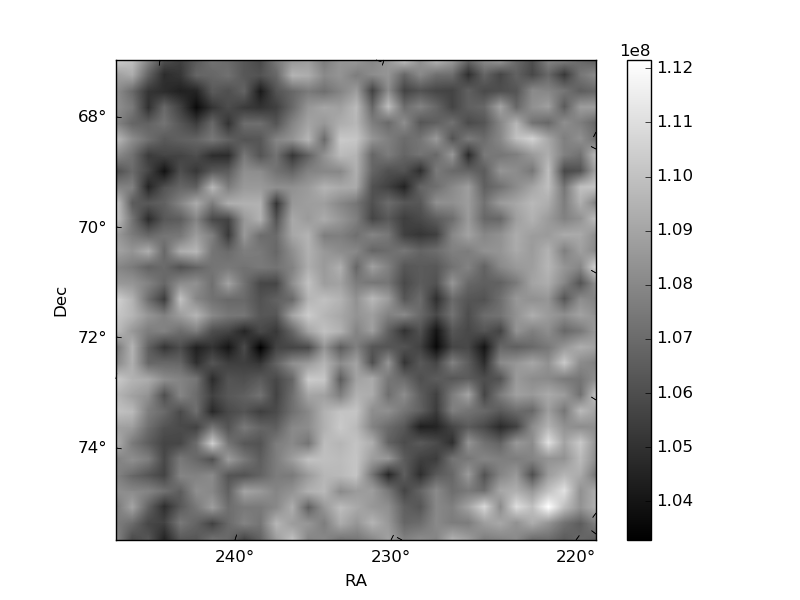
| Quadrant D | 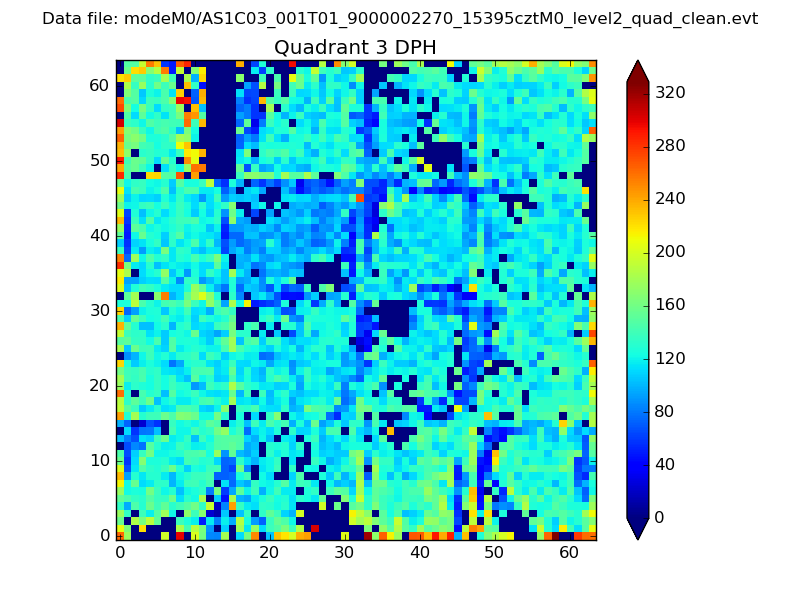 |
 |
Quadrant C |
| Plot type | Count rate plots | Images |
|---|---|---|
| Comparison with Poisson distribution Blue bars denote a histogram of data divided into 1 sec bins. Red curve is a Poisson curve with rate = median count rate of data. |
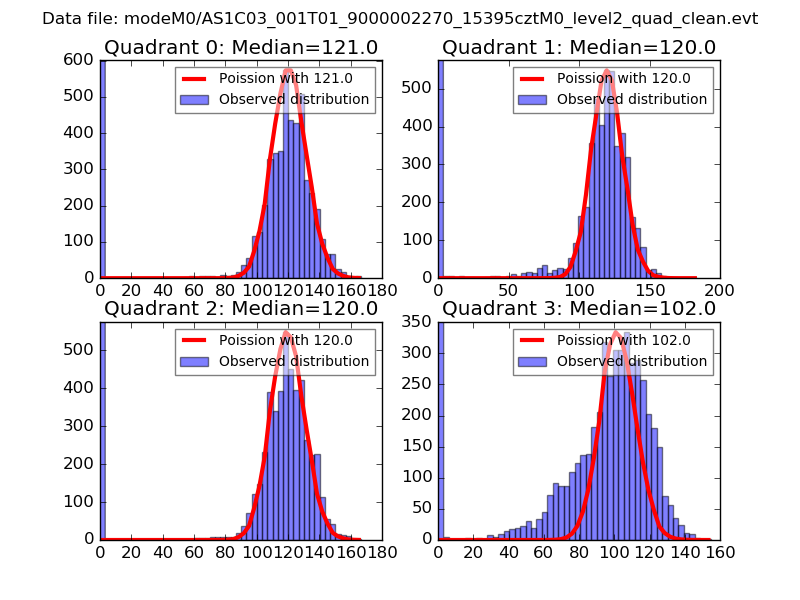 |
 |
| Quadrant-wise count rates Data is divided into 100 sec bins |
 |
|
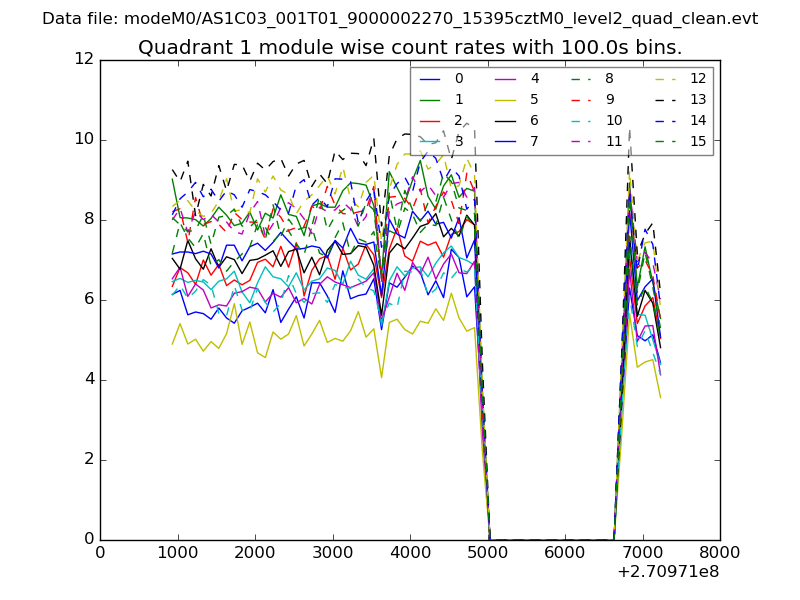
| Module-wise count rates for Quadrant A Data is divided into 100 sec bins |
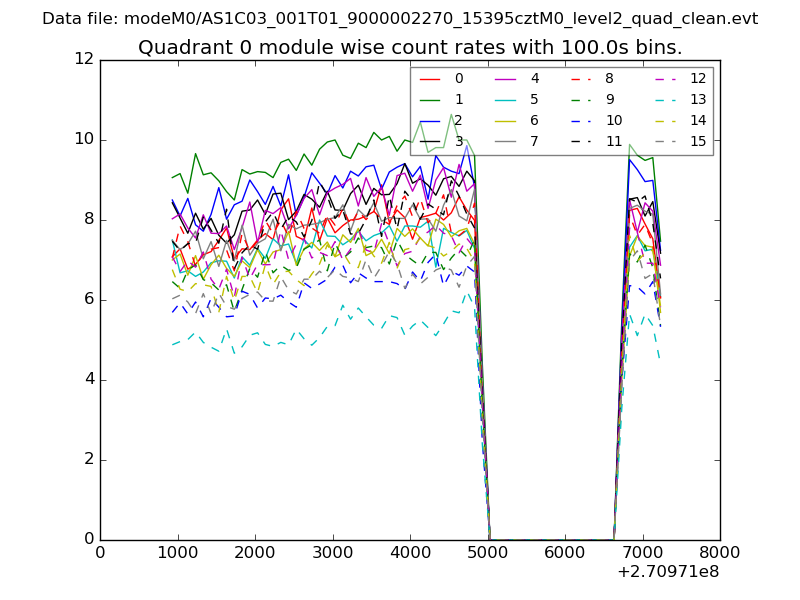 |
 |
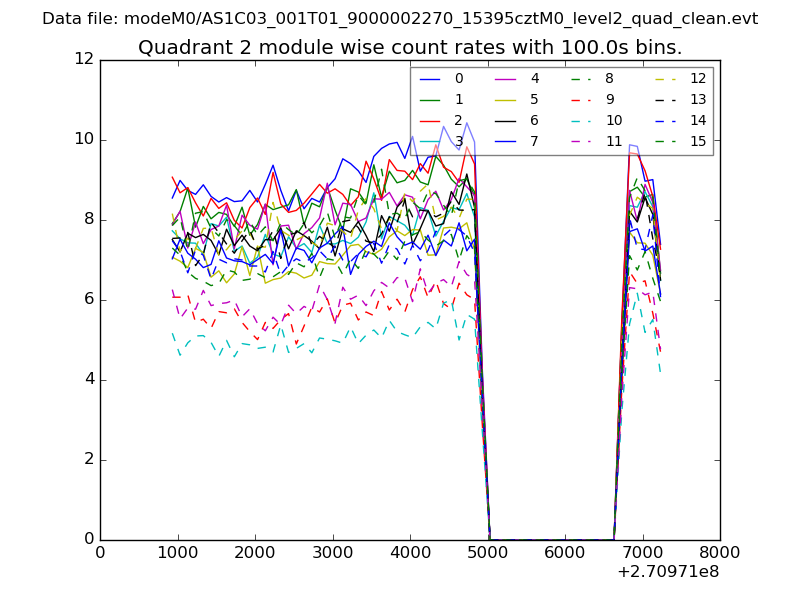
| Module-wise count rates for Quadrant B Data is divided into 100 sec bins |
 |
 |
| Module-wise count rates for Quadrant C Data is divided into 100 sec bins |
 |
 |
| Module-wise count rates for Quadrant D Data is divided into 100 sec bins |
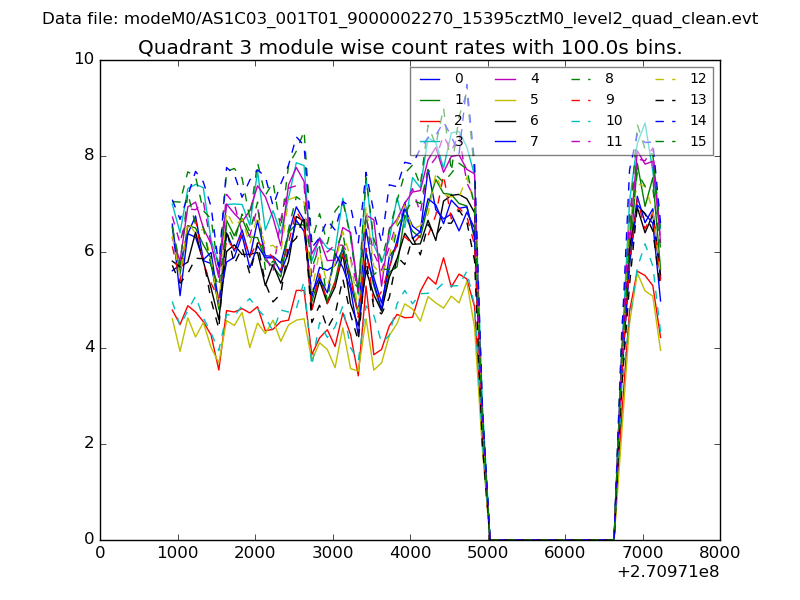 |
 |
| Parameter | Plot |
|---|---|
| CZT HV Monitor | 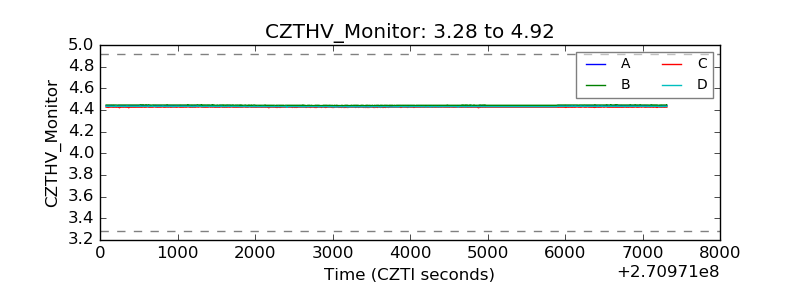 |
| D_VDD | 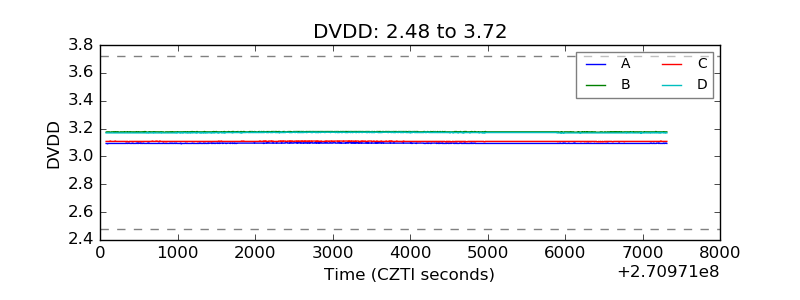 |
| Temperature 1 | 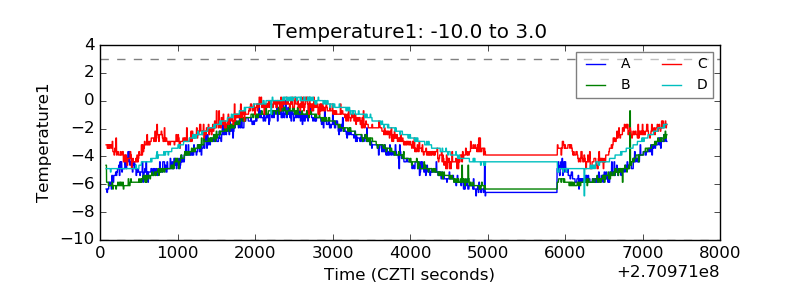 |
| Veto HV Monitor | 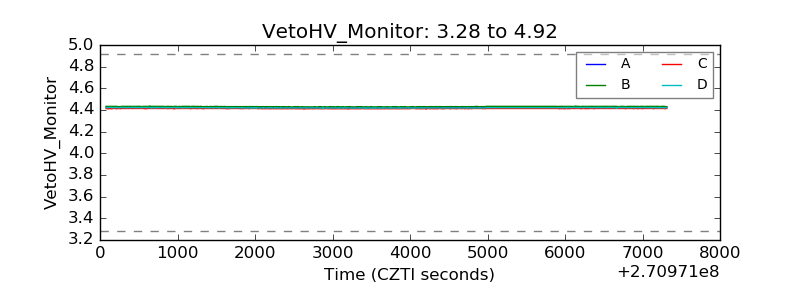 |
| Veto LLD |  |
| Alpha Counter |  |
| _CPM_Rate | 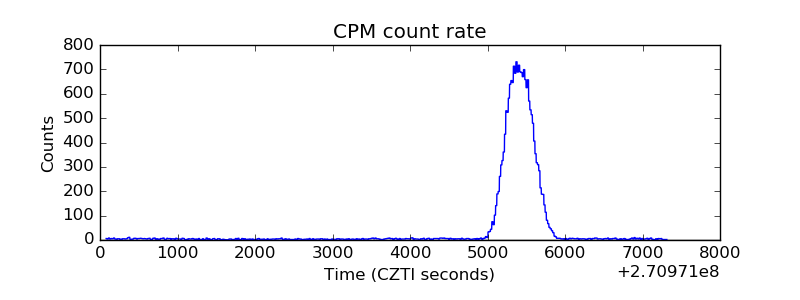 |
| CZT Counter | 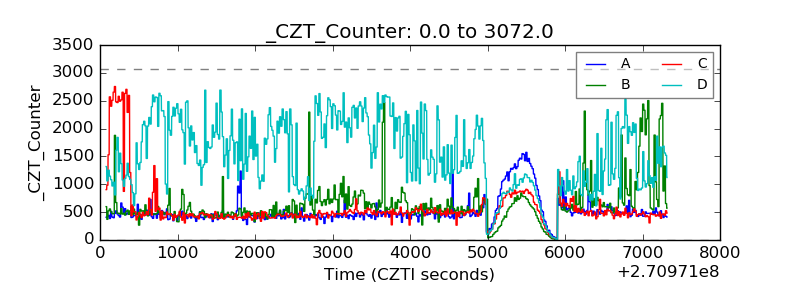 |
| +2.5 Volts monitor |  |
| +5 Volts monitor |  |
| _ROLL_ROT | 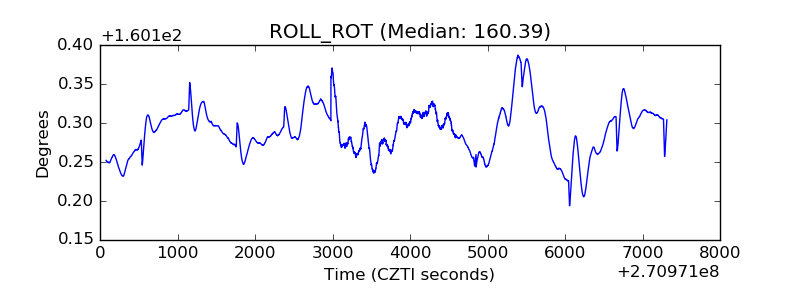 |
| _Roll_DEC | 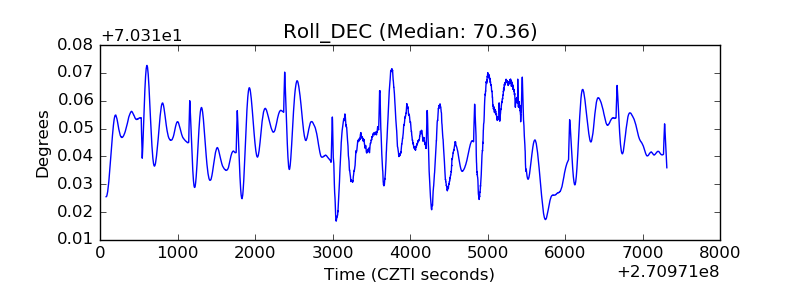 |
| _Roll_RA | 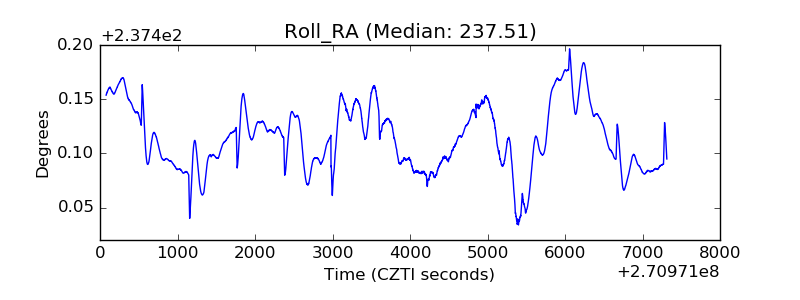 |
| Veto Counter | 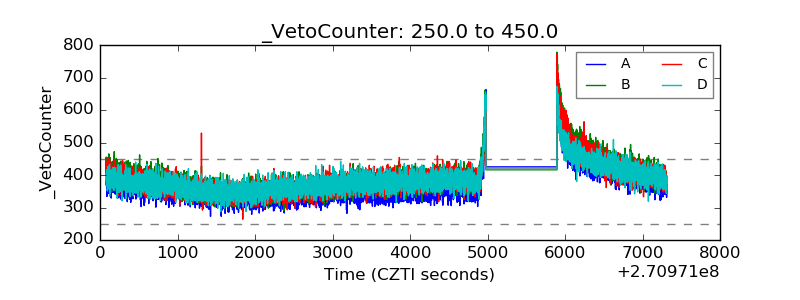 |