| Param | Original file | Final file |
|---|---|---|
| Filename | modeM0/AS1C03_001T01_9000002270_15396cztM0_level2.evt | modeM0/AS1C03_001T01_9000002270_15396cztM0_level2_quad_clean.evt |
| Size (bytes) | 791,568,000 | 93,787,200 |
| Size | 754.9 MB | 89.4 MB |
| Events in quadrant A | 3,301,819 | 655,680 |
| Events in quadrant B | 4,516,179 | 641,234 |
| Events in quadrant C | 3,309,765 | 645,635 |
| Events in quadrant D | 12,401,214 | 438,134 |
| Mode SS | |||
|---|---|---|---|
| Quadrant | BADHDUFLAG | Total packets | Discarded packets |
| A | 0 | 134 | 0 |
| B | 0 | 134 | 0 |
| C | 0 | 134 | 0 |
| D | 0 | 134 | 0 |
| Mode M0 | |||
|---|---|---|---|
| Quadrant | BADHDUFLAG | Total packets | Discarded packets |
| A | 0 | 14113 | 3 |
| B | 0 | 17615 | 2 |
| C | 0 | 13743 | 2 |
| D | 0 | 41398 | 2 |
| Mode M9 | |||
|---|---|---|---|
| Quadrant | BADHDUFLAG | Total packets | Discarded packets |
| A | 0 | 10 | 0 |
| B | 0 | 10 | 0 |
| C | 0 | 10 | 0 |
| D | 0 | 10 | 0 |
| Quadrant | Total seconds | Saturated seconds | Saturation percentage |
|---|---|---|---|
| A | 6565 | 98 | 1.492765% |
| B | 6565 | 394 | 6.001523% |
| C | 6565 | 52 | 0.792079% |
| D | 6565 | 3396 | 51.728865% |
Noise dominated data is calculated using 1-second bins in cleaned event files. If a bin has >2000 counts, and if more than 50% of those come from <1% of pixels, then it is considered to be noise-dominated and hence unusable.
| Quadrant | # 1 sec bins | Bins with >0 counts | Bins with >2000 counts | High rate bins dominated by noise | Noise dominated (total time) | Noise dominated (detector-on time) | Marked lightcurve |
|---|---|---|---|---|---|---|---|
| A | 7601 | 6566 | 16 | 16 | 0.21% | 0.24% | 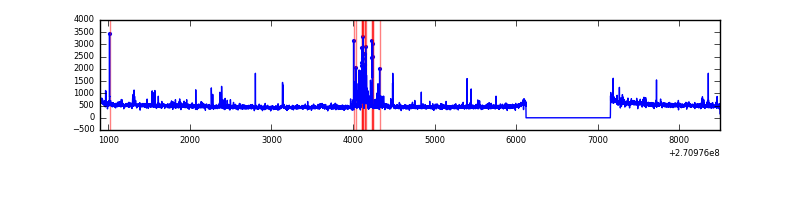 |
| B | 7601 | 6566 | 234 | 234 | 3.08% | 3.56% | 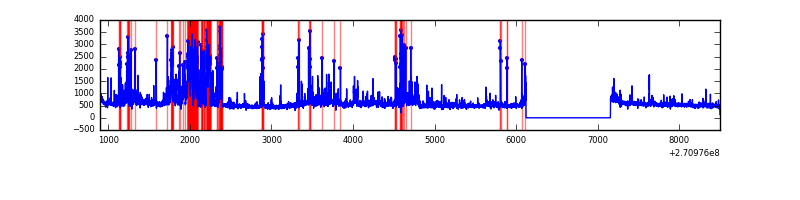 |
| C | 7601 | 6566 | 1 | 1 | 0.01% | 0.02% | 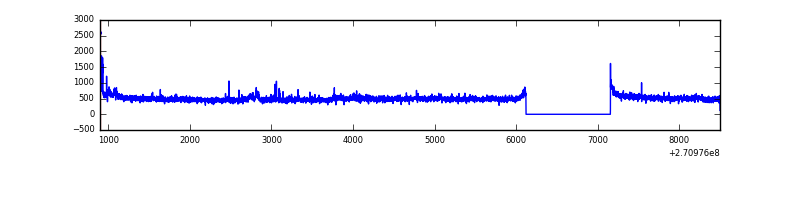 |
| D | 7601 | 6566 | 3230 | 3230 | 42.49% | 49.19% | 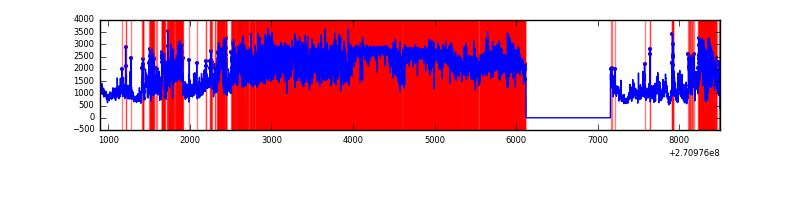 |
Top three noisy pixels from each quadrant. If the there are fewer than three noisy pixels in the level2.evt file, extra rows are filled as -1
| Pixel properties | Quadrant properties | ||||||
|---|---|---|---|---|---|---|---|
| Quadrant | DetID | PixID | Counts | Sigma | Mean | Median | Sigma |
| A | 12 | 96 | 151915 | 931.7 | 800 | 784 | 162.2 |
| A | 9 | 143 | 59450 | 361.67 | 800 | 784 | 162.2 |
| A | 7 | 16 | 8835 | 49.63 | 800 | 784 | 162.2 |
| B | 10 | 245 | 648352 | 4455.71 | 779 | 761 | 145.3 |
| B | 10 | 16 | 318090 | 2183.36 | 779 | 761 | 145.3 |
| B | 8 | 3 | 143861 | 984.59 | 779 | 761 | 145.3 |
| C | 3 | 233 | 282308 | 1603.68 | 764 | 767 | 175.6 |
| C | 7 | 247 | 42797 | 239.41 | 764 | 767 | 175.6 |
| C | 13 | 61 | 5557 | 27.28 | 764 | 767 | 175.6 |
| D | 13 | 122 | 8408923 | 55133.95 | 627 | 609 | 152.5 |
| D | 1 | 52 | 685431 | 4490.43 | 627 | 609 | 152.5 |
| D | 2 | 33 | 368269 | 2410.77 | 627 | 609 | 152.5 |
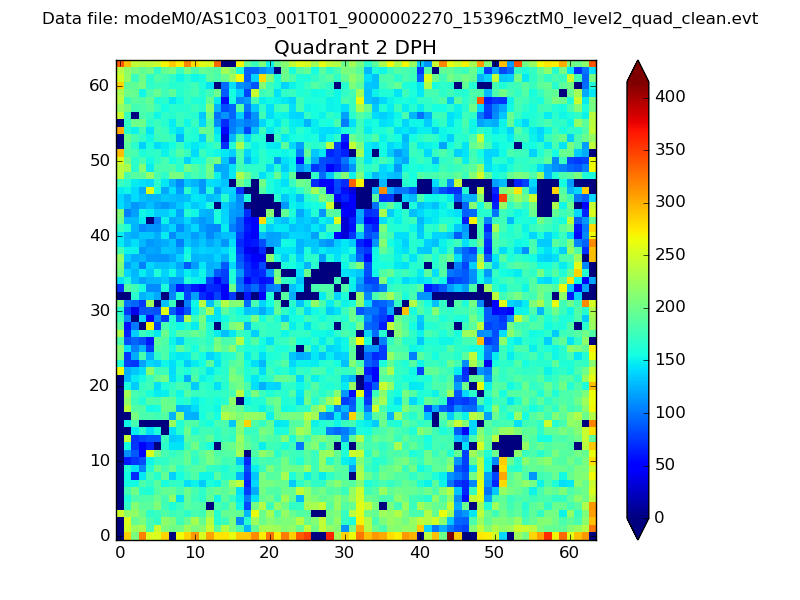
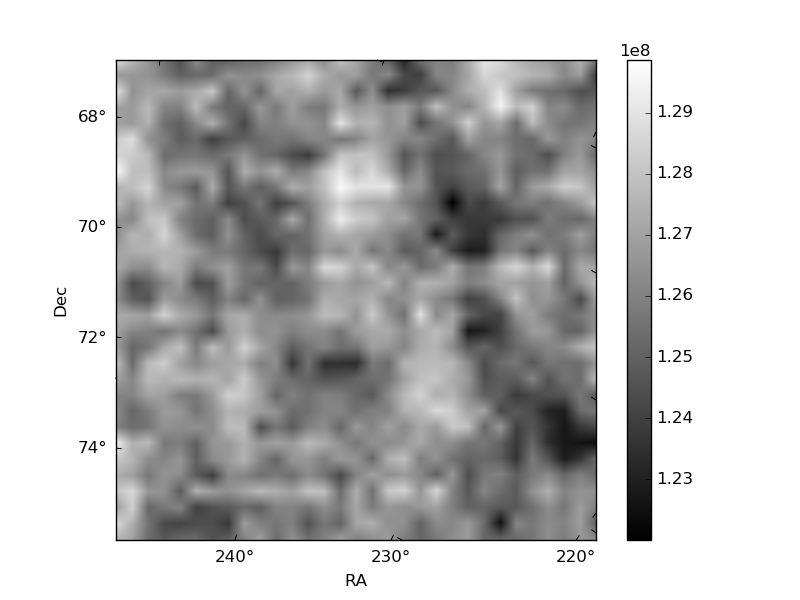
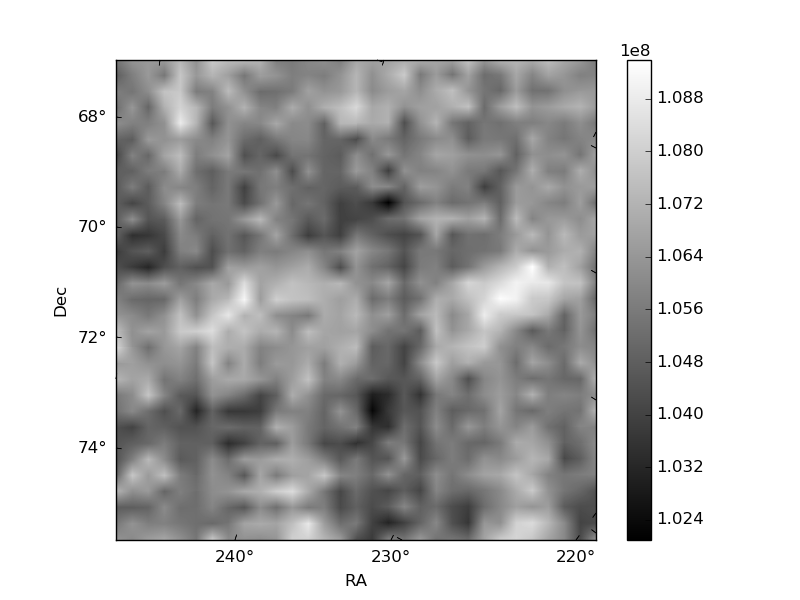
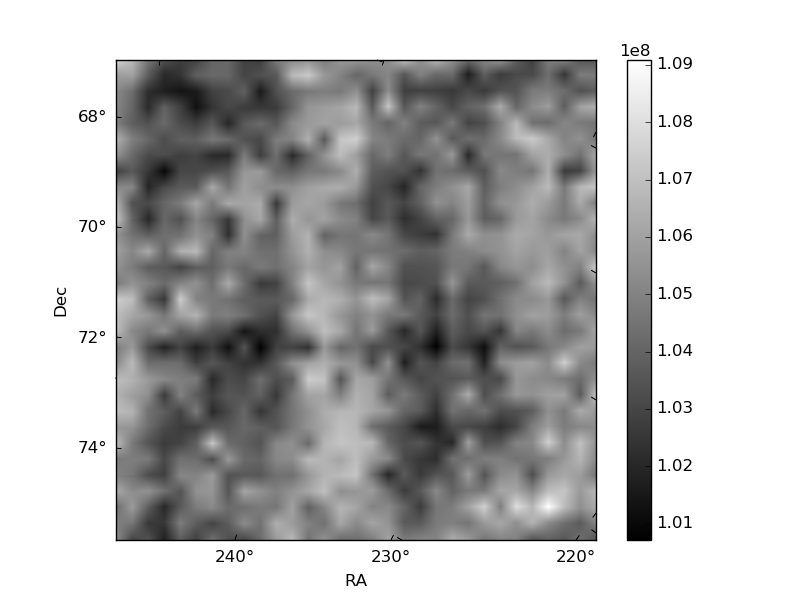
Histogram calculated using DETX and DETY for each event in the final _common_clean file
| Quadrant A | 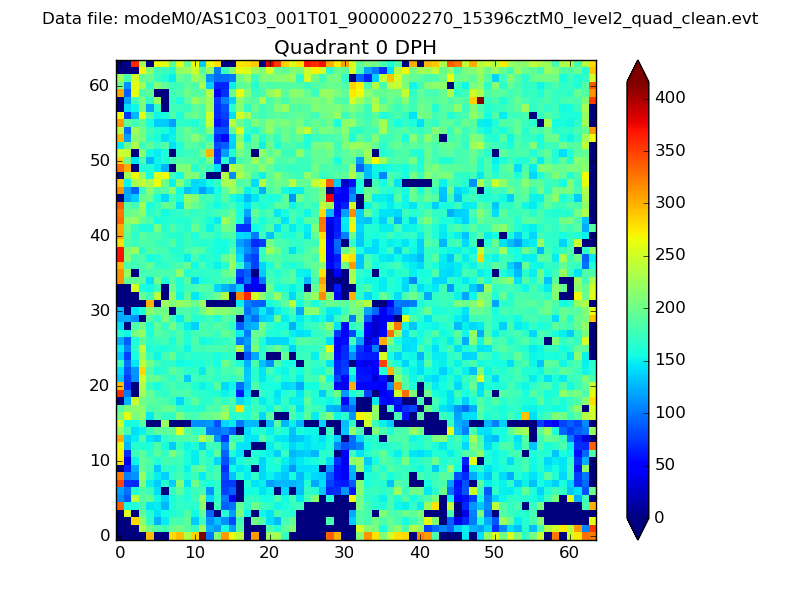 |
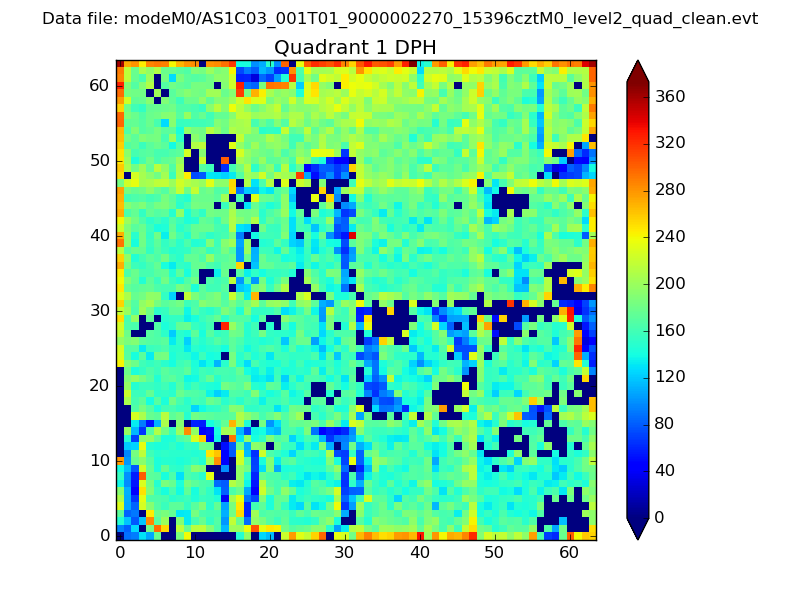 |
Quadrant B |
|---|---|---|---|
| Quadrant D | 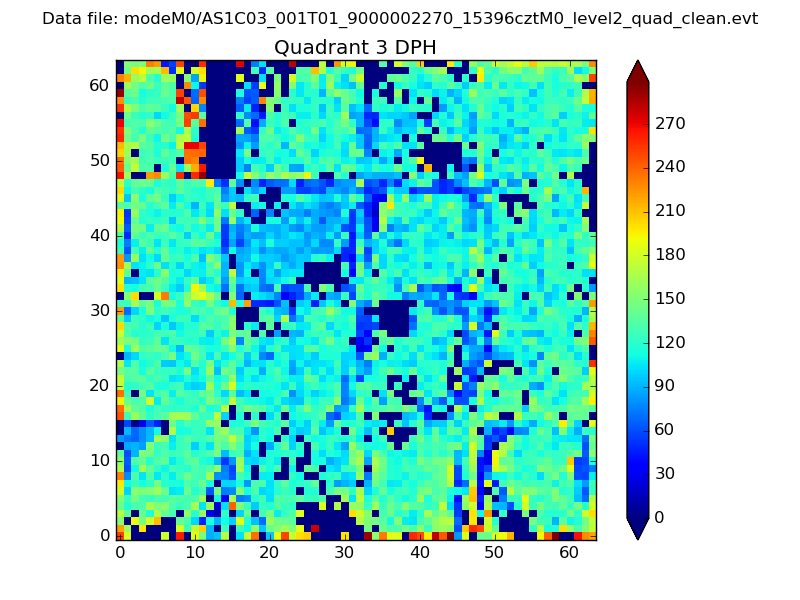 |
 |
Quadrant C |
| Plot type | Count rate plots | Images |
|---|---|---|
| Comparison with Poisson distribution Blue bars denote a histogram of data divided into 1 sec bins. Red curve is a Poisson curve with rate = median count rate of data. |
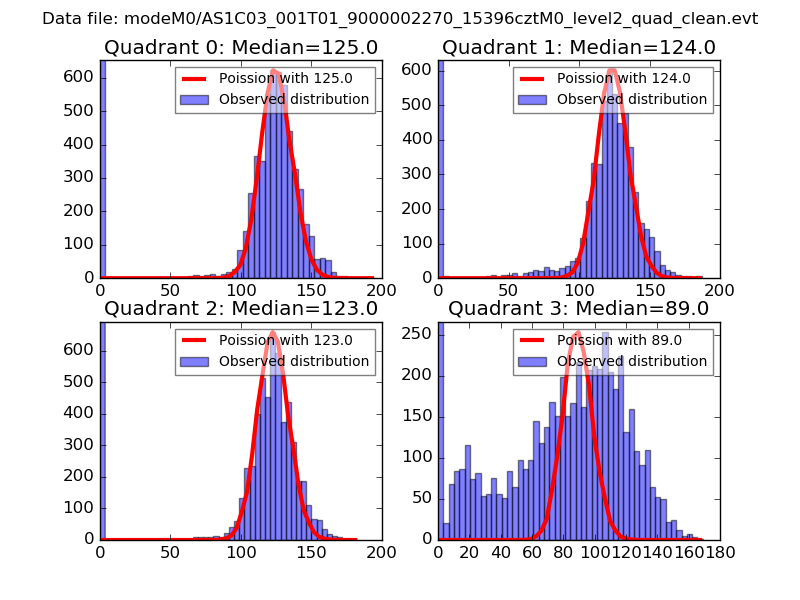 |
 |
| Quadrant-wise count rates Data is divided into 100 sec bins |
 |
|
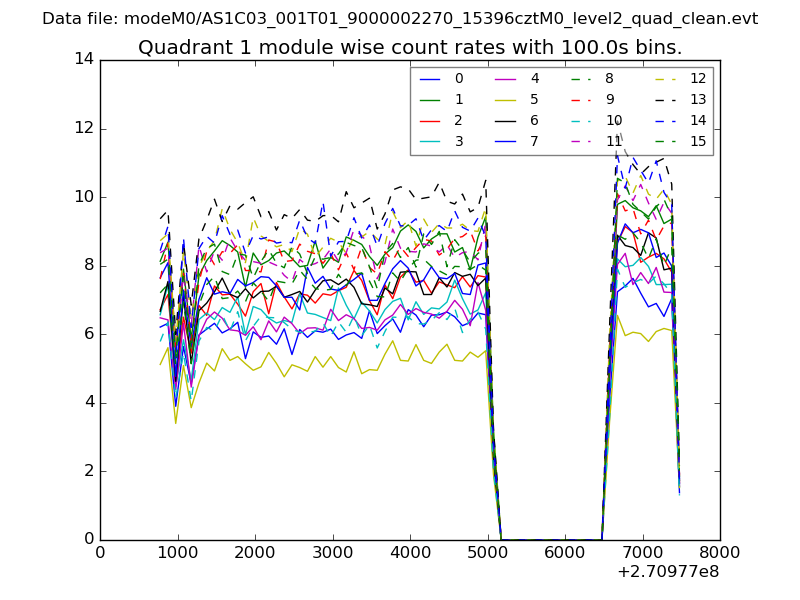
| Module-wise count rates for Quadrant A Data is divided into 100 sec bins |
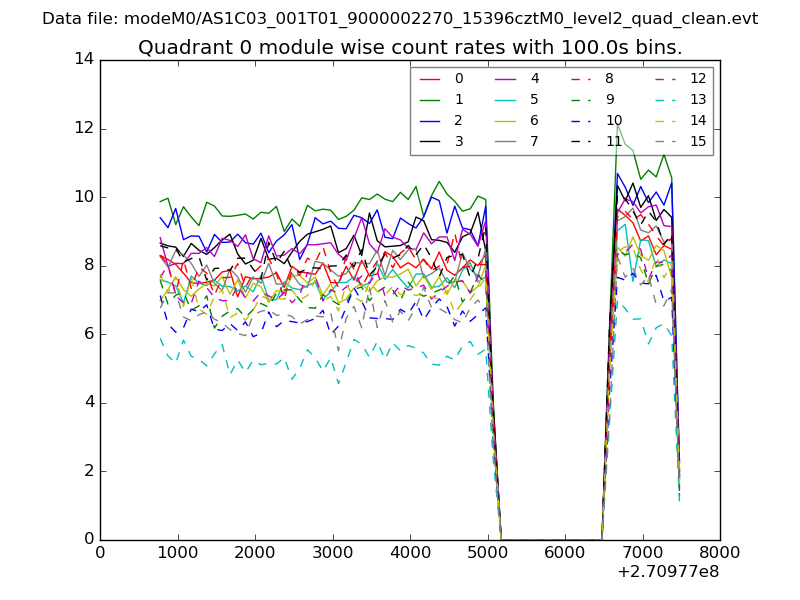 |
 |
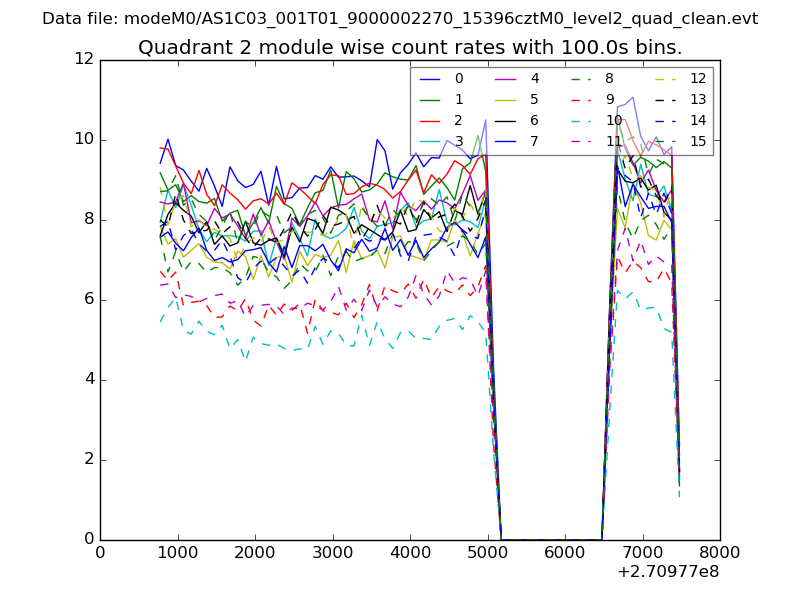
| Module-wise count rates for Quadrant B Data is divided into 100 sec bins |
 |
 |
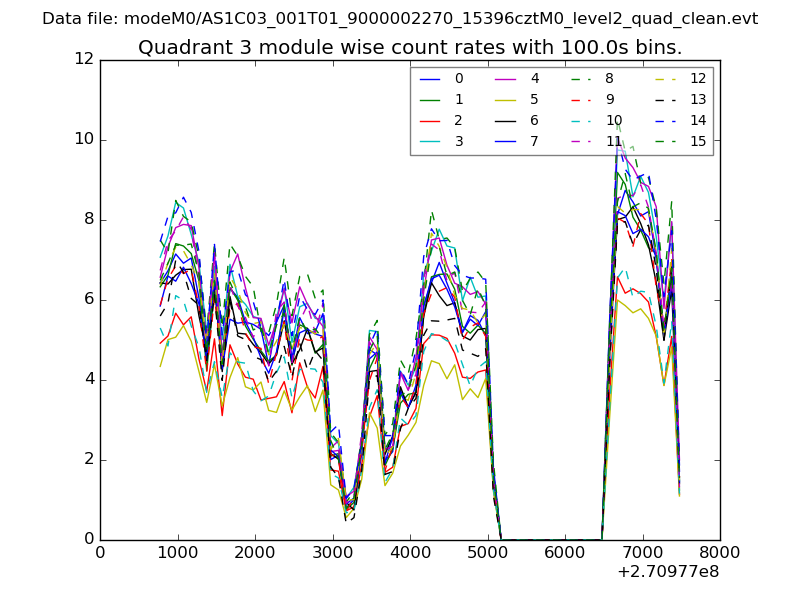
| Module-wise count rates for Quadrant C Data is divided into 100 sec bins |
 |
 |
| Module-wise count rates for Quadrant D Data is divided into 100 sec bins |
 |
 |
| Parameter | Plot |
|---|---|
| CZT HV Monitor | 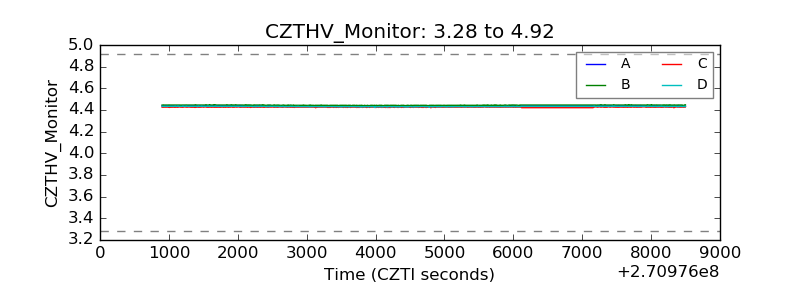 |
| D_VDD | 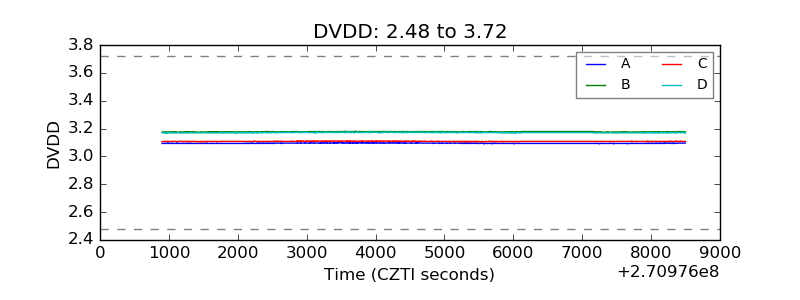 |
| Temperature 1 | 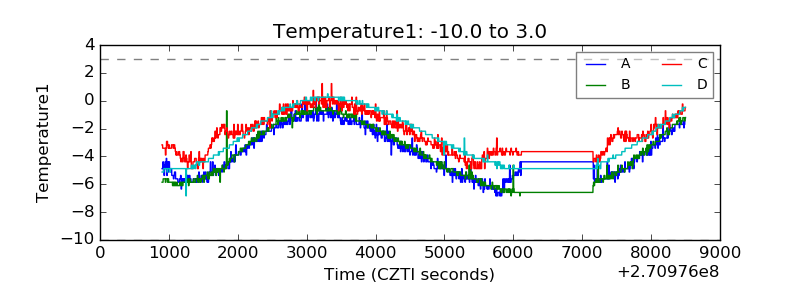 |
| Veto HV Monitor | 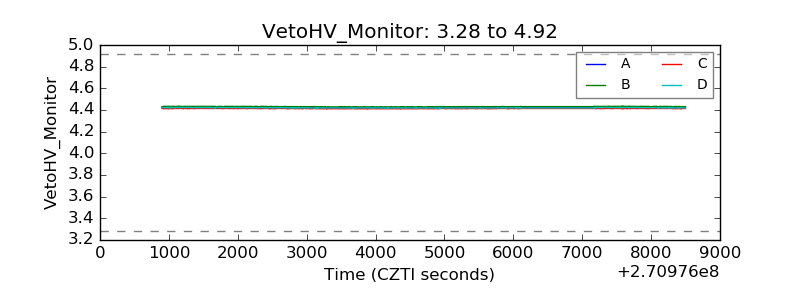 |
| Veto LLD | 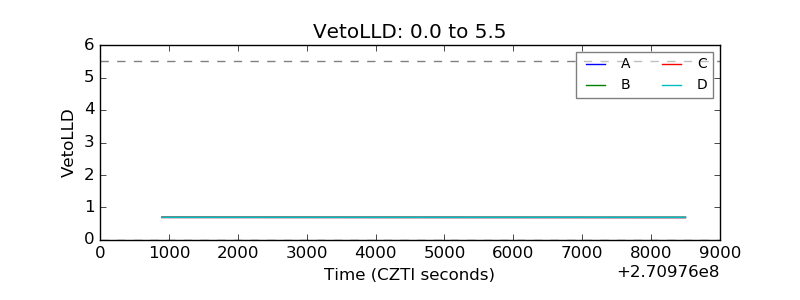 |
| Alpha Counter | 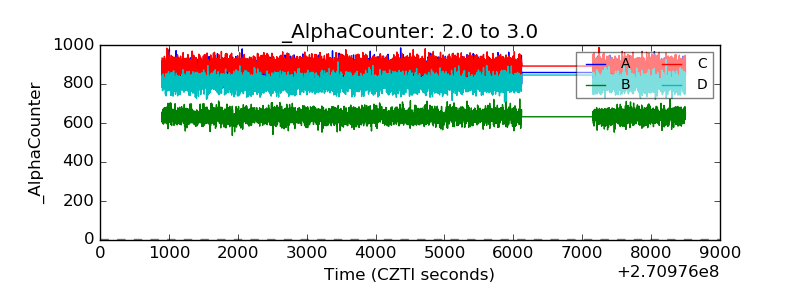 |
| _CPM_Rate | 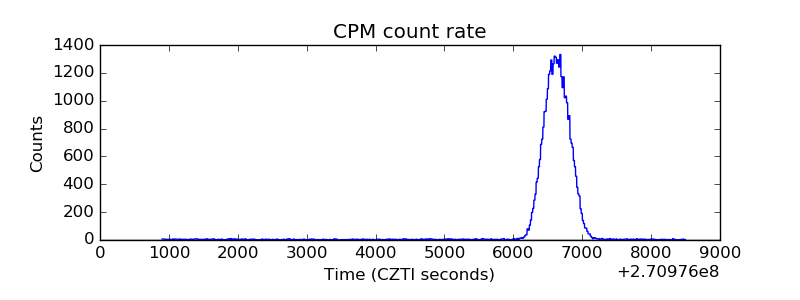 |
| CZT Counter | 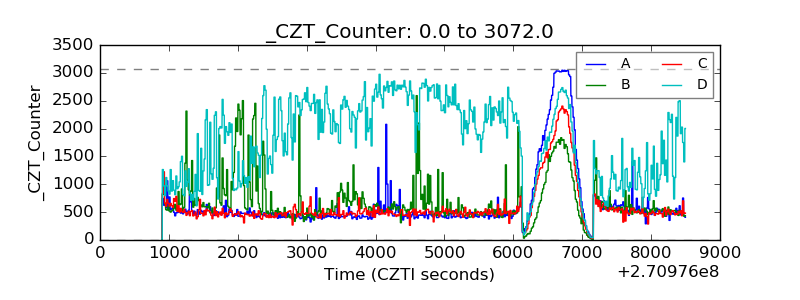 |
| +2.5 Volts monitor |  |
| +5 Volts monitor |  |
| _ROLL_ROT | 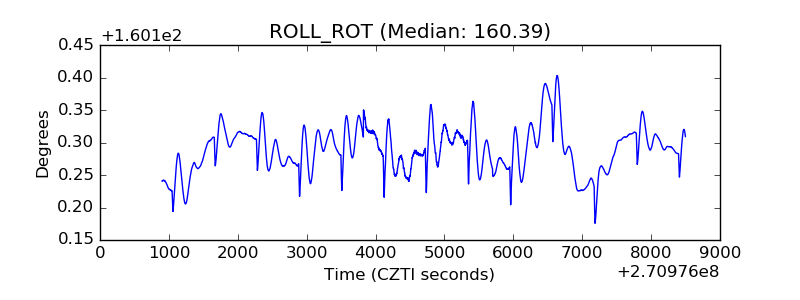 |
| _Roll_DEC | 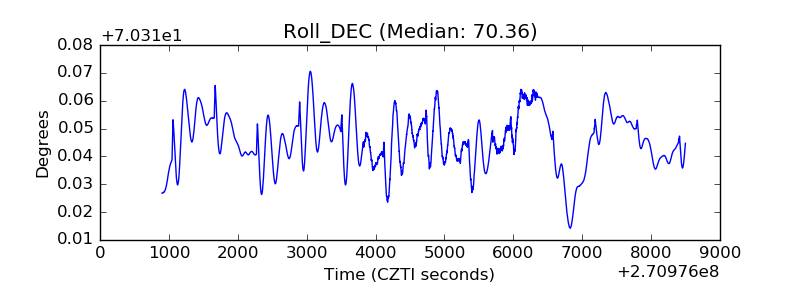 |
| _Roll_RA | 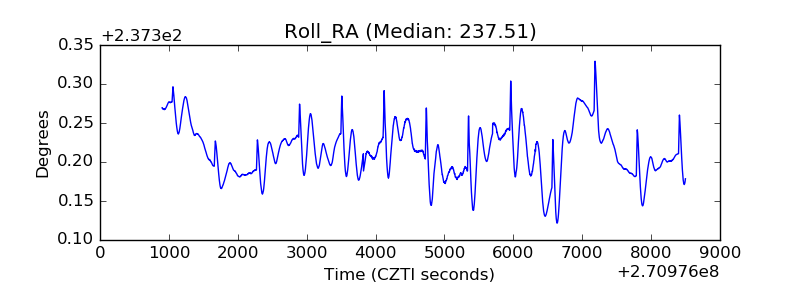 |
| Veto Counter | 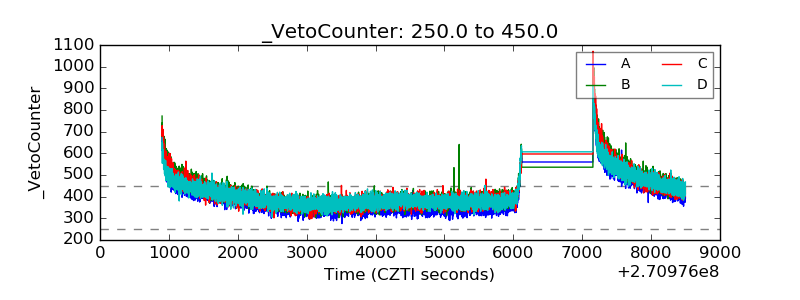 |