| Param | Original file | Final file |
|---|---|---|
| Filename | modeM0/AS1G08_072T01_9000002272cztM0_level2.fits | modeM0/AS1G08_072T01_9000002272cztM0_level2_quad_clean.evt |
| Size (bytes) | 663,762,240 | 625,106,880 |
| Size | 633.0 MB | 596.1 MB |
| Events in quadrant A | 4,132,878 | 3,788,583 |
| Events in quadrant B | 3,957,870 | 3,845,108 |
| Events in quadrant C | 4,036,150 | 3,685,441 |
| Events in quadrant D | 3,174,898 | 2,817,312 |
| Mode SS | |||
|---|---|---|---|
| Quadrant | BADHDUFLAG | Total packets | Discarded packets |
| A | 0 | 1420 | 0 |
| B | 0 | 1420 | 0 |
| C | 0 | 1420 | 0 |
| D | 0 | 1418 | 0 |
| Mode M9 | |||
|---|---|---|---|
| Quadrant | BADHDUFLAG | Total packets | Discarded packets |
| A | 0 | 115 | 0 |
| B | 0 | 115 | 0 |
| C | 0 | 115 | 0 |
| D | 0 | 115 | 0 |
| Mode M0 | |||
|---|---|---|---|
| Quadrant | BADHDUFLAG | Total packets | Discarded packets |
| A | 0 | 152026 | 0 |
| B | 0 | 156265 | 0 |
| C | 0 | 156747 | 0 |
| D | 0 | 274219 | 0 |
| Quadrant | Total seconds | Saturated seconds | Saturation percentage |
|---|---|---|---|
| A | 69923 | 1324 | 1.893511% |
| B | 69926 | 1147 | 1.640305% |
| C | 69919 | 984 | 1.407343% |
| D | 69919 | 12691 | 18.151003% |
Noise dominated data is calculated using 1-second bins in cleaned event files. If a bin has >2000 counts, and if more than 50% of those come from <1% of pixels, then it is considered to be noise-dominated and hence unusable.
| Quadrant | # 1 sec bins | Bins with >0 counts | Bins with >2000 counts | High rate bins dominated by noise | Noise dominated (total time) | Noise dominated (detector-on time) | Marked lightcurve |
|---|---|---|---|---|---|---|---|
| A | 81317 | 69908 | 0 | 0 | 0.00% | 0.00% |  |
| B | 81317 | 69918 | 0 | 0 | 0.00% | 0.00% |  |
| C | 81317 | 69919 | 0 | 0 | 0.00% | 0.00% |  |
| D | 81317 | 69841 | 0 | 0 | 0.00% | 0.00% |  |
Top three noisy pixels from each quadrant. If the there are fewer than three noisy pixels in the level2.evt file, extra rows are filled as -1
| Pixel properties | Quadrant properties | ||||||
|---|---|---|---|---|---|---|---|
| Quadrant | DetID | PixID | Counts | Sigma | Mean | Median | Sigma |
| A | 0 | 29 | 4060 | 11.5 | 1077 | 1012 | 265.0 |
| A | 7 | 110 | 3367 | 8.89 | 1077 | 1012 | 265.0 |
| A | 0 | 30 | 3085 | 7.82 | 1077 | 1012 | 265.0 |
| B | 2 | 9 | 3258 | 10.99 | 1048 | 1002 | 205.2 |
| B | 2 | 8 | 2720 | 8.37 | 1048 | 1002 | 205.2 |
| B | 3 | 17 | 2703 | 8.29 | 1048 | 1002 | 205.2 |
| C | 12 | 241 | 2764 | 6.44 | 1066 | 992 | 275.2 |
| C | 7 | 111 | 2713 | 6.25 | 1066 | 992 | 275.2 |
| C | 9 | 242 | 2682 | 6.14 | 1066 | 992 | 275.2 |
| D | 6 | 231 | 2346 | 6.3 | 907 | 823 | 241.7 |
| D | 6 | 38 | 2252 | 5.91 | 907 | 823 | 241.7 |
| D | 6 | 67 | 2205 | 5.72 | 907 | 823 | 241.7 |
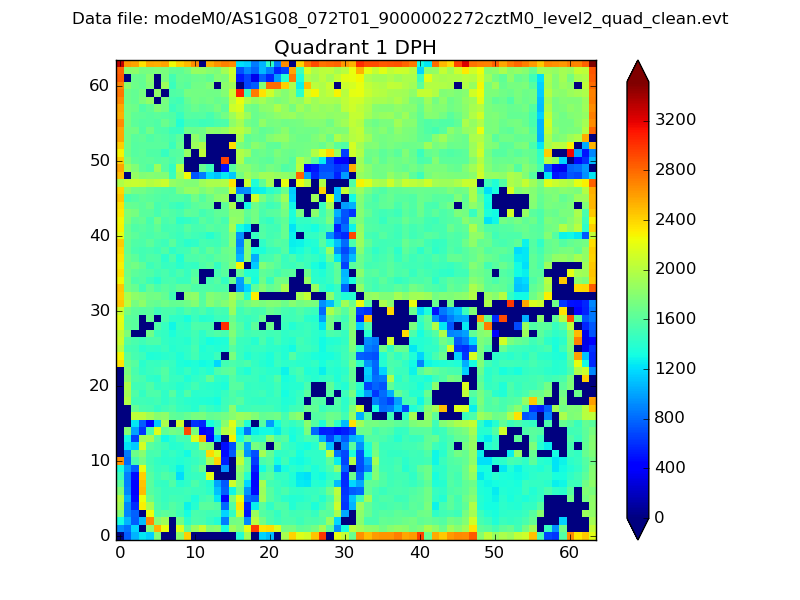
Histogram calculated using DETX and DETY for each event in the final _common_clean file
| Quadrant A |  |
 |
Quadrant B |
|---|---|---|---|
| Quadrant D |  |
 |
Quadrant C |
| Plot type | Count rate plots | Images |
|---|---|---|
| Comparison with Poisson distribution Blue bars denote a histogram of data divided into 1 sec bins. Red curve is a Poisson curve with rate = median count rate of data. |
 |
 |
| Quadrant-wise count rates Data is divided into 100 sec bins |
 |
|
| Module-wise count rates for Quadrant A Data is divided into 100 sec bins |
 |
 |
| Module-wise count rates for Quadrant B Data is divided into 100 sec bins |
 |
 |
| Module-wise count rates for Quadrant C Data is divided into 100 sec bins |
 |
 |
| Module-wise count rates for Quadrant D Data is divided into 100 sec bins |
 |
 |
| Parameter | Plot |
|---|---|
| CZT HV Monitor |  |
| D_VDD |  |
| Temperature 1 |  |
| Veto HV Monitor |  |
| Veto LLD | 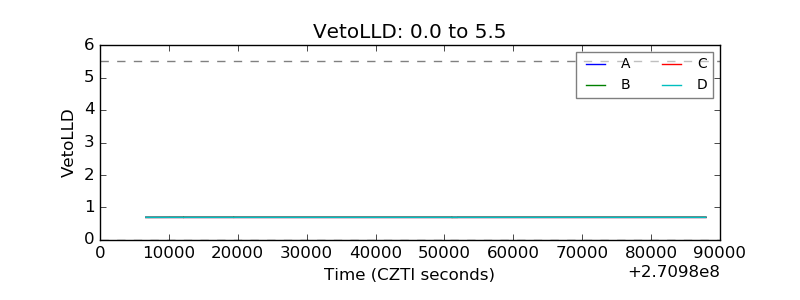 |
| Alpha Counter |  |
| _CPM_Rate |  |
| CZT Counter |  |
| +2.5 Volts monitor |  |
| +5 Volts monitor |  |
| _ROLL_ROT |  |
| _Roll_DEC |  |
| _Roll_RA |  |
| Veto Counter |  |