| Param | Original file | Final file |
|---|---|---|
| Filename | modeM0/AS1G08_072T01_9000002272_15401cztM0_level2.evt | modeM0/AS1G08_072T01_9000002272_15401cztM0_level2_quad_clean.evt |
| Size (bytes) | 615,902,400 | 106,580,160 |
| Size | 587.4 MB | 101.6 MB |
| Events in quadrant A | 3,084,020 | 733,527 |
| Events in quadrant B | 3,873,762 | 732,701 |
| Events in quadrant C | 3,129,605 | 724,198 |
| Events in quadrant D | 8,161,926 | 620,813 |
| Mode SS | |||
|---|---|---|---|
| Quadrant | BADHDUFLAG | Total packets | Discarded packets |
| A | 0 | 120 | 0 |
| B | 0 | 120 | 0 |
| C | 0 | 120 | 0 |
| D | 0 | 120 | 0 |
| Mode M9 | |||
|---|---|---|---|
| Quadrant | BADHDUFLAG | Total packets | Discarded packets |
| A | 0 | 13 | 0 |
| B | 0 | 13 | 0 |
| C | 0 | 13 | 0 |
| D | 0 | 13 | 0 |
| Mode M0 | |||
|---|---|---|---|
| Quadrant | BADHDUFLAG | Total packets | Discarded packets |
| A | 0 | 12875 | 1 |
| B | 0 | 15384 | 0 |
| C | 0 | 13050 | 0 |
| D | 0 | 28390 | 0 |
| Quadrant | Total seconds | Saturated seconds | Saturation percentage |
|---|---|---|---|
| A | 5964 | 114 | 1.911469% |
| B | 5964 | 220 | 3.688799% |
| C | 5964 | 82 | 1.374916% |
| D | 5964 | 1750 | 29.342723% |
Noise dominated data is calculated using 1-second bins in cleaned event files. If a bin has >2000 counts, and if more than 50% of those come from <1% of pixels, then it is considered to be noise-dominated and hence unusable.
| Quadrant | # 1 sec bins | Bins with >0 counts | Bins with >2000 counts | High rate bins dominated by noise | Noise dominated (total time) | Noise dominated (detector-on time) | Marked lightcurve |
|---|---|---|---|---|---|---|---|
| A | 7245 | 5965 | 5 | 5 | 0.07% | 0.08% | 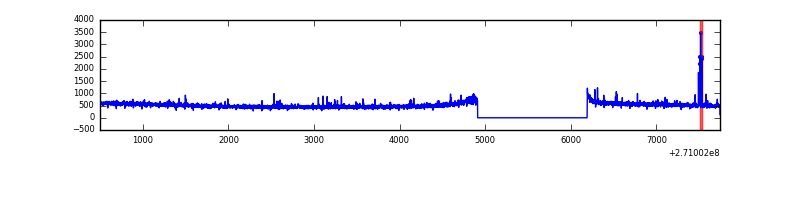 |
| B | 7245 | 5965 | 83 | 83 | 1.15% | 1.39% | 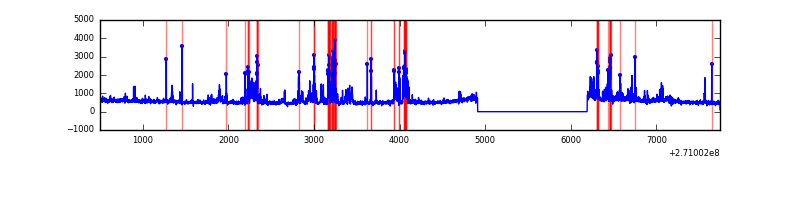 |
| C | 7245 | 5966 | 1 | 1 | 0.01% | 0.02% | 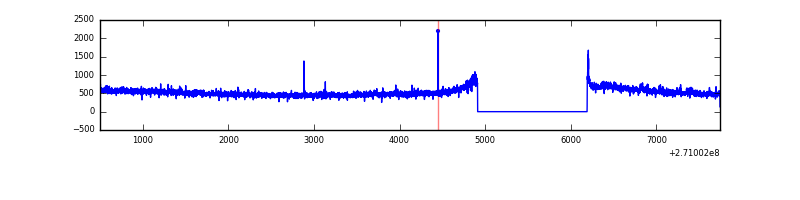 |
| D | 7245 | 5965 | 1475 | 1475 | 20.36% | 24.73% | 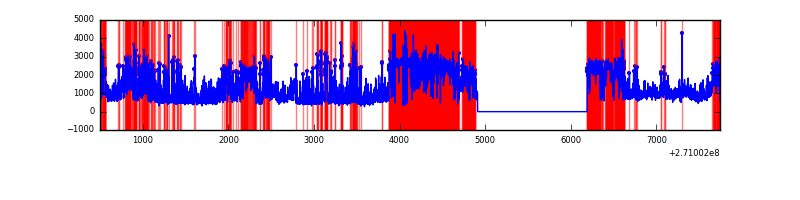 |
Top three noisy pixels from each quadrant. If the there are fewer than three noisy pixels in the level2.evt file, extra rows are filled as -1
| Pixel properties | Quadrant properties | ||||||
|---|---|---|---|---|---|---|---|
| Quadrant | DetID | PixID | Counts | Sigma | Mean | Median | Sigma |
| A | 14 | 238 | 44572 | 279.88 | 780 | 766 | 156.5 |
| A | 9 | 143 | 17810 | 108.89 | 780 | 766 | 156.5 |
| A | 12 | 96 | 9310 | 54.59 | 780 | 766 | 156.5 |
| B | 10 | 16 | 429376 | 2974.7 | 768 | 754 | 144.1 |
| B | 0 | 197 | 136773 | 943.99 | 768 | 754 | 144.1 |
| B | 8 | 3 | 74737 | 513.45 | 768 | 754 | 144.1 |
| C | 3 | 233 | 131236 | 777.2 | 738 | 744 | 167.9 |
| C | 7 | 247 | 68603 | 404.16 | 738 | 744 | 167.9 |
| C | 3 | 9 | 47414 | 277.96 | 738 | 744 | 167.9 |
| D | 7 | 223 | 2488601 | 15603.99 | 656 | 637 | 159.4 |
| D | 13 | 122 | 1457872 | 9139.47 | 656 | 637 | 159.4 |
| D | 9 | 68 | 1052691 | 6598.26 | 656 | 637 | 159.4 |
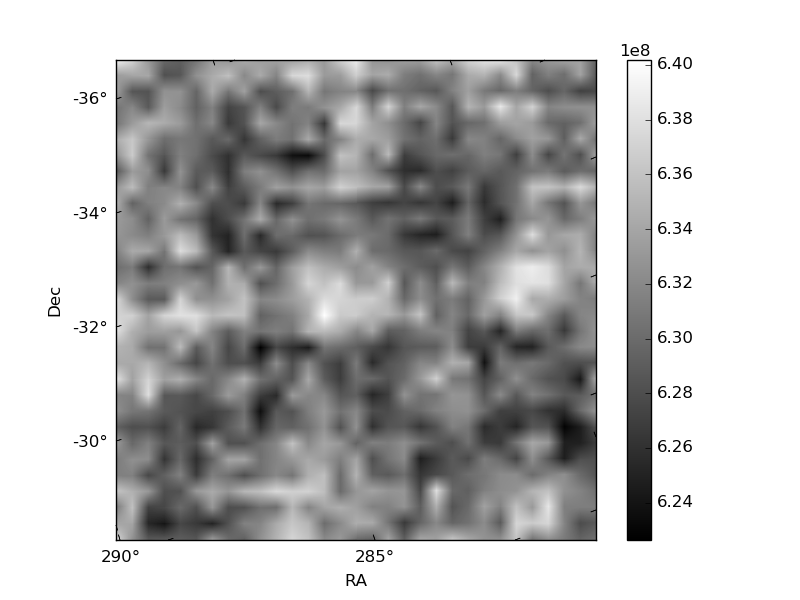
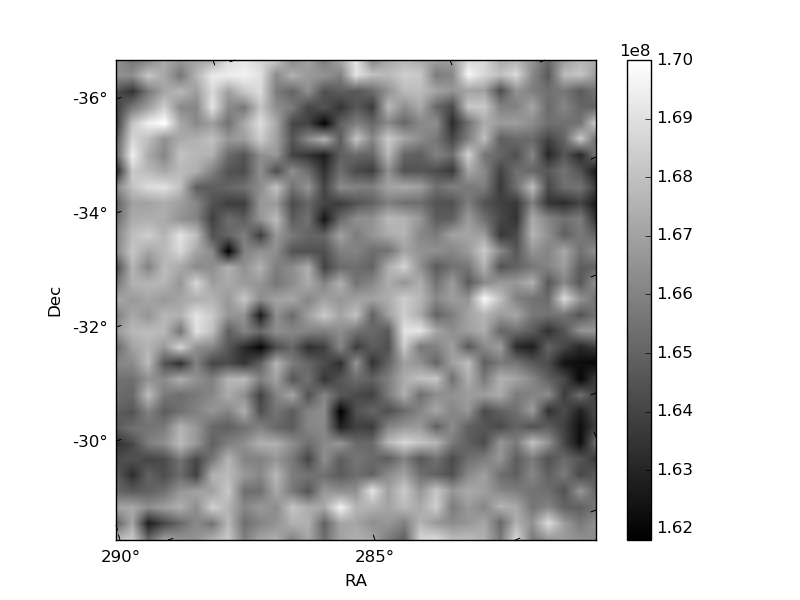
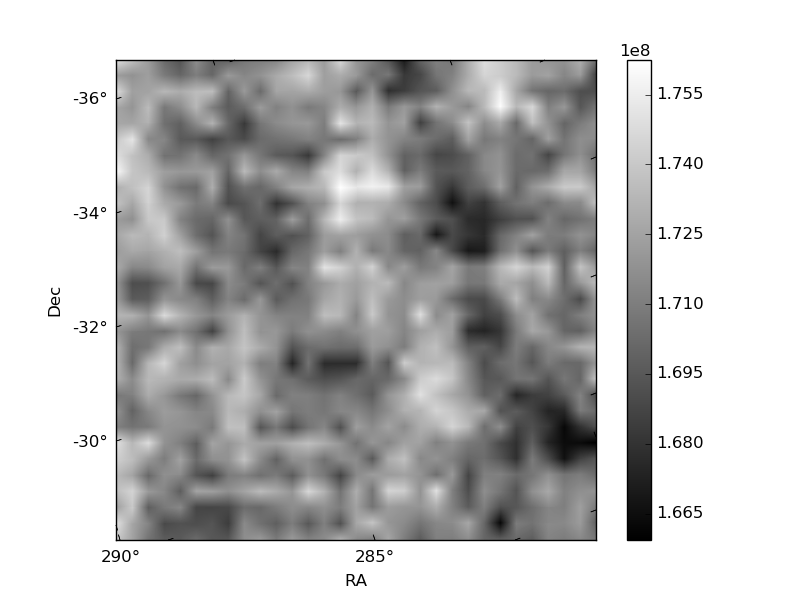
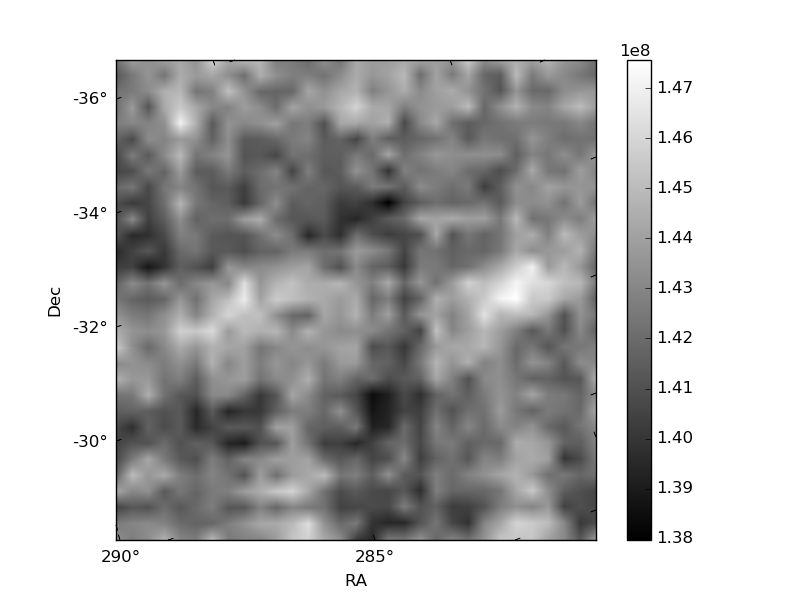
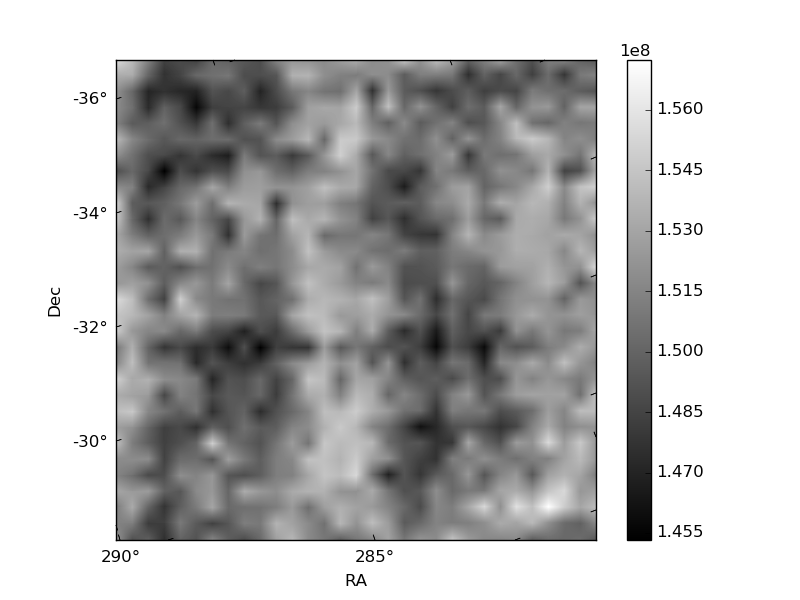
Histogram calculated using DETX and DETY for each event in the final _common_clean file
| Quadrant A | 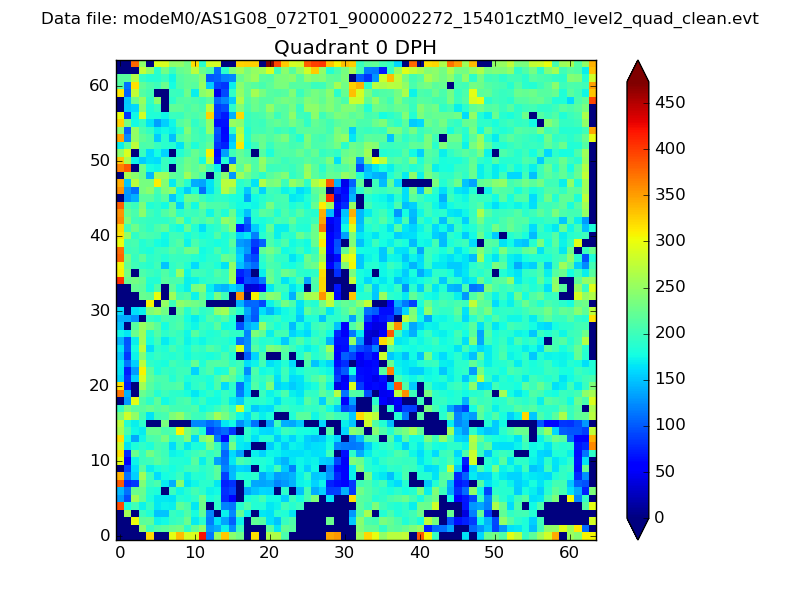 |
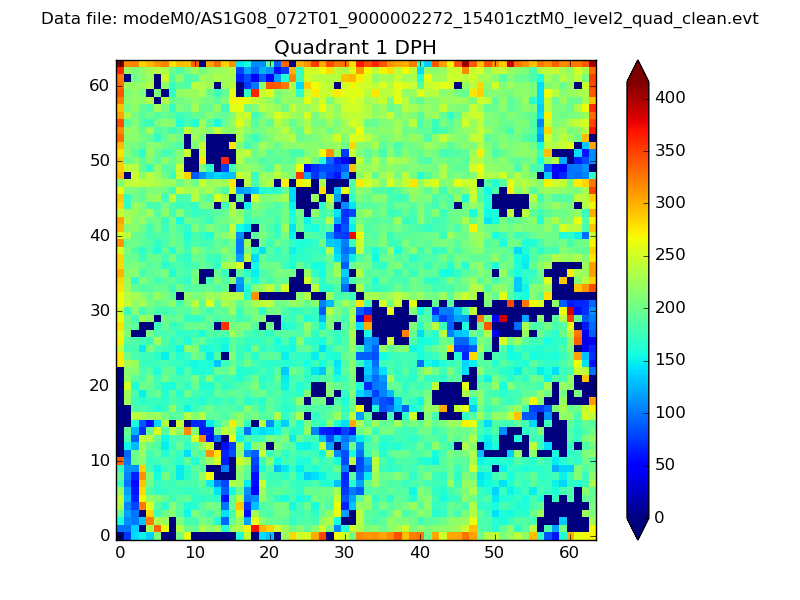 |
Quadrant B |
|---|---|---|---|
| Quadrant D | 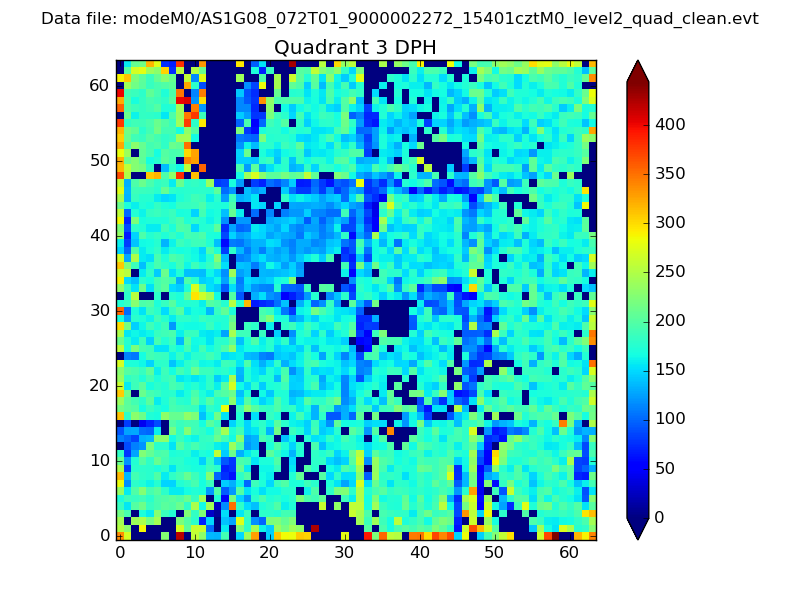 |
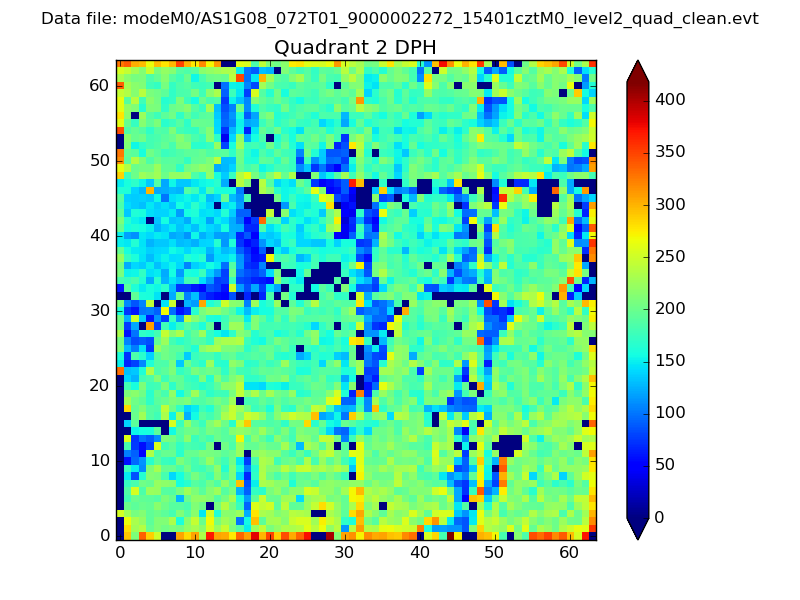 |
Quadrant C |
| Plot type | Count rate plots | Images |
|---|---|---|
| Comparison with Poisson distribution Blue bars denote a histogram of data divided into 1 sec bins. Red curve is a Poisson curve with rate = median count rate of data. |
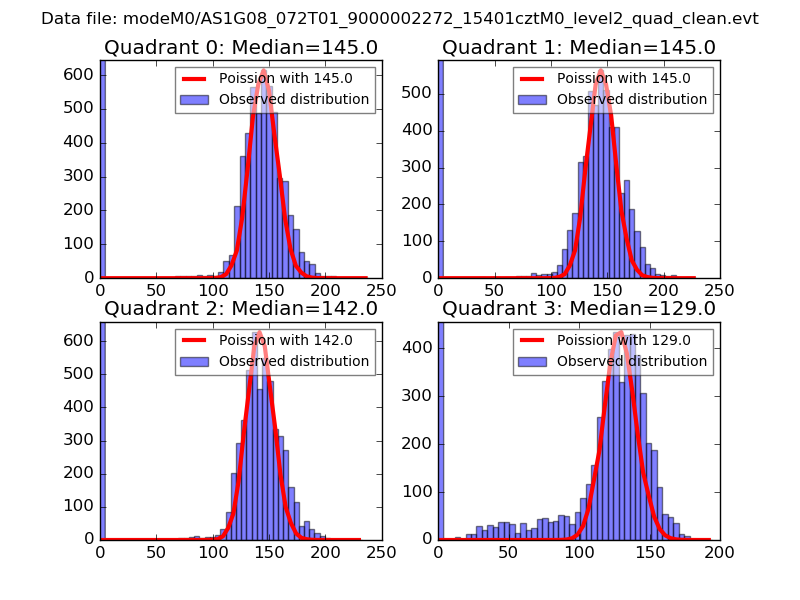 |
 |
| Quadrant-wise count rates Data is divided into 100 sec bins |
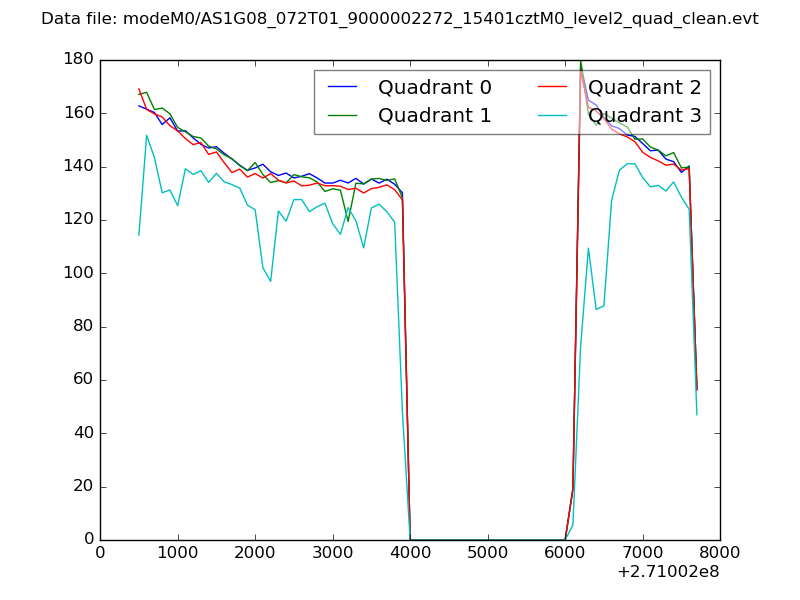 |
|
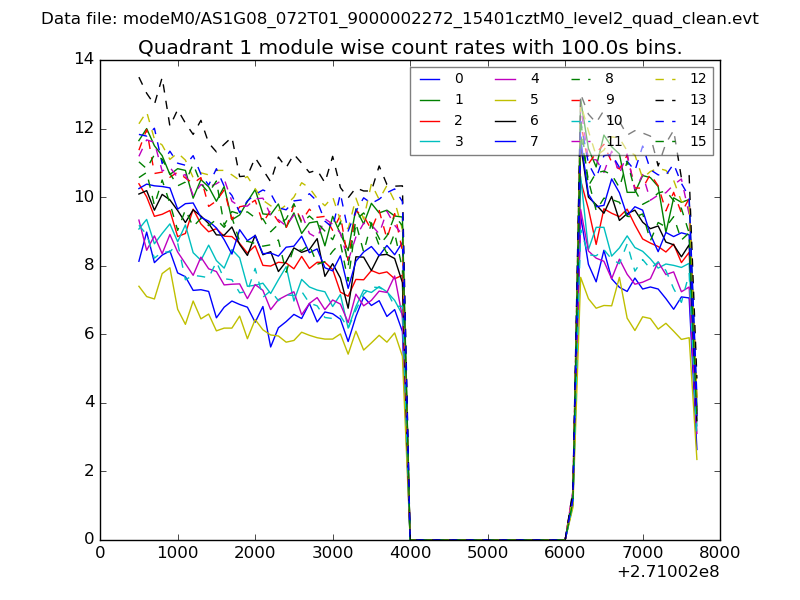
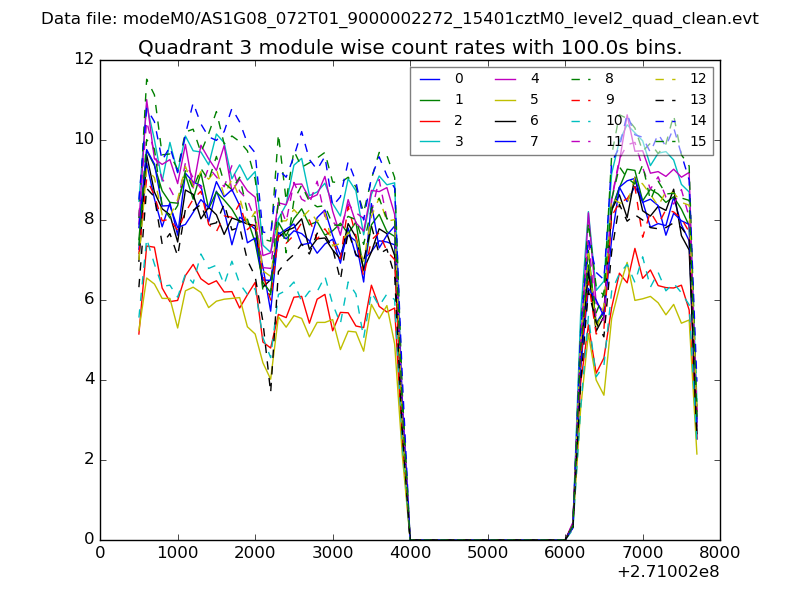
| Module-wise count rates for Quadrant A Data is divided into 100 sec bins |
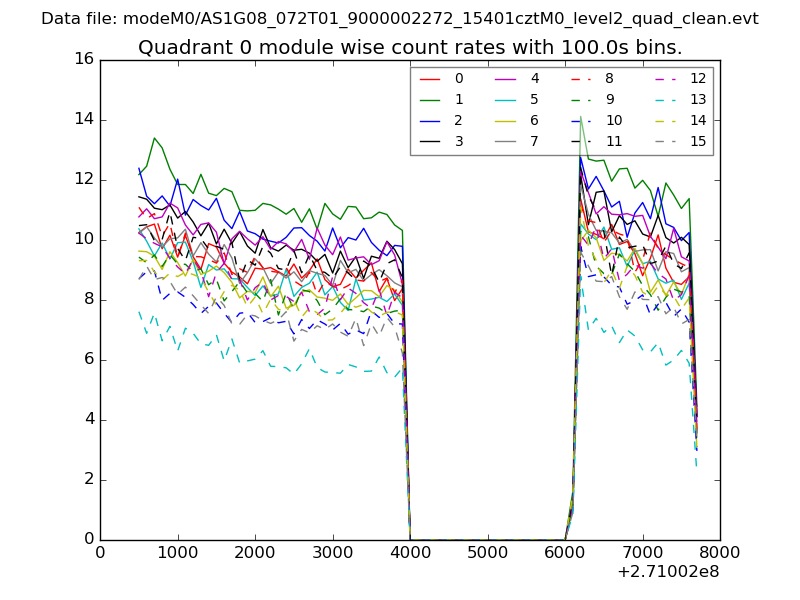 |
 |
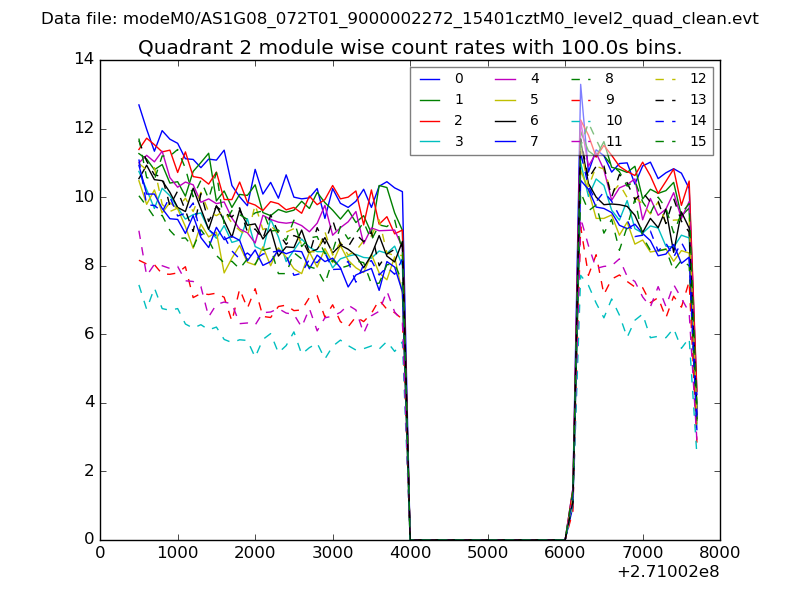
| Module-wise count rates for Quadrant B Data is divided into 100 sec bins |
 |
 |
| Module-wise count rates for Quadrant C Data is divided into 100 sec bins |
 |
 |
| Module-wise count rates for Quadrant D Data is divided into 100 sec bins |
 |
 |
| Parameter | Plot |
|---|---|
| CZT HV Monitor | 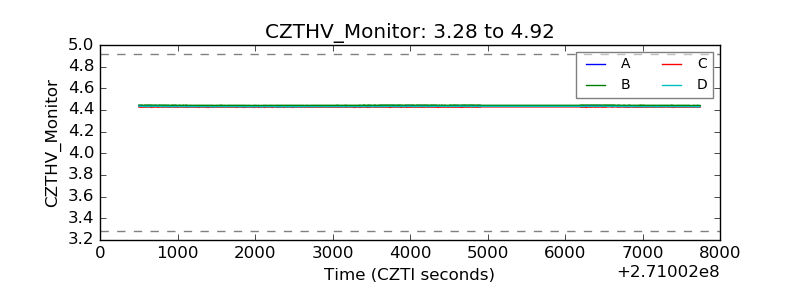 |
| D_VDD | 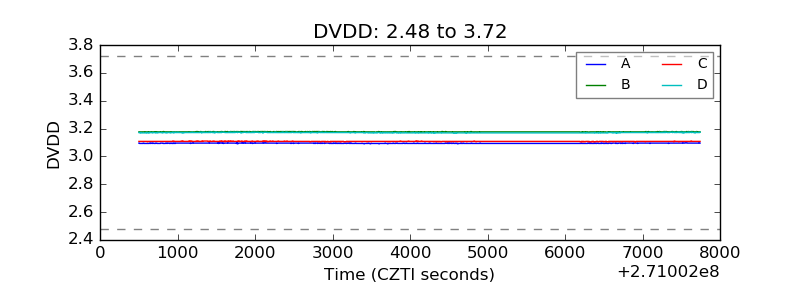 |
| Temperature 1 | 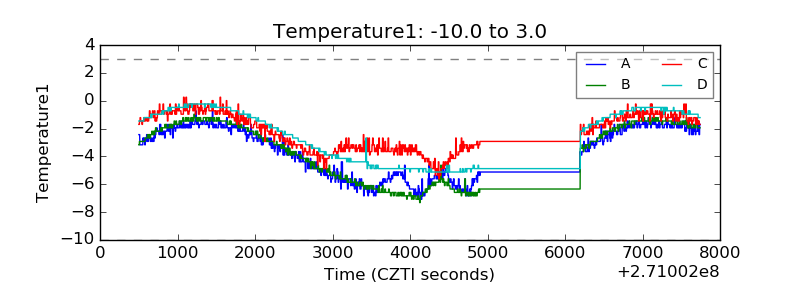 |
| Veto HV Monitor | 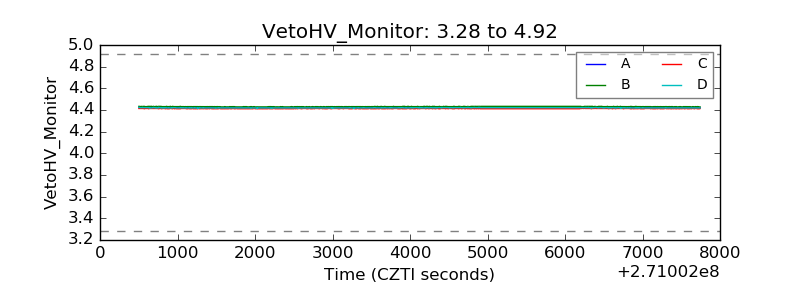 |
| Veto LLD | 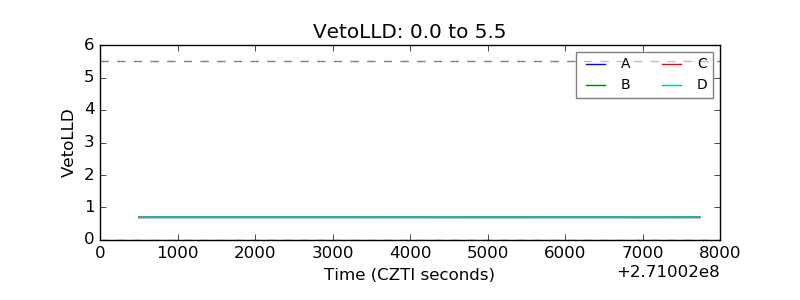 |
| Alpha Counter | 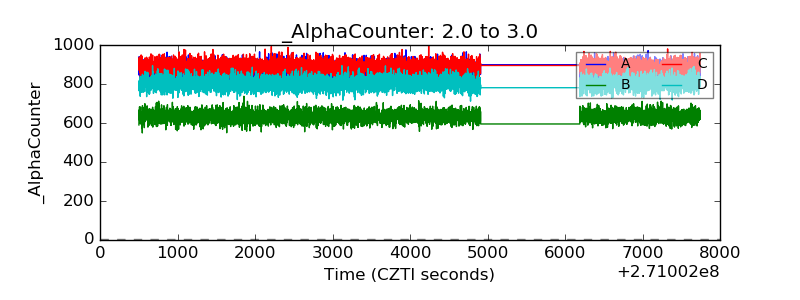 |
| _CPM_Rate | 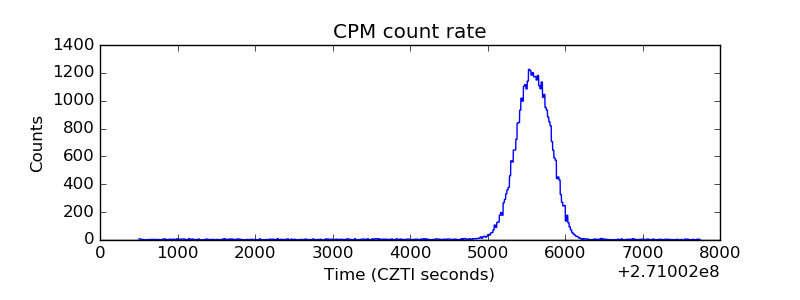 |
| CZT Counter | 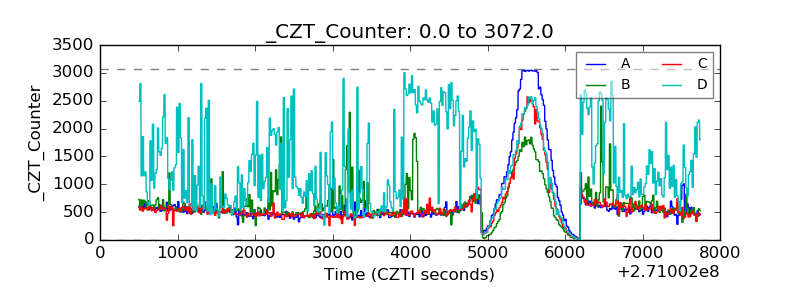 |
| +2.5 Volts monitor |  |
| +5 Volts monitor |  |
| _ROLL_ROT | 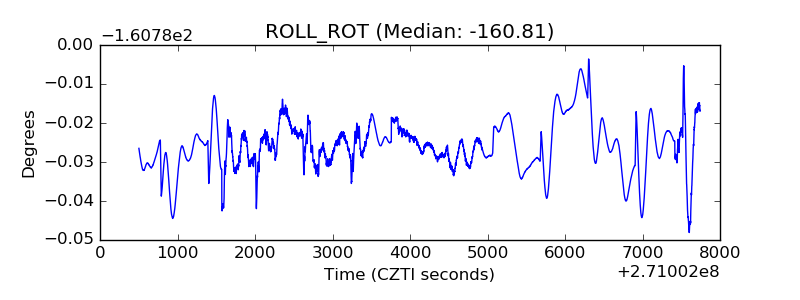 |
| _Roll_DEC | 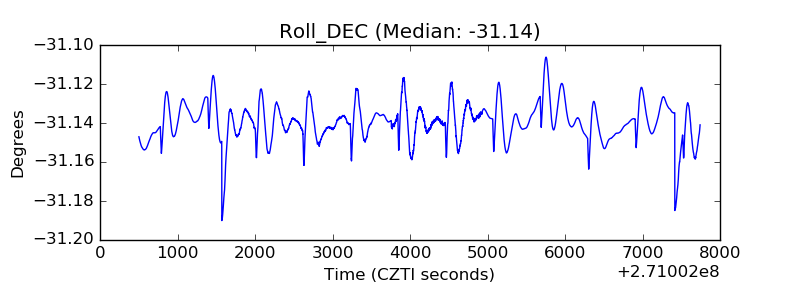 |
| _Roll_RA | 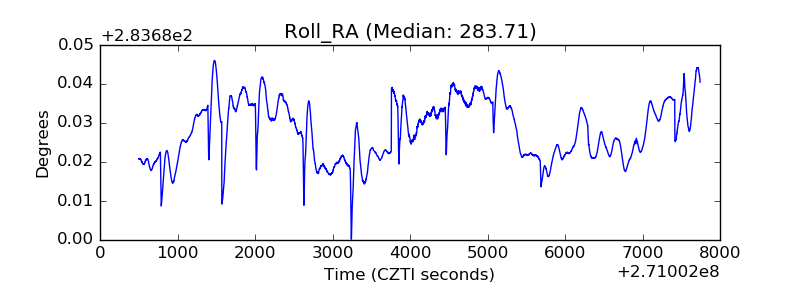 |
| Veto Counter | 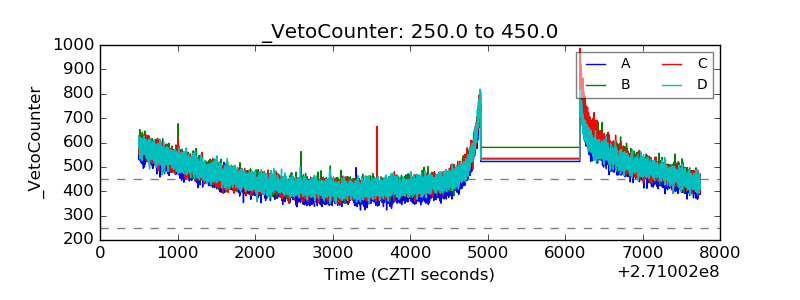 |