| Param | Original file | Final file |
|---|---|---|
| Filename | modeM0/AS1G08_072T01_9000002272_15402cztM0_level2.evt | modeM0/AS1G08_072T01_9000002272_15402cztM0_level2_quad_clean.evt |
| Size (bytes) | 587,894,400 | 107,850,240 |
| Size | 560.7 MB | 102.9 MB |
| Events in quadrant A | 3,588,146 | 720,382 |
| Events in quadrant B | 3,985,573 | 725,953 |
| Events in quadrant C | 3,411,929 | 713,574 |
| Events in quadrant D | 6,367,674 | 641,907 |
| Mode SS | |||
|---|---|---|---|
| Quadrant | BADHDUFLAG | Total packets | Discarded packets |
| A | 0 | 136 | 0 |
| B | 0 | 136 | 0 |
| C | 0 | 136 | 0 |
| D | 0 | 136 | 0 |
| Mode M9 | |||
|---|---|---|---|
| Quadrant | BADHDUFLAG | Total packets | Discarded packets |
| A | 0 | 11 | 0 |
| B | 0 | 11 | 0 |
| C | 0 | 11 | 0 |
| D | 0 | 12 | 0 |
| Mode M0 | |||
|---|---|---|---|
| Quadrant | BADHDUFLAG | Total packets | Discarded packets |
| A | 0 | 14937 | 2 |
| B | 0 | 16151 | 1 |
| C | 0 | 14484 | 1 |
| D | 0 | 23507 | 1 |
| Quadrant | Total seconds | Saturated seconds | Saturation percentage |
|---|---|---|---|
| A | 6657 | 151 | 2.268289% |
| B | 6657 | 204 | 3.064443% |
| C | 6657 | 74 | 1.111612% |
| D | 6657 | 662 | 9.944419% |
Noise dominated data is calculated using 1-second bins in cleaned event files. If a bin has >2000 counts, and if more than 50% of those come from <1% of pixels, then it is considered to be noise-dominated and hence unusable.
| Quadrant | # 1 sec bins | Bins with >0 counts | Bins with >2000 counts | High rate bins dominated by noise | Noise dominated (total time) | Noise dominated (detector-on time) | Marked lightcurve |
|---|---|---|---|---|---|---|---|
| A | 7803 | 6658 | 31 | 31 | 0.40% | 0.47% | 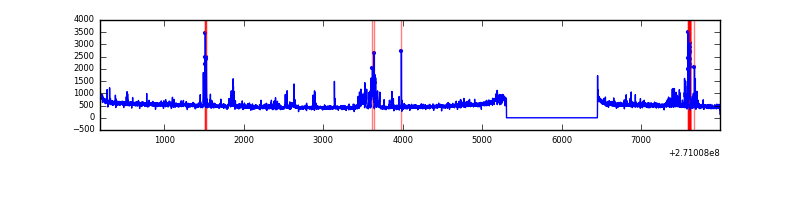 |
| B | 7803 | 6658 | 48 | 48 | 0.62% | 0.72% | 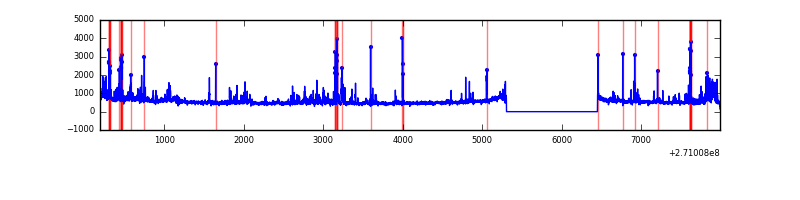 |
| C | 7803 | 6659 | 0 | 0 | 0.00% | 0.00% | 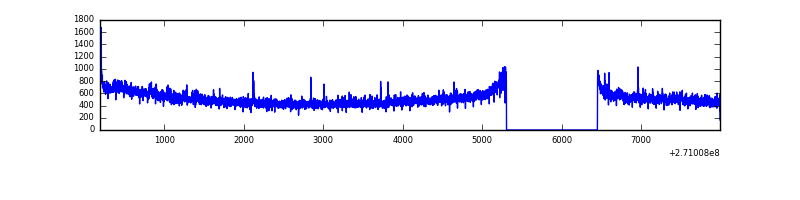 |
| D | 7803 | 6658 | 502 | 502 | 6.43% | 7.54% | 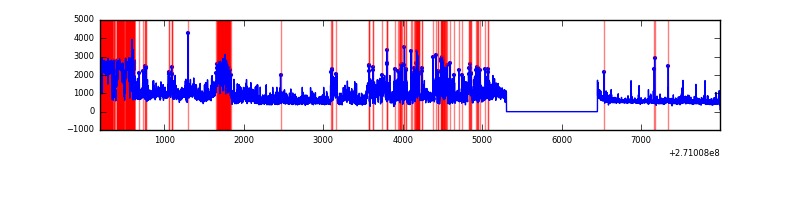 |
Top three noisy pixels from each quadrant. If the there are fewer than three noisy pixels in the level2.evt file, extra rows are filled as -1
| Pixel properties | Quadrant properties | ||||||
|---|---|---|---|---|---|---|---|
| Quadrant | DetID | PixID | Counts | Sigma | Mean | Median | Sigma |
| A | 7 | 16 | 235508 | 1359.7 | 848 | 831 | 172.6 |
| A | 14 | 238 | 68987 | 394.89 | 848 | 831 | 172.6 |
| A | 9 | 143 | 14775 | 80.79 | 848 | 831 | 172.6 |
| B | 10 | 16 | 360333 | 2265.18 | 841 | 824 | 158.7 |
| B | 0 | 190 | 85857 | 535.77 | 841 | 824 | 158.7 |
| B | 8 | 3 | 53125 | 329.54 | 841 | 824 | 158.7 |
| C | 3 | 233 | 130568 | 698.93 | 809 | 815 | 185.6 |
| C | 7 | 247 | 75828 | 404.07 | 809 | 815 | 185.6 |
| C | 3 | 9 | 47305 | 250.42 | 809 | 815 | 185.6 |
| D | 7 | 223 | 1604384 | 8338.24 | 786 | 762 | 192.3 |
| D | 13 | 122 | 779115 | 4047.15 | 786 | 762 | 192.3 |
| D | 9 | 68 | 706943 | 3671.88 | 786 | 762 | 192.3 |
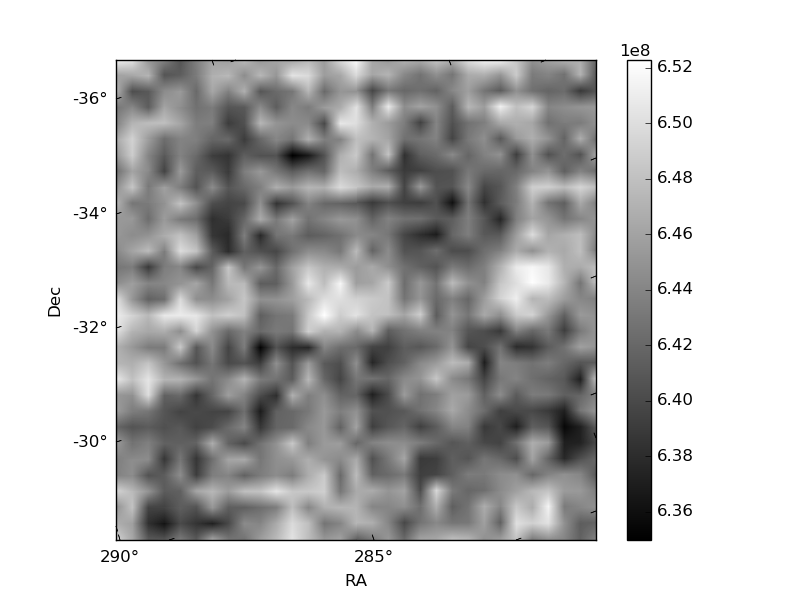
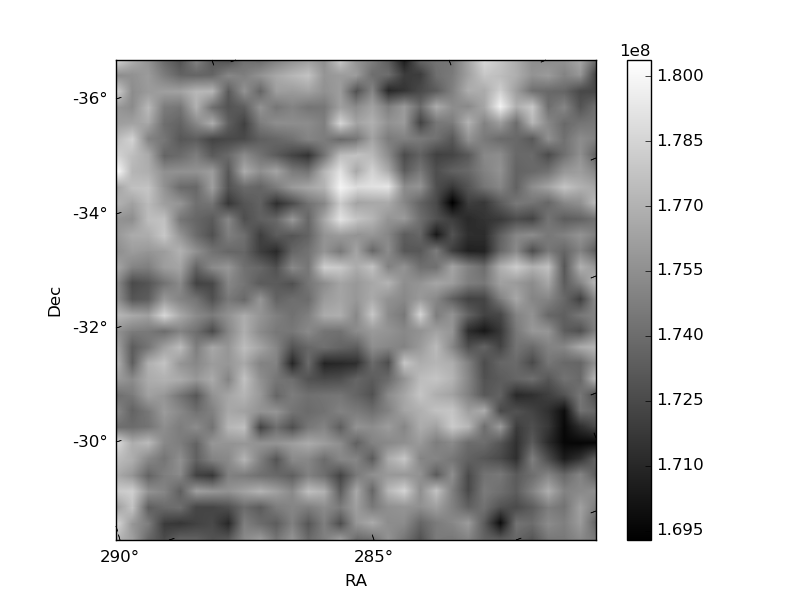
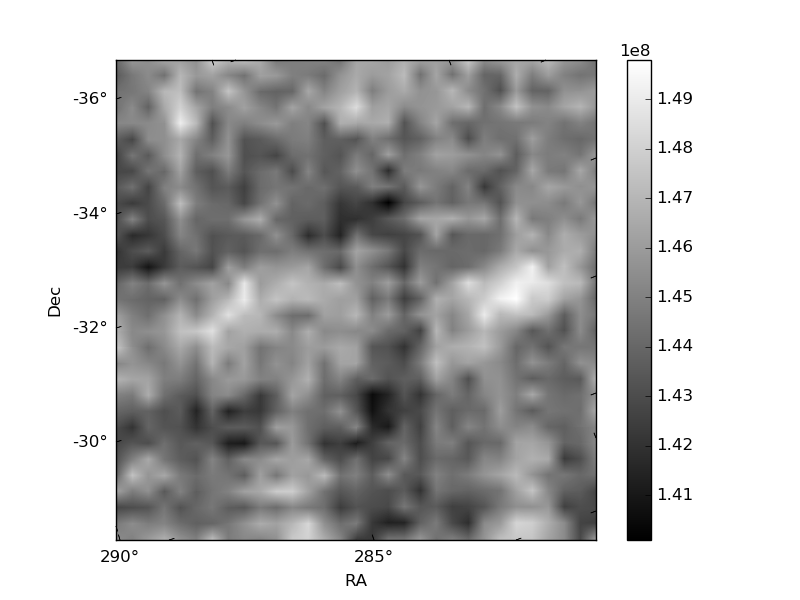
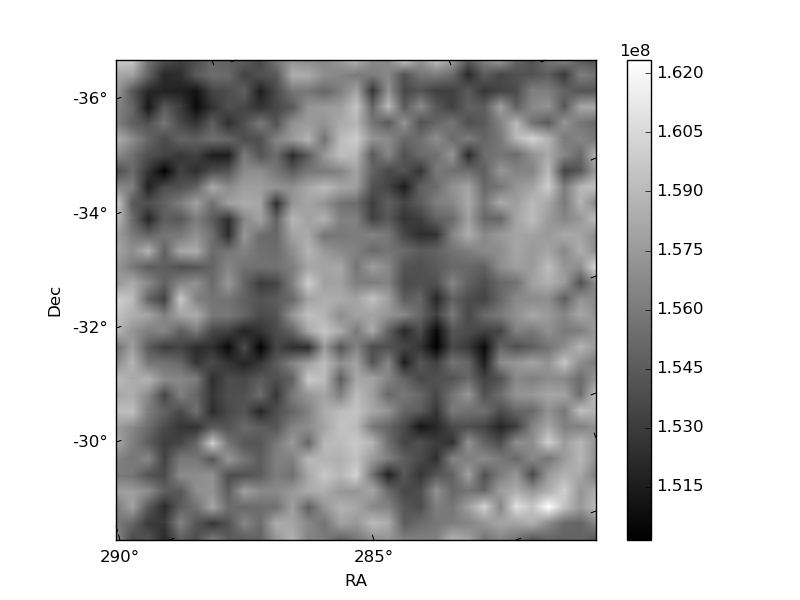
Histogram calculated using DETX and DETY for each event in the final _common_clean file
| Quadrant A | 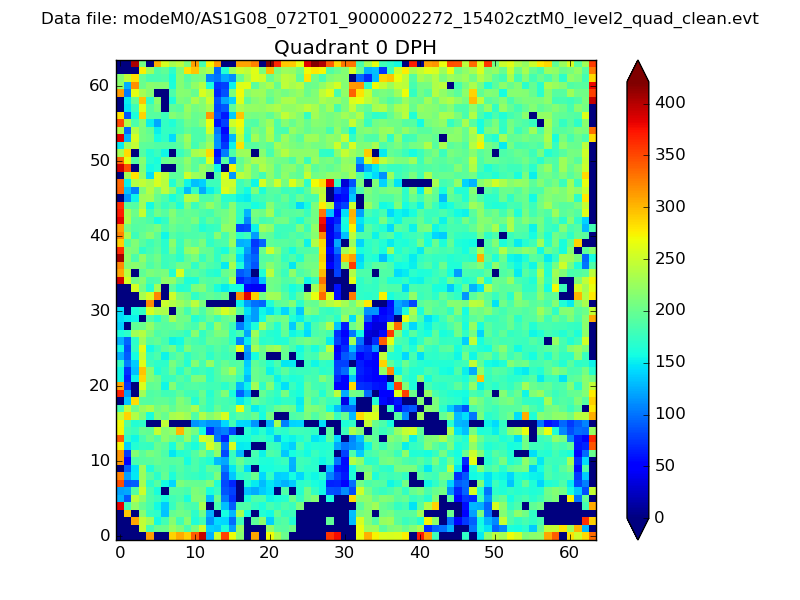 |
 |
Quadrant B |
|---|---|---|---|
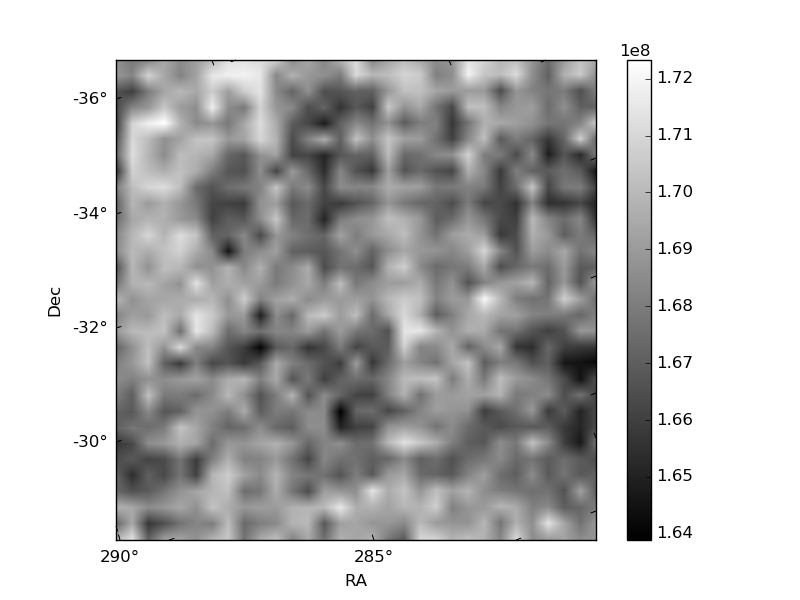
| Quadrant D | 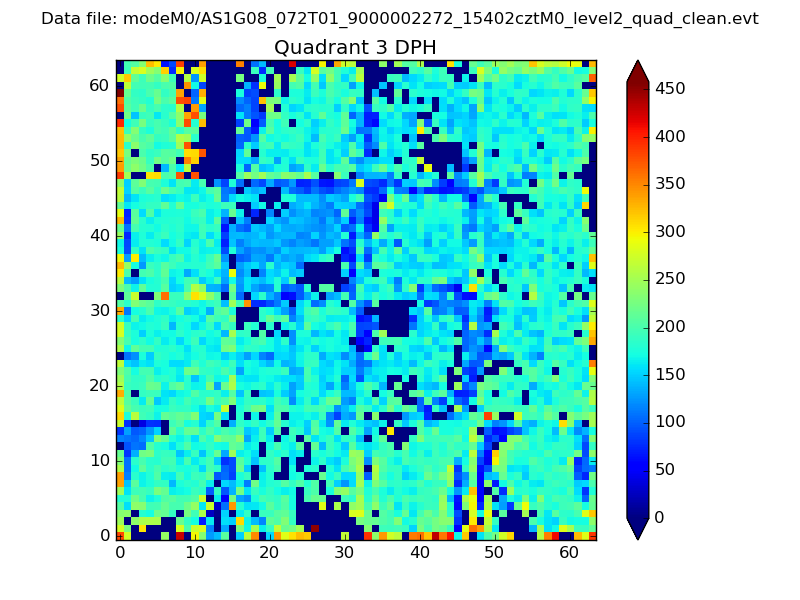 |
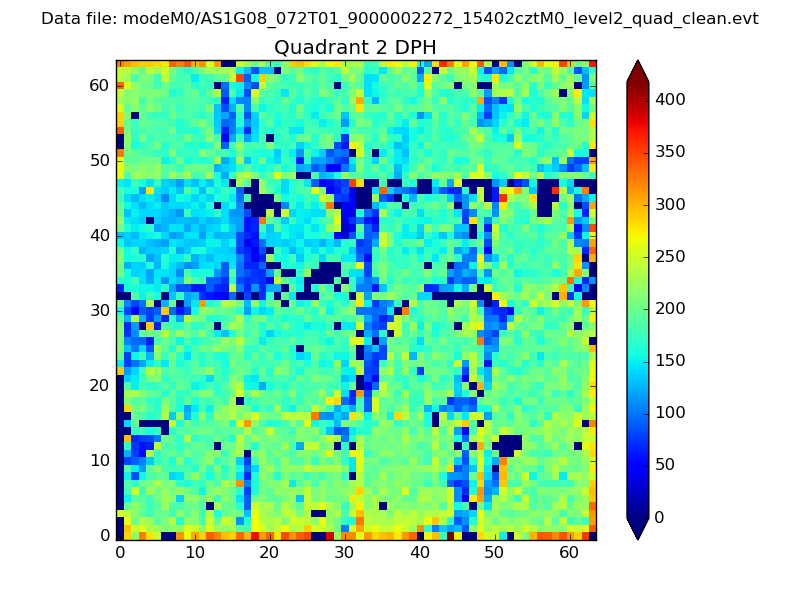 |
Quadrant C |
| Plot type | Count rate plots | Images |
|---|---|---|
| Comparison with Poisson distribution Blue bars denote a histogram of data divided into 1 sec bins. Red curve is a Poisson curve with rate = median count rate of data. |
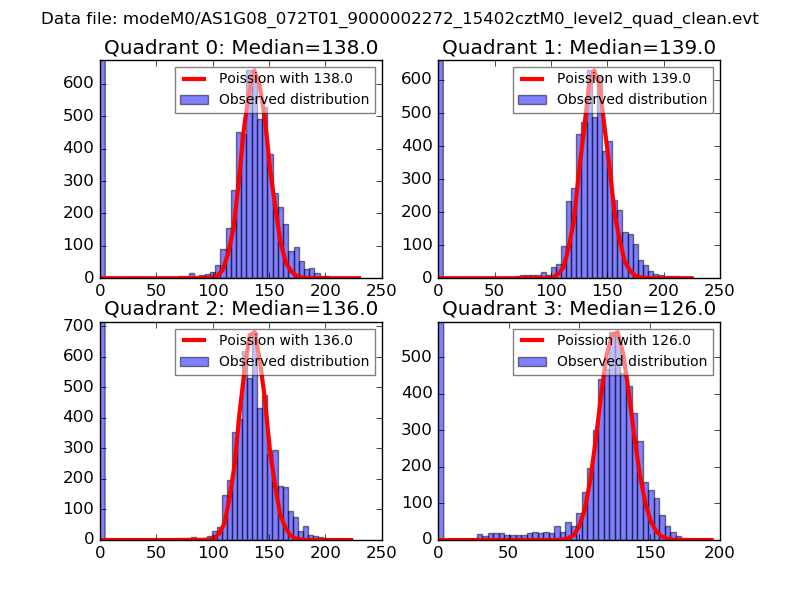 |
 |
| Quadrant-wise count rates Data is divided into 100 sec bins |
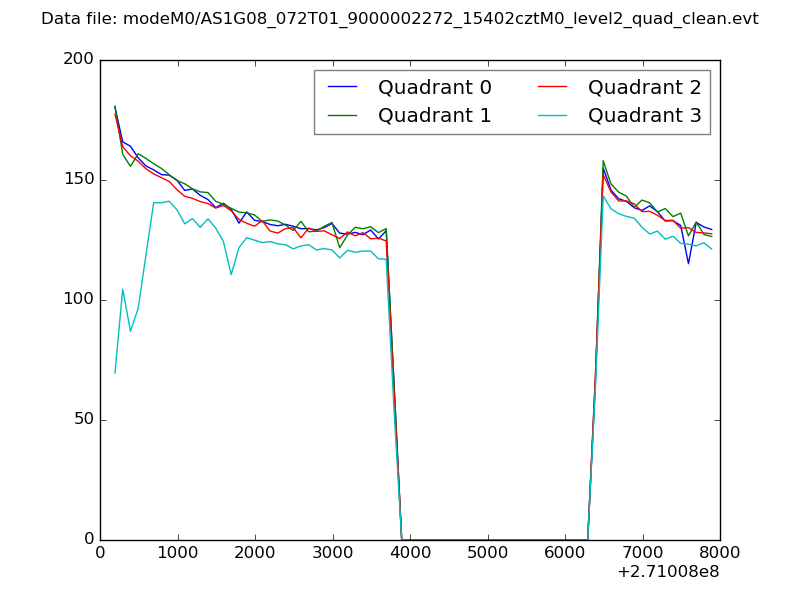 |
|
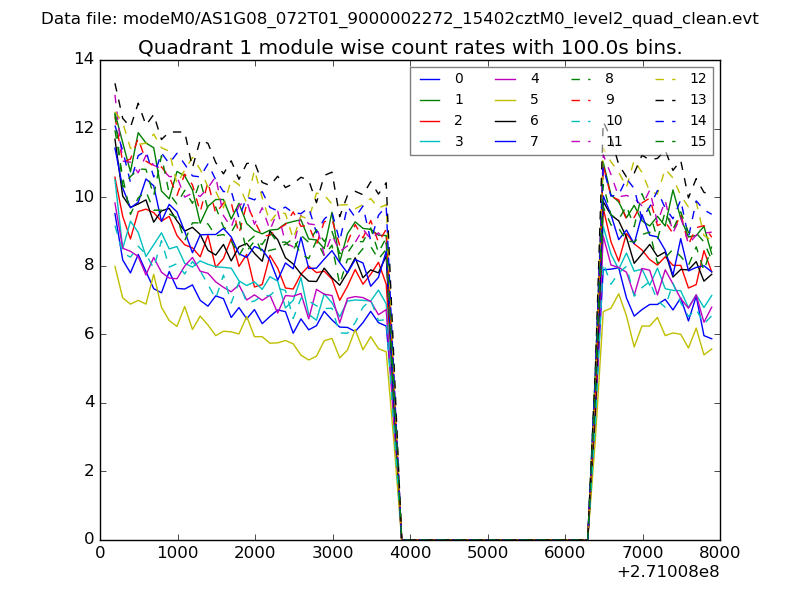
| Module-wise count rates for Quadrant A Data is divided into 100 sec bins |
 |
 |
| Module-wise count rates for Quadrant B Data is divided into 100 sec bins |
 |
 |
| Module-wise count rates for Quadrant C Data is divided into 100 sec bins |
 |
 |
| Module-wise count rates for Quadrant D Data is divided into 100 sec bins |
 |
 |
| Parameter | Plot |
|---|---|
| CZT HV Monitor |  |
| D_VDD | 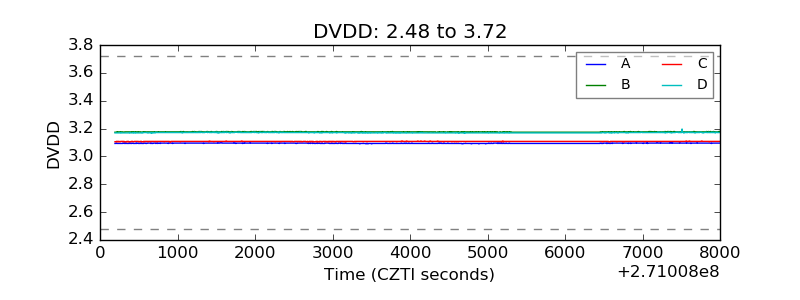 |
| Temperature 1 | 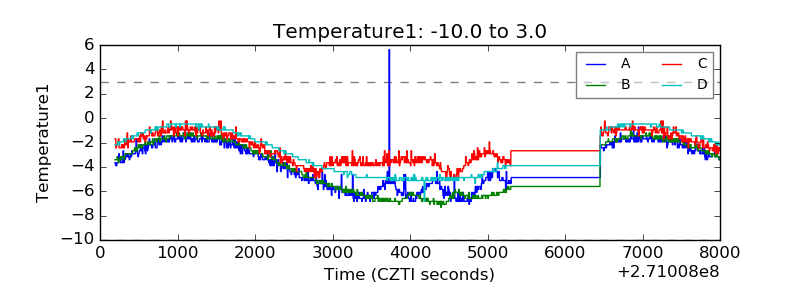 |
| Veto HV Monitor |  |
| Veto LLD |  |
| Alpha Counter |  |
| _CPM_Rate | 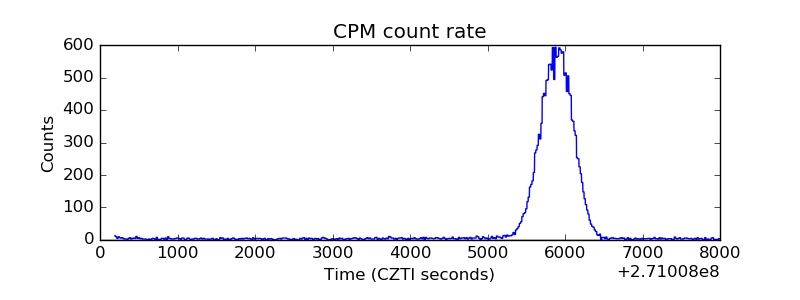 |
| CZT Counter | 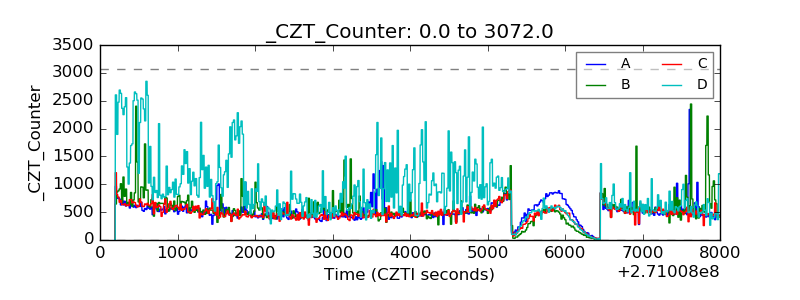 |
| +2.5 Volts monitor | 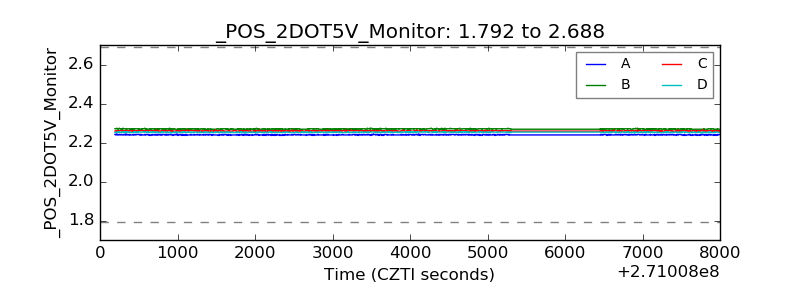 |
| +5 Volts monitor |  |
| _ROLL_ROT | 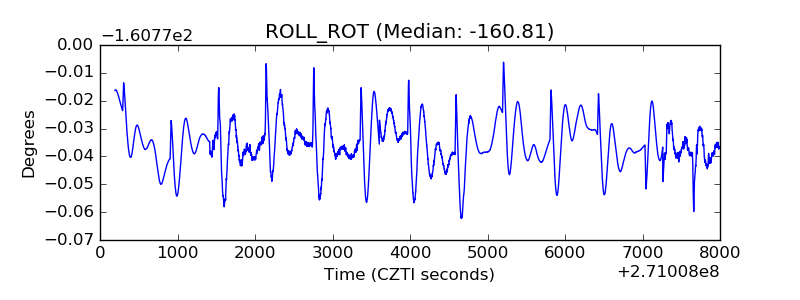 |
| _Roll_DEC |  |
| _Roll_RA | 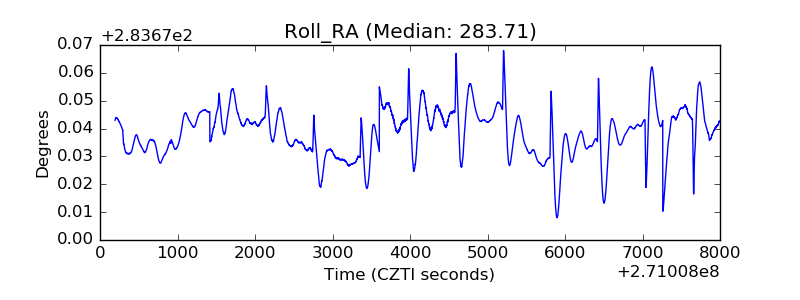 |
| Veto Counter | 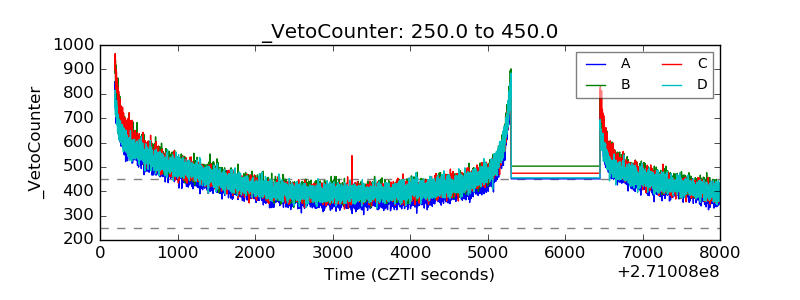 |