| Param | Original file | Final file |
|---|---|---|
| Filename | modeM0/AS1G08_072T01_9000002272_15403cztM0_level2.evt | modeM0/AS1G08_072T01_9000002272_15403cztM0_level2_quad_clean.evt |
| Size (bytes) | 508,449,600 | 95,495,040 |
| Size | 484.9 MB | 91.1 MB |
| Events in quadrant A | 3,370,285 | 613,081 |
| Events in quadrant B | 3,671,530 | 620,610 |
| Events in quadrant C | 3,510,101 | 610,382 |
| Events in quadrant D | 4,381,733 | 570,531 |
| Mode SS | |||
|---|---|---|---|
| Quadrant | BADHDUFLAG | Total packets | Discarded packets |
| A | 0 | 138 | 0 |
| B | 0 | 138 | 0 |
| C | 0 | 138 | 0 |
| D | 0 | 138 | 0 |
| Mode M9 | |||
|---|---|---|---|
| Quadrant | BADHDUFLAG | Total packets | Discarded packets |
| A | 0 | 9 | 0 |
| B | 0 | 9 | 0 |
| C | 0 | 9 | 0 |
| D | 0 | 9 | 0 |
| Mode M0 | |||
|---|---|---|---|
| Quadrant | BADHDUFLAG | Total packets | Discarded packets |
| A | 0 | 14575 | 2 |
| B | 0 | 15254 | 1 |
| C | 0 | 14809 | 1 |
| D | 0 | 17571 | 1 |
| Quadrant | Total seconds | Saturated seconds | Saturation percentage |
|---|---|---|---|
| A | 6854 | 61 | 0.889991% |
| B | 6854 | 74 | 1.079662% |
| C | 6854 | 19 | 0.277210% |
| D | 6854 | 242 | 3.530785% |
Noise dominated data is calculated using 1-second bins in cleaned event files. If a bin has >2000 counts, and if more than 50% of those come from <1% of pixels, then it is considered to be noise-dominated and hence unusable.
| Quadrant | # 1 sec bins | Bins with >0 counts | Bins with >2000 counts | High rate bins dominated by noise | Noise dominated (total time) | Noise dominated (detector-on time) | Marked lightcurve |
|---|---|---|---|---|---|---|---|
| A | 7740 | 6856 | 27 | 27 | 0.35% | 0.39% | 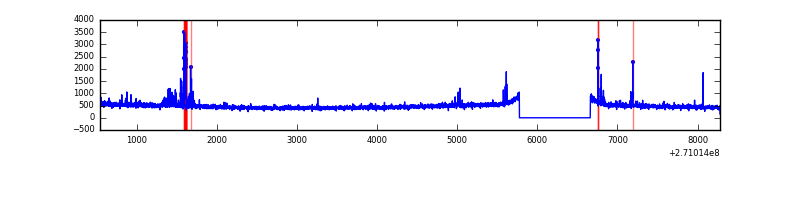 |
| B | 7740 | 6856 | 22 | 22 | 0.28% | 0.32% | 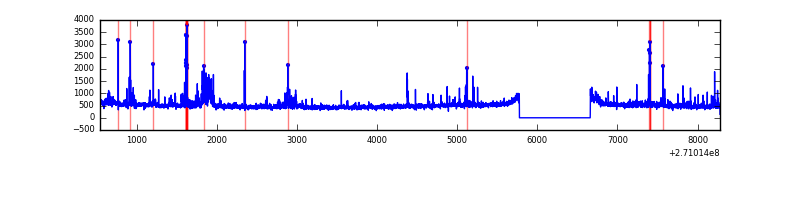 |
| C | 7740 | 6856 | 0 | 0 | 0.00% | 0.00% | 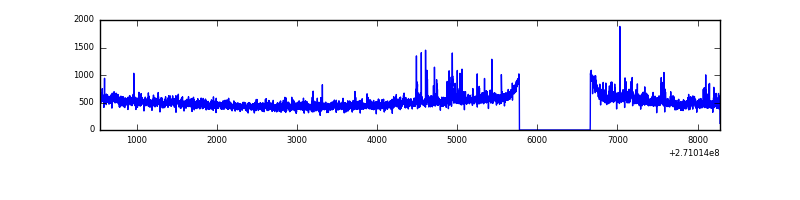 |
| D | 7740 | 6856 | 176 | 176 | 2.27% | 2.57% | 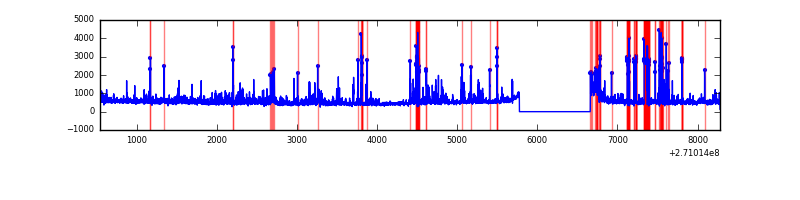 |
Top three noisy pixels from each quadrant. If the there are fewer than three noisy pixels in the level2.evt file, extra rows are filled as -1
| Pixel properties | Quadrant properties | ||||||
|---|---|---|---|---|---|---|---|
| Quadrant | DetID | PixID | Counts | Sigma | Mean | Median | Sigma |
| A | 7 | 16 | 112201 | 658.06 | 830 | 815 | 169.3 |
| A | 9 | 143 | 30677 | 176.42 | 830 | 815 | 169.3 |
| A | 14 | 238 | 17701 | 99.76 | 830 | 815 | 169.3 |
| B | 10 | 16 | 178787 | 1118.94 | 829 | 809 | 159.1 |
| B | 0 | 190 | 84736 | 527.64 | 829 | 809 | 159.1 |
| B | 15 | 35 | 32861 | 201.51 | 829 | 809 | 159.1 |
| C | 7 | 247 | 211418 | 1144.08 | 796 | 801 | 184.1 |
| C | 3 | 233 | 186938 | 1011.1 | 796 | 801 | 184.1 |
| C | 13 | 61 | 5669 | 26.44 | 796 | 801 | 184.1 |
| D | 1 | 52 | 620196 | 3189.46 | 789 | 764 | 194.2 |
| D | 9 | 68 | 287969 | 1478.82 | 789 | 764 | 194.2 |
| D | 5 | 222 | 187341 | 960.69 | 789 | 764 | 194.2 |
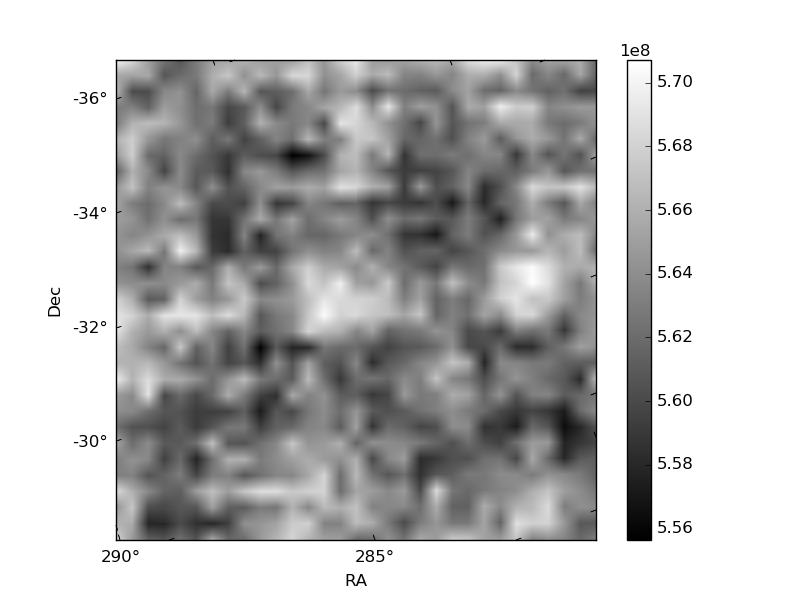
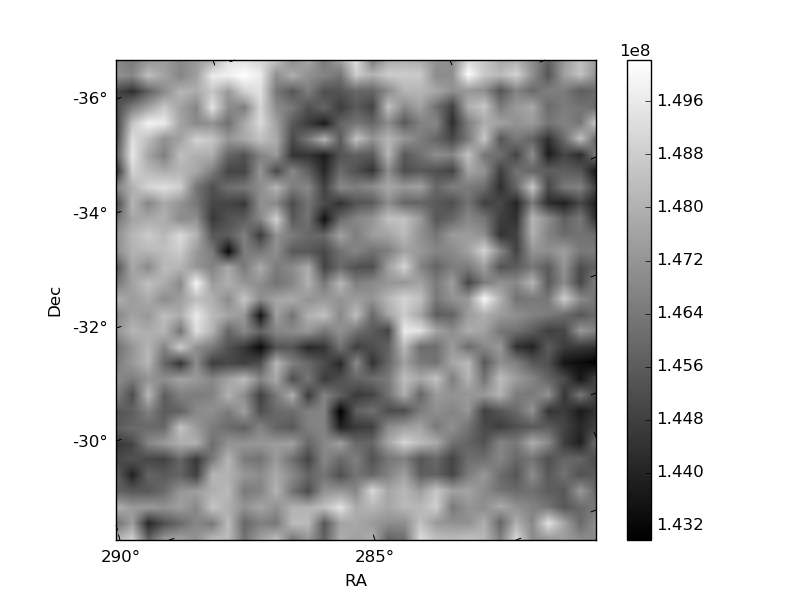
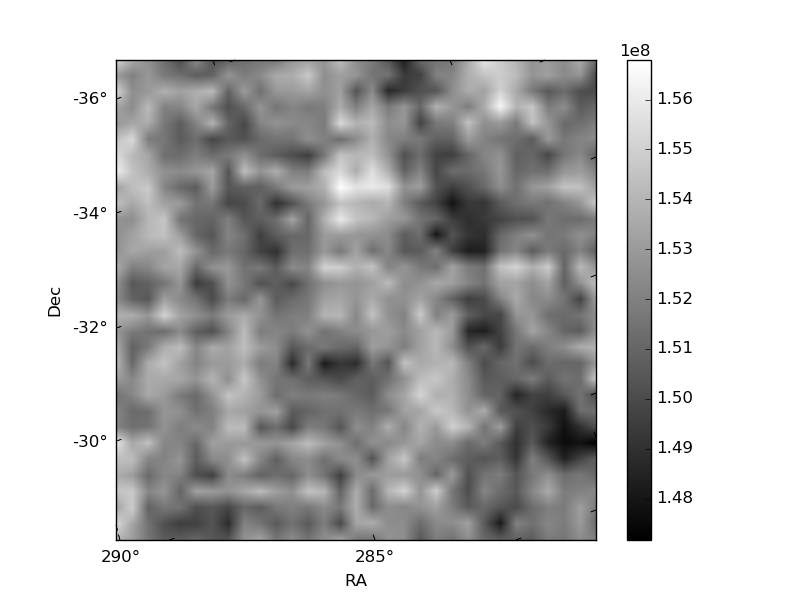
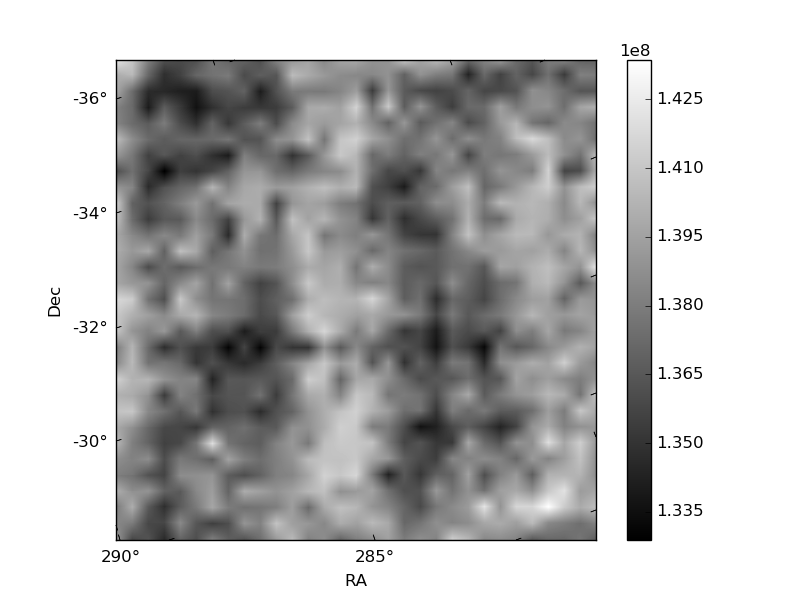
Histogram calculated using DETX and DETY for each event in the final _common_clean file
| Quadrant A | 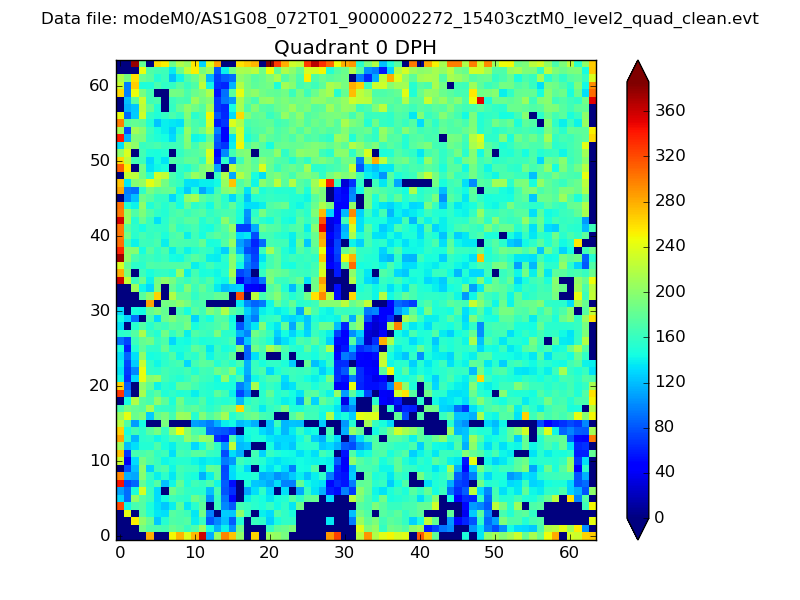 |
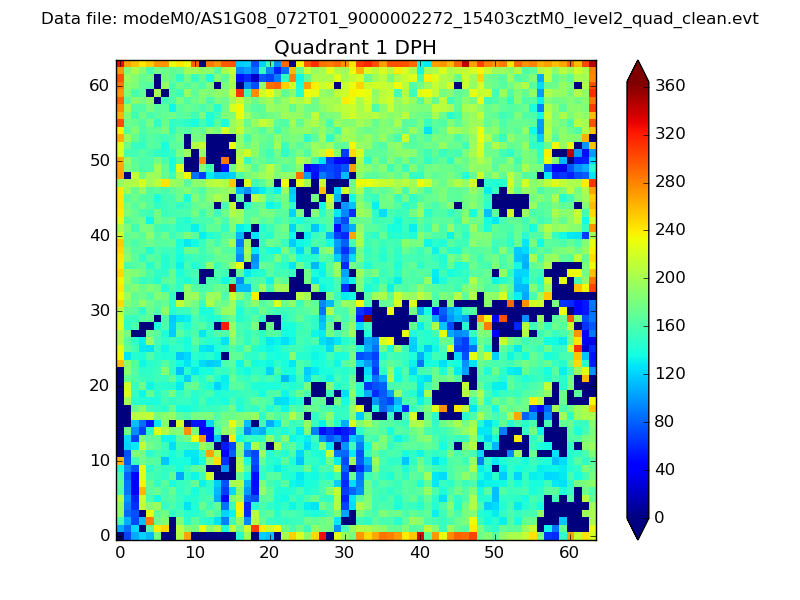 |
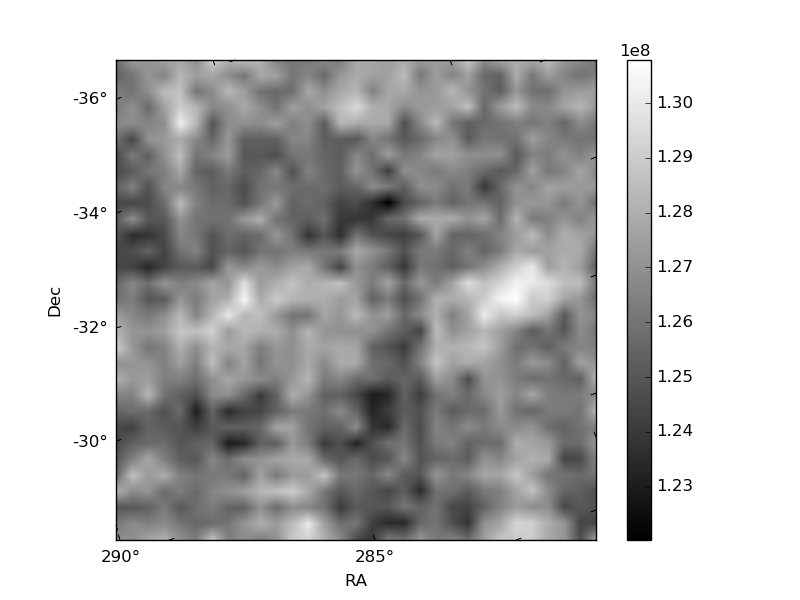
Quadrant B |
|---|---|---|---|
| Quadrant D | 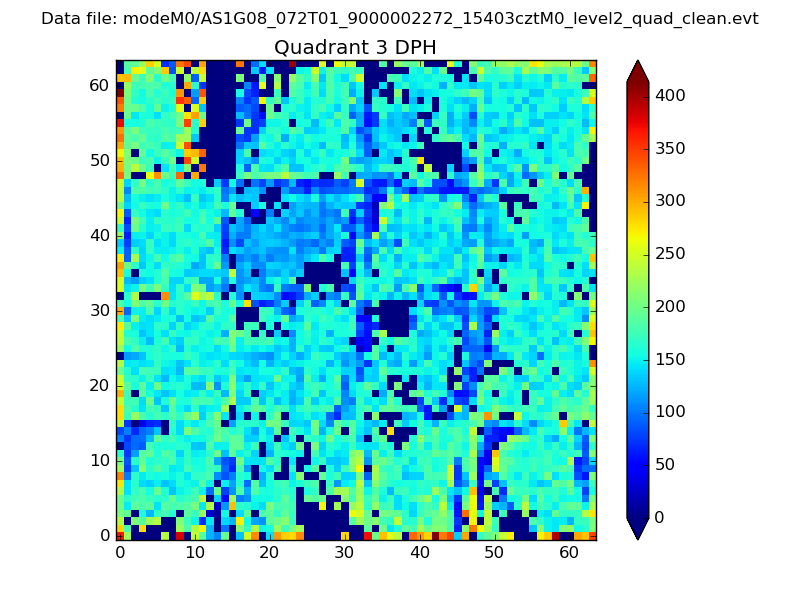 |
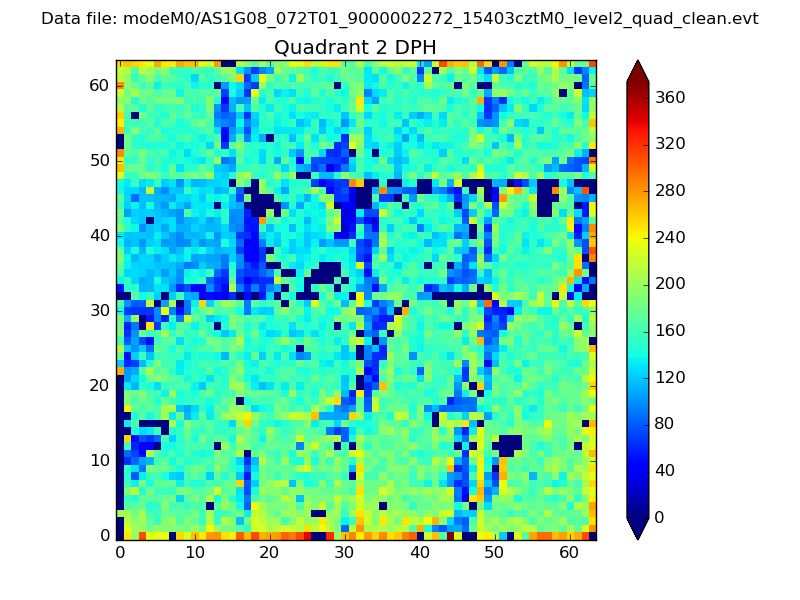 |
Quadrant C |
| Plot type | Count rate plots | Images |
|---|---|---|
| Comparison with Poisson distribution Blue bars denote a histogram of data divided into 1 sec bins. Red curve is a Poisson curve with rate = median count rate of data. |
 |
 |
| Quadrant-wise count rates Data is divided into 100 sec bins |
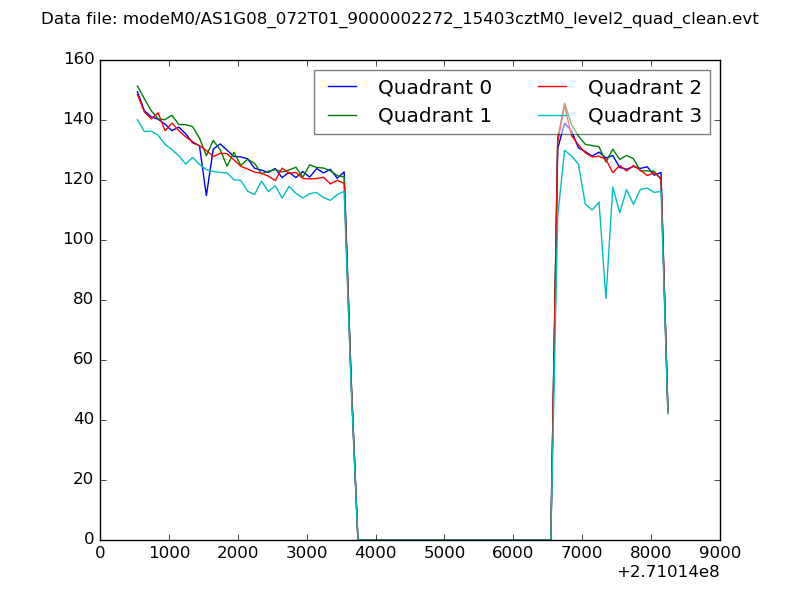 |
|
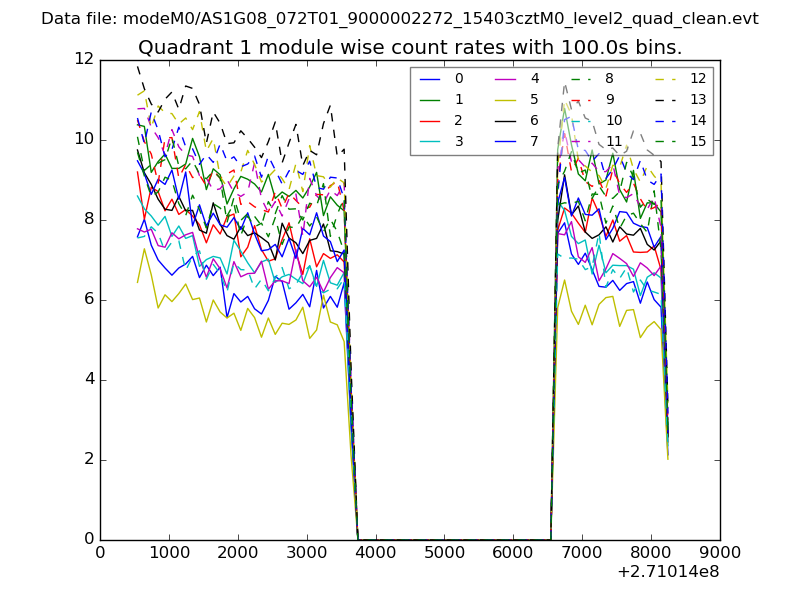
| Module-wise count rates for Quadrant A Data is divided into 100 sec bins |
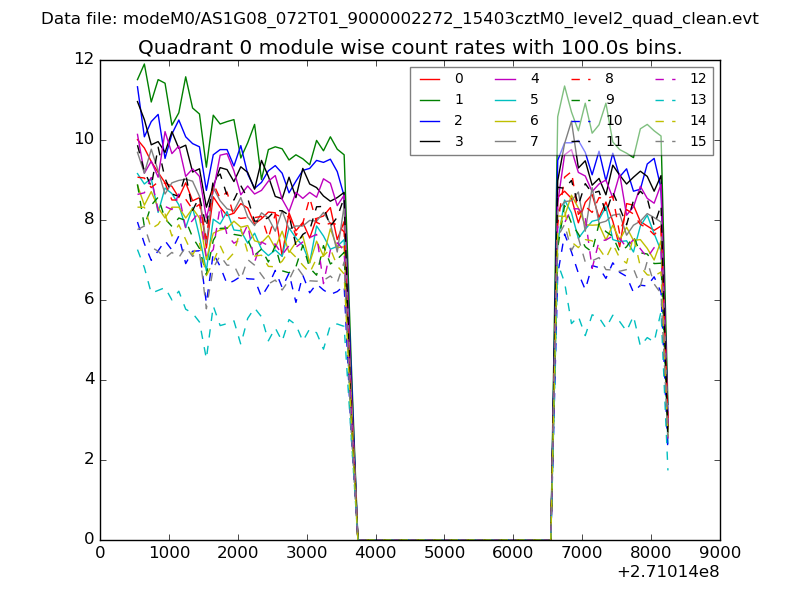 |
 |
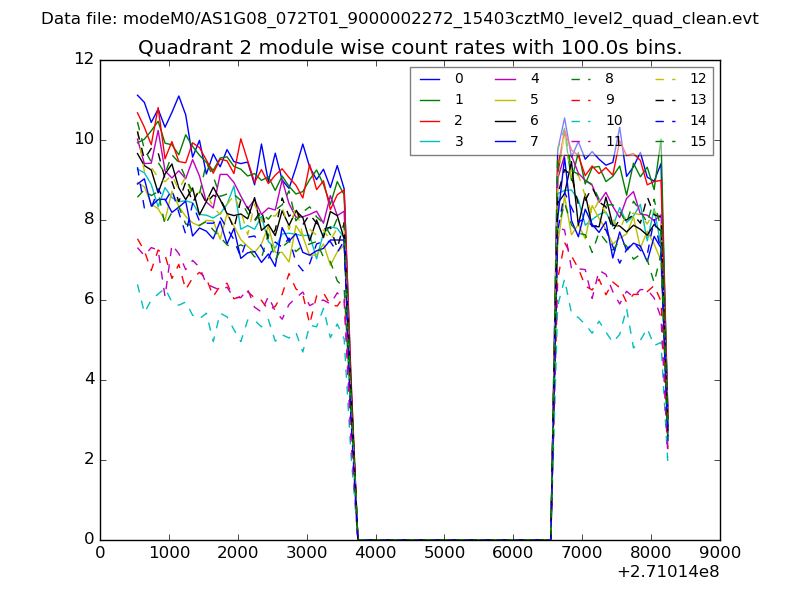
| Module-wise count rates for Quadrant B Data is divided into 100 sec bins |
 |
 |
| Module-wise count rates for Quadrant C Data is divided into 100 sec bins |
 |
 |
| Module-wise count rates for Quadrant D Data is divided into 100 sec bins |
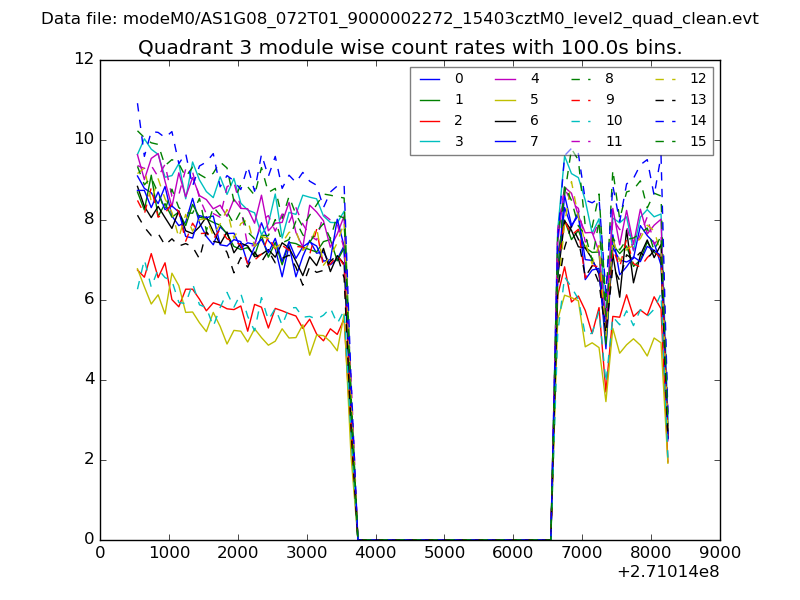 |
 |
| Parameter | Plot |
|---|---|
| CZT HV Monitor | 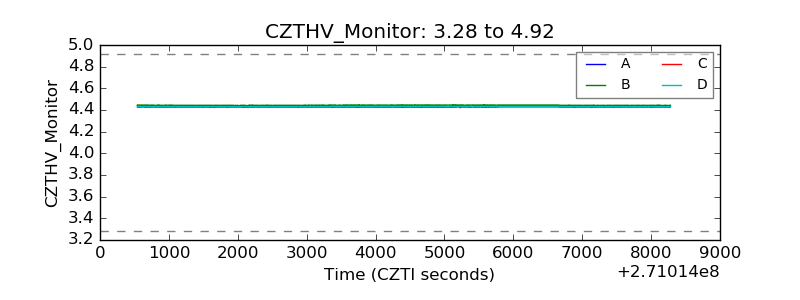 |
| D_VDD | 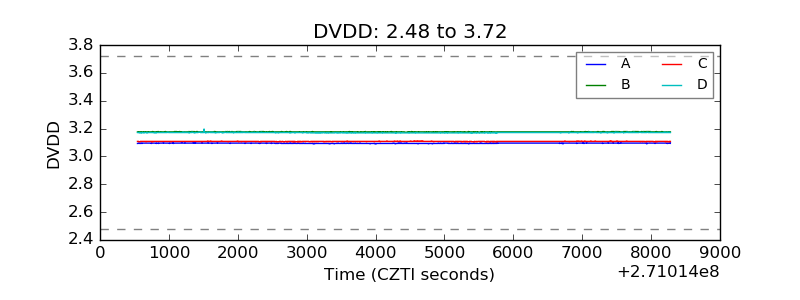 |
| Temperature 1 | 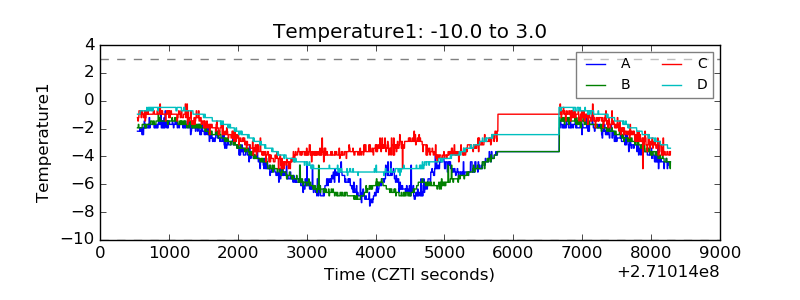 |
| Veto HV Monitor | 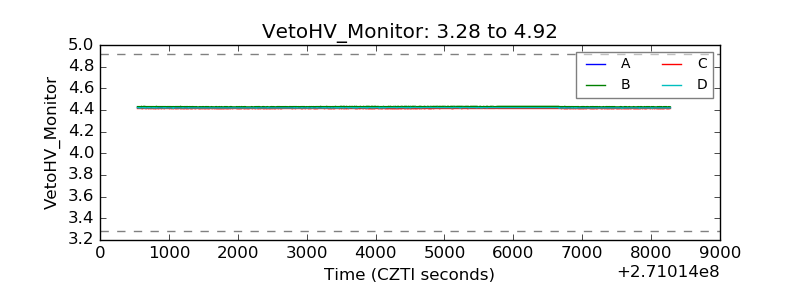 |
| Veto LLD | 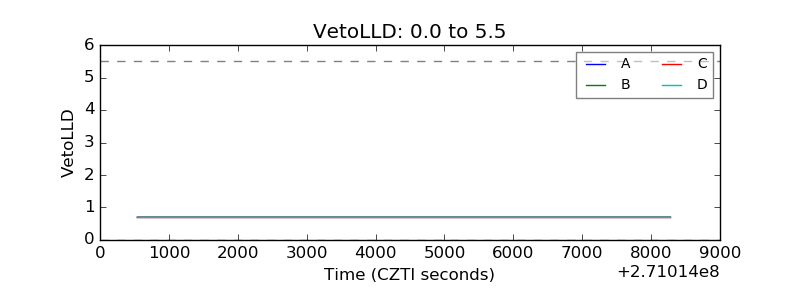 |
| Alpha Counter |  |
| _CPM_Rate |  |
| CZT Counter | 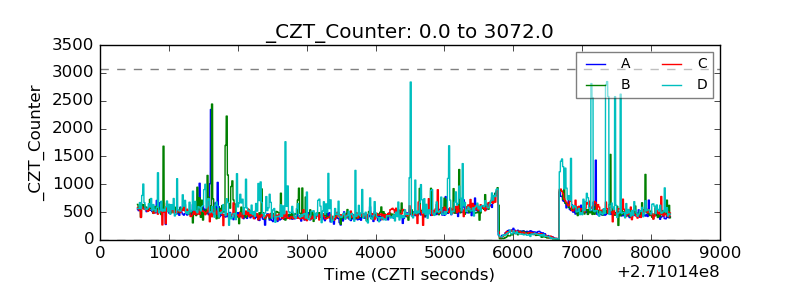 |
| +2.5 Volts monitor |  |
| +5 Volts monitor |  |
| _ROLL_ROT | 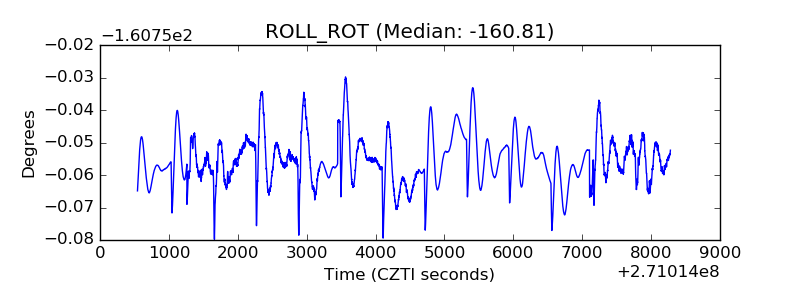 |
| _Roll_DEC | 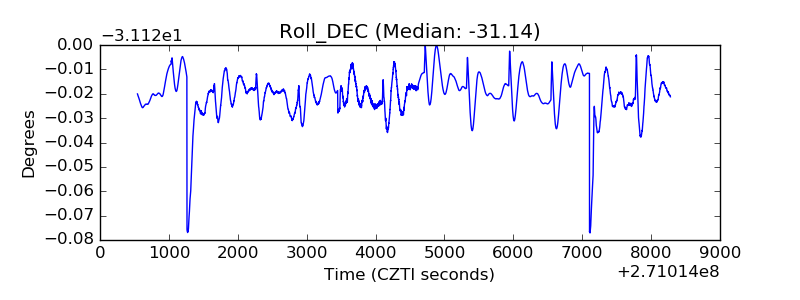 |
| _Roll_RA | 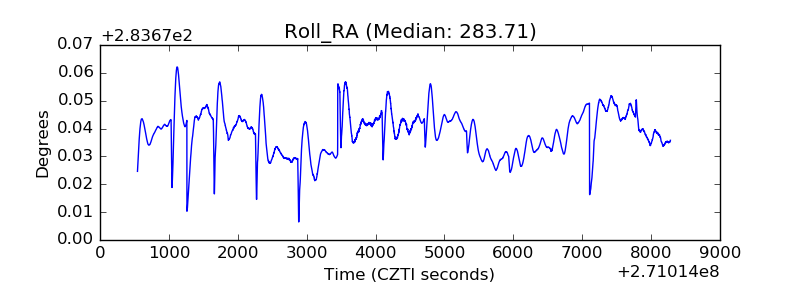 |
| Veto Counter | 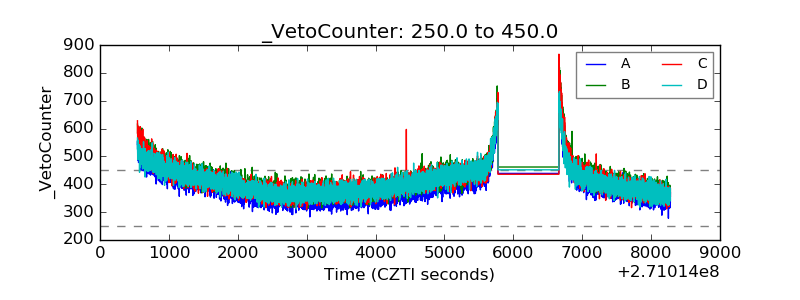 |