| Param | Original file | Final file |
|---|---|---|
| Filename | modeM0/AS1G08_072T01_9000002272_15405cztM0_level2.evt | modeM0/AS1G08_072T01_9000002272_15405cztM0_level2_quad_clean.evt |
| Size (bytes) | 639,898,560 | 112,714,560 |
| Size | 610.3 MB | 107.5 MB |
| Events in quadrant A | 3,761,129 | 729,115 |
| Events in quadrant B | 4,054,582 | 743,295 |
| Events in quadrant C | 4,237,339 | 727,822 |
| Events in quadrant D | 6,788,339 | 661,005 |
| Mode SS | |||
|---|---|---|---|
| Quadrant | BADHDUFLAG | Total packets | Discarded packets |
| A | 0 | 162 | 0 |
| B | 0 | 162 | 0 |
| C | 0 | 162 | 0 |
| D | 0 | 162 | 0 |
| Mode M9 | |||
|---|---|---|---|
| Quadrant | BADHDUFLAG | Total packets | Discarded packets |
| A | 0 | 9 | 0 |
| B | 0 | 9 | 0 |
| C | 0 | 9 | 0 |
| D | 0 | 9 | 0 |
| Mode M0 | |||
|---|---|---|---|
| Quadrant | BADHDUFLAG | Total packets | Discarded packets |
| A | 0 | 16596 | 3 |
| B | 0 | 17208 | 2 |
| C | 0 | 17791 | 2 |
| D | 0 | 25717 | 2 |
| Quadrant | Total seconds | Saturated seconds | Saturation percentage |
|---|---|---|---|
| A | 7944 | 61 | 0.767875% |
| B | 7944 | 99 | 1.246224% |
| C | 7944 | 139 | 1.749748% |
| D | 7944 | 773 | 9.730614% |
Noise dominated data is calculated using 1-second bins in cleaned event files. If a bin has >2000 counts, and if more than 50% of those come from <1% of pixels, then it is considered to be noise-dominated and hence unusable.
| Quadrant | # 1 sec bins | Bins with >0 counts | Bins with >2000 counts | High rate bins dominated by noise | Noise dominated (total time) | Noise dominated (detector-on time) | Marked lightcurve |
|---|---|---|---|---|---|---|---|
| A | 8790 | 7947 | 4 | 4 | 0.05% | 0.05% | 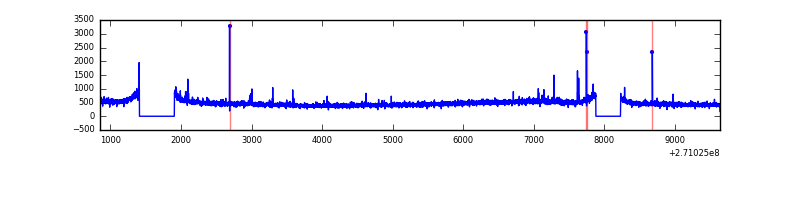 |
| B | 8790 | 7947 | 4 | 4 | 0.05% | 0.05% | 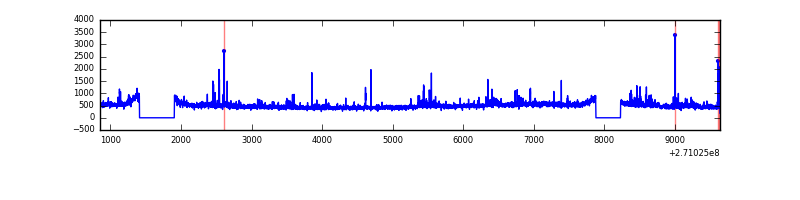 |
| C | 8790 | 7946 | 42 | 42 | 0.48% | 0.53% | 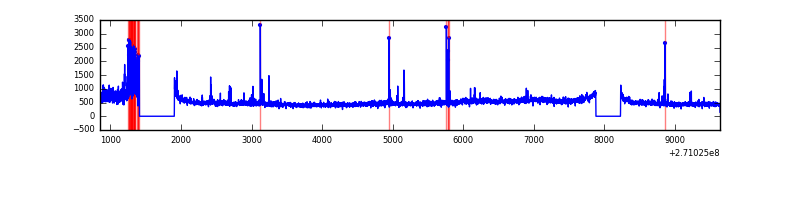 |
| D | 8790 | 7946 | 734 | 734 | 8.35% | 9.24% | 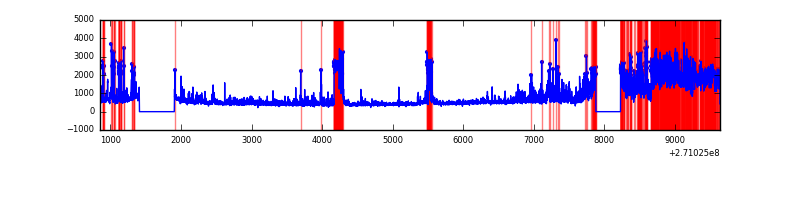 |
Top three noisy pixels from each quadrant. If the there are fewer than three noisy pixels in the level2.evt file, extra rows are filled as -1
| Pixel properties | Quadrant properties | ||||||
|---|---|---|---|---|---|---|---|
| Quadrant | DetID | PixID | Counts | Sigma | Mean | Median | Sigma |
| A | 9 | 143 | 31519 | 156.78 | 959 | 938 | 195.1 |
| A | 14 | 238 | 11221 | 52.72 | 959 | 938 | 195.1 |
| A | 15 | 69 | 10387 | 48.44 | 959 | 938 | 195.1 |
| B | 3 | 209 | 54575 | 291.18 | 962 | 937 | 184.2 |
| B | 0 | 214 | 51849 | 276.38 | 962 | 937 | 184.2 |
| B | 15 | 35 | 35685 | 188.63 | 962 | 937 | 184.2 |
| C | 3 | 233 | 508909 | 2398.36 | 920 | 924 | 211.8 |
| C | 7 | 247 | 74101 | 345.49 | 920 | 924 | 211.8 |
| C | 14 | 234 | 43256 | 199.86 | 920 | 924 | 211.8 |
| D | 13 | 122 | 1822036 | 8268.42 | 898 | 870 | 220.3 |
| D | 5 | 222 | 582844 | 2642.27 | 898 | 870 | 220.3 |
| D | 2 | 33 | 429711 | 1947.02 | 898 | 870 | 220.3 |
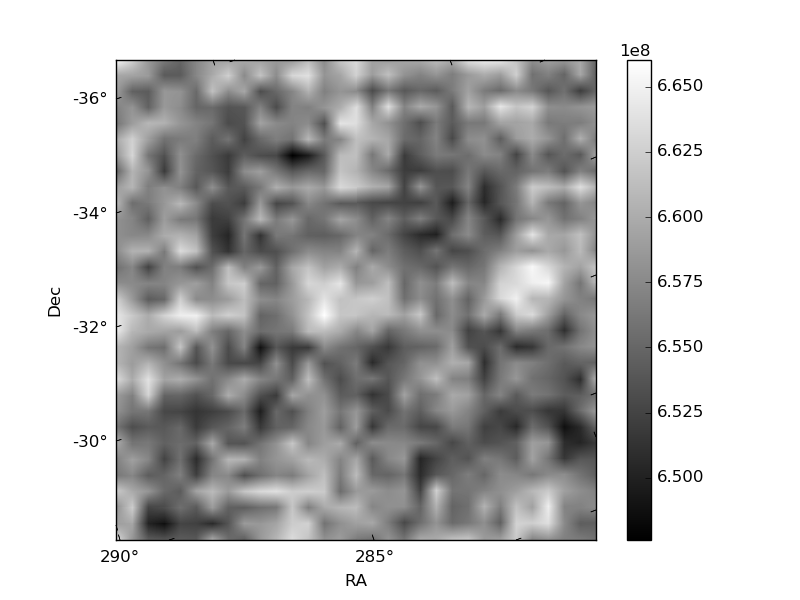
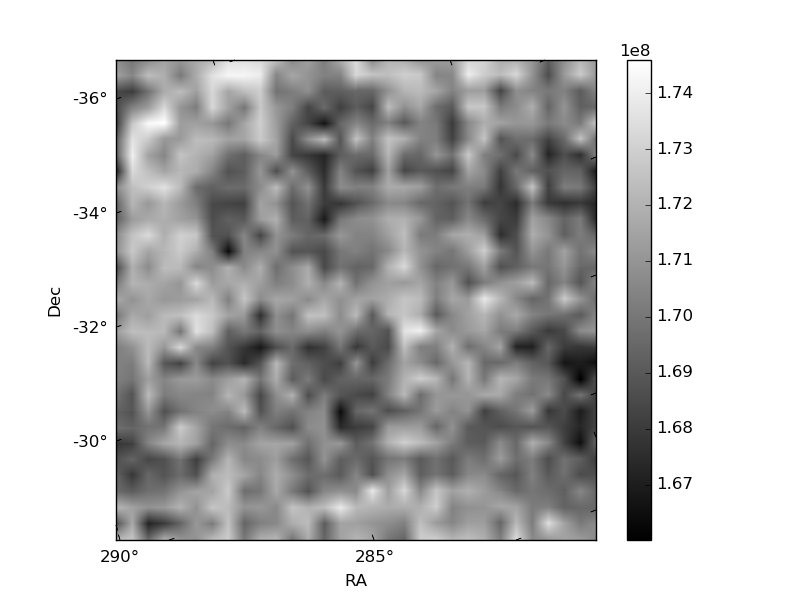
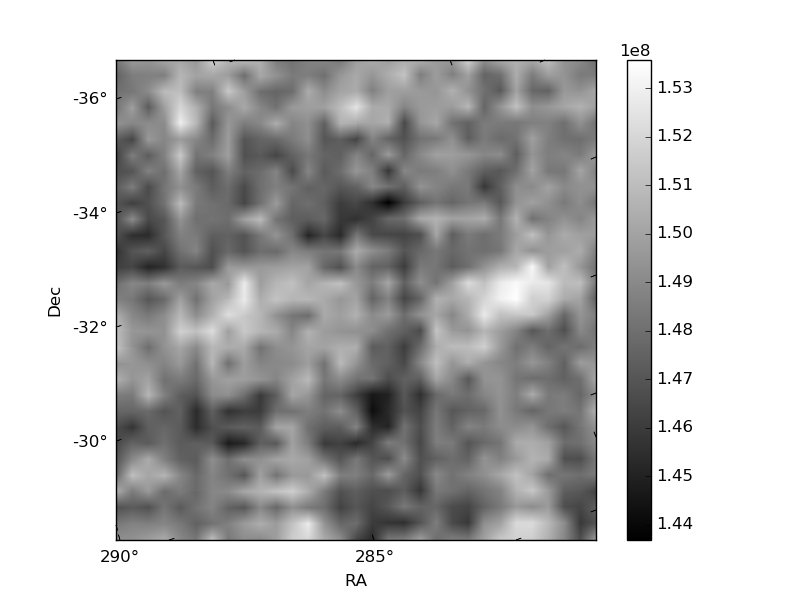
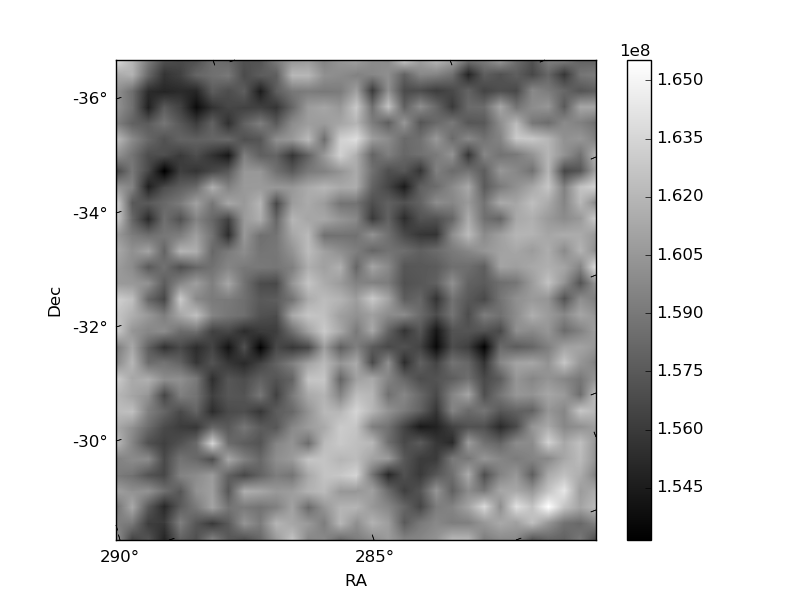
Histogram calculated using DETX and DETY for each event in the final _common_clean file
| Quadrant A | 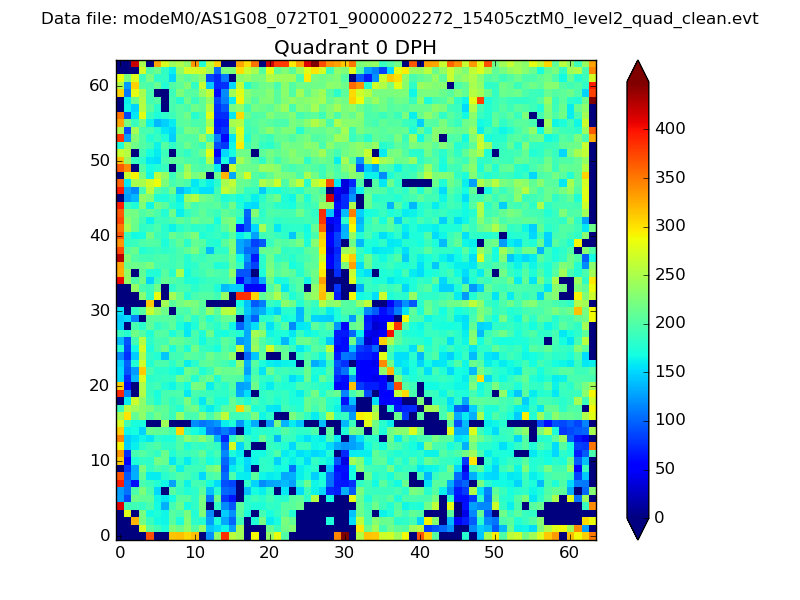 |
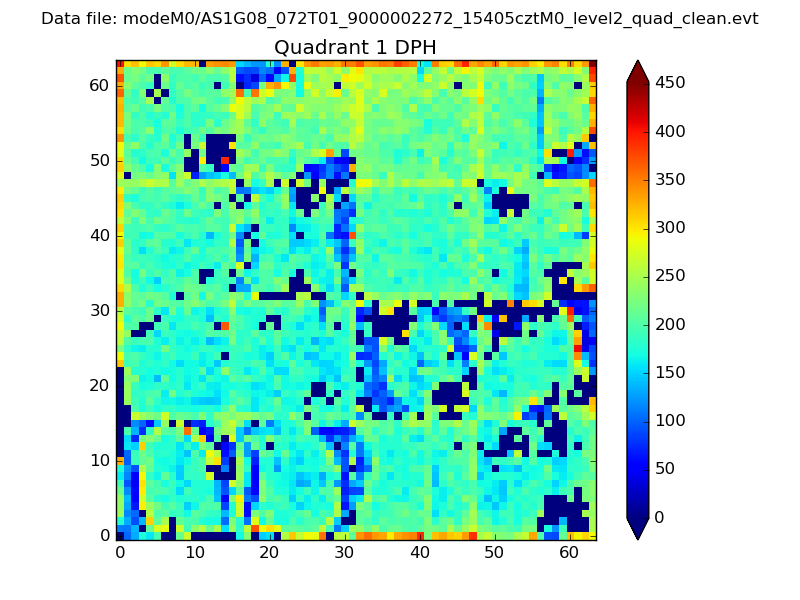 |
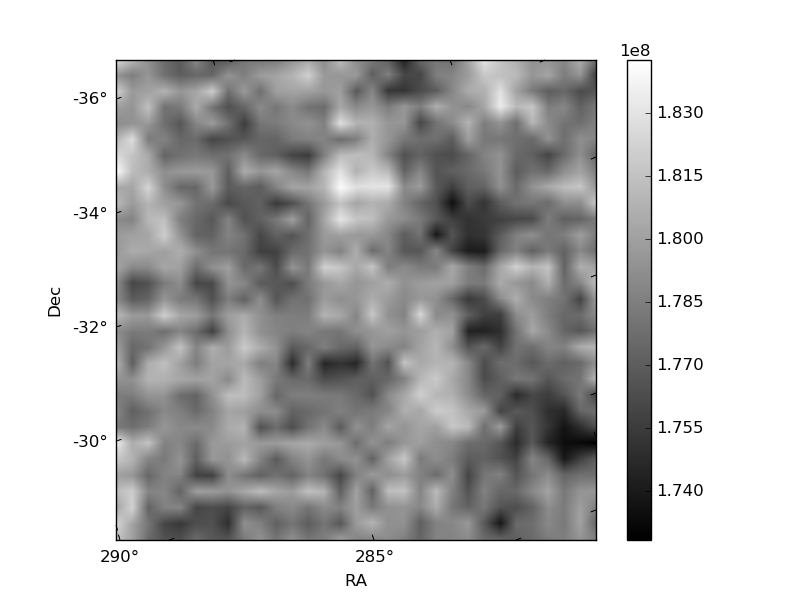
Quadrant B |
|---|---|---|---|
| Quadrant D | 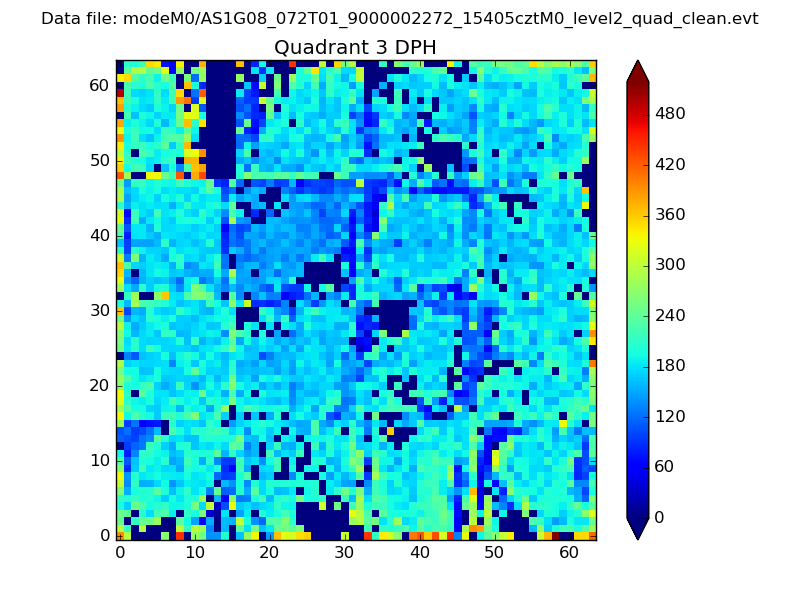 |
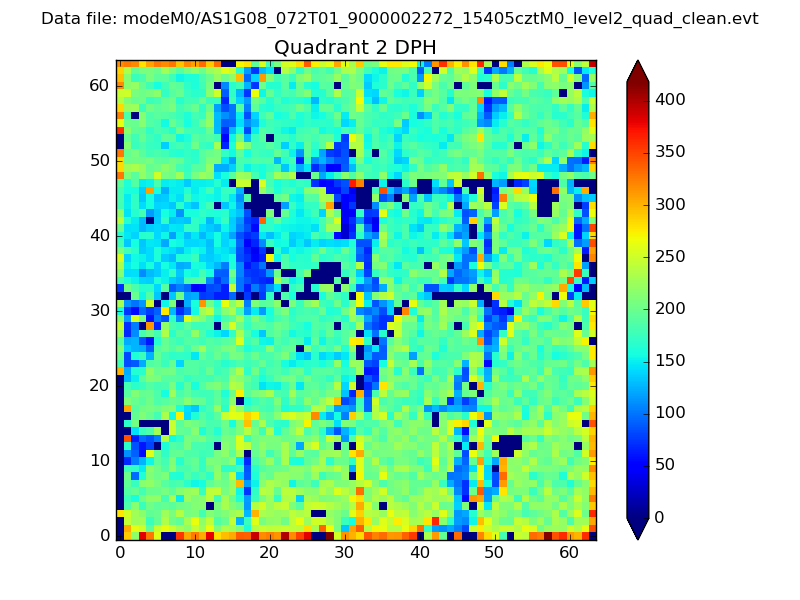 |
Quadrant C |
| Plot type | Count rate plots | Images |
|---|---|---|
| Comparison with Poisson distribution Blue bars denote a histogram of data divided into 1 sec bins. Red curve is a Poisson curve with rate = median count rate of data. |
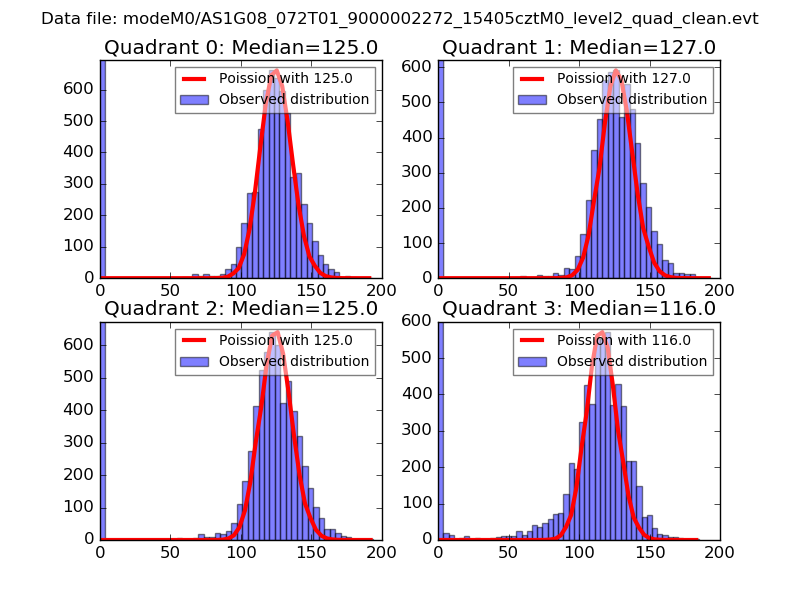 |
 |
| Quadrant-wise count rates Data is divided into 100 sec bins |
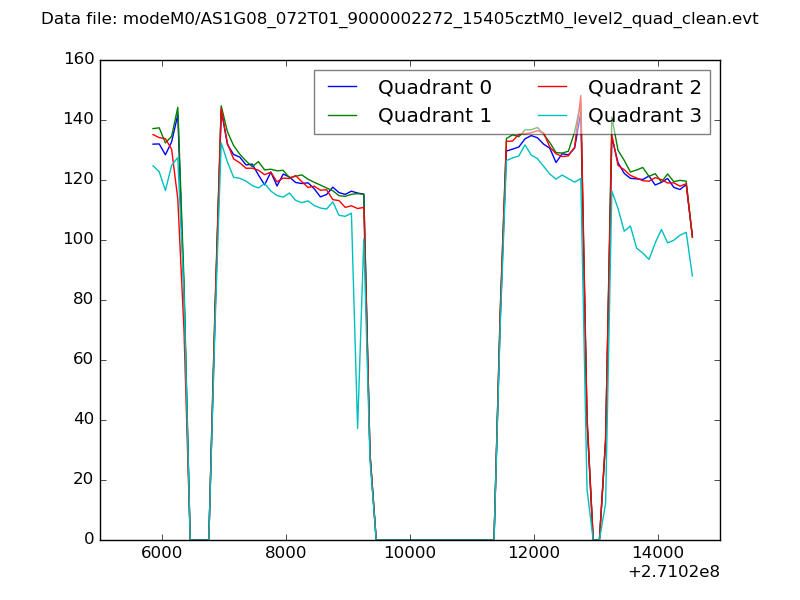 |
|
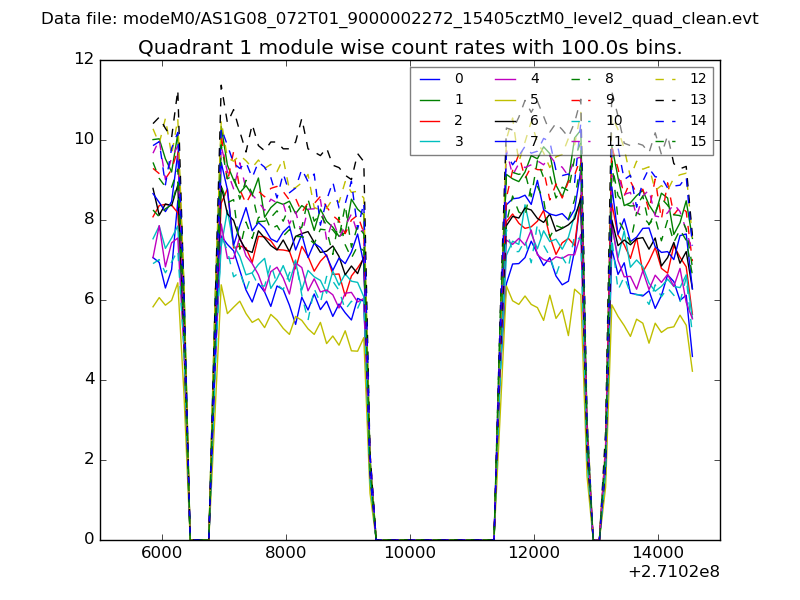
| Module-wise count rates for Quadrant A Data is divided into 100 sec bins |
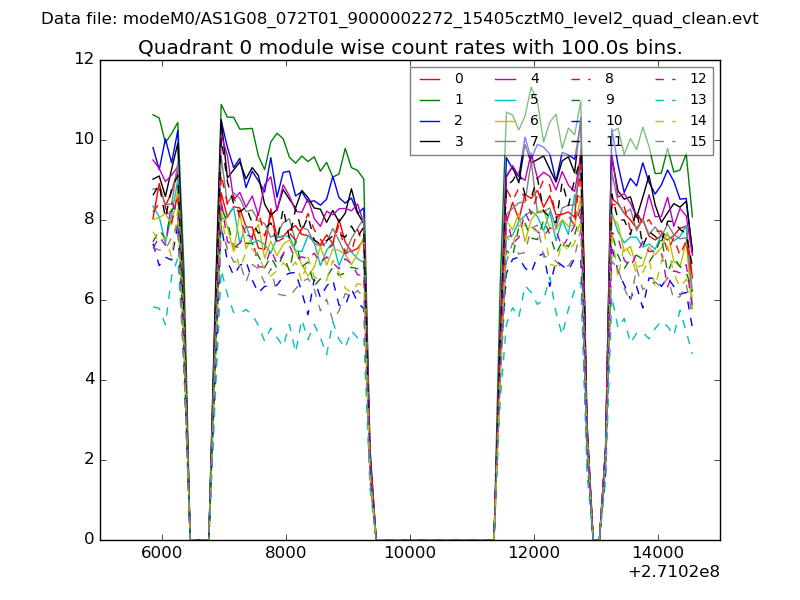 |
 |
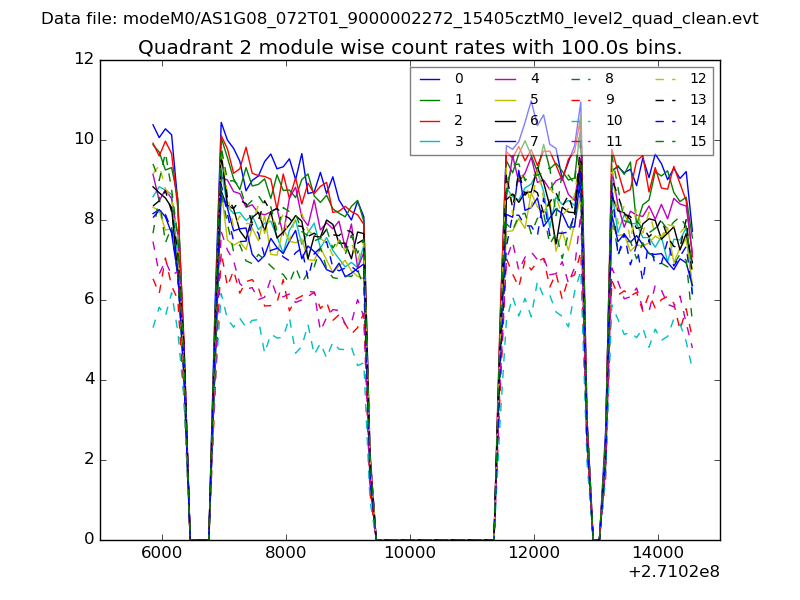
| Module-wise count rates for Quadrant B Data is divided into 100 sec bins |
 |
 |
| Module-wise count rates for Quadrant C Data is divided into 100 sec bins |
 |
 |
| Module-wise count rates for Quadrant D Data is divided into 100 sec bins |
 |
 |
| Parameter | Plot |
|---|---|
| CZT HV Monitor | 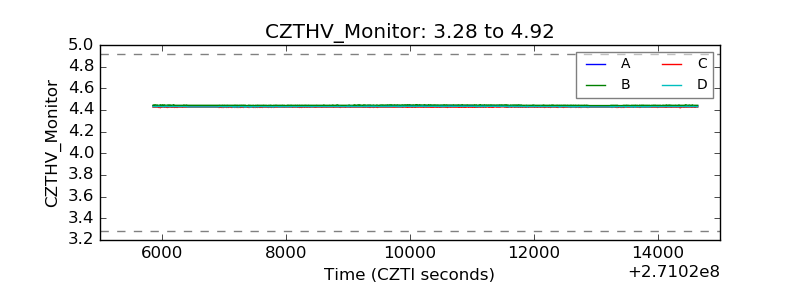 |
| D_VDD | 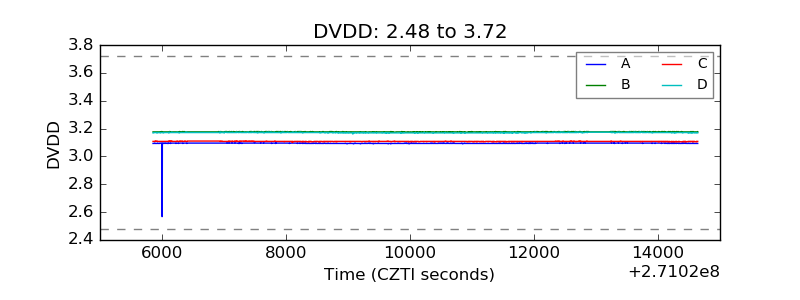 |
| Temperature 1 | 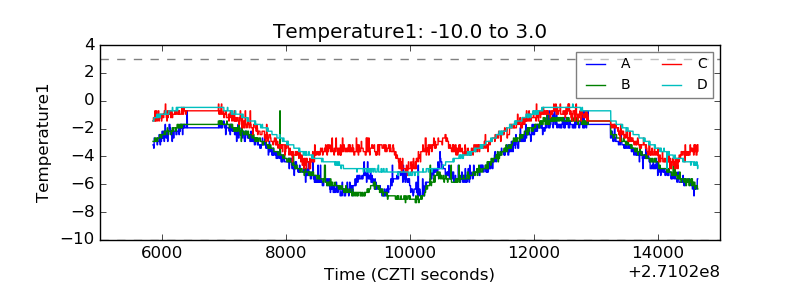 |
| Veto HV Monitor | 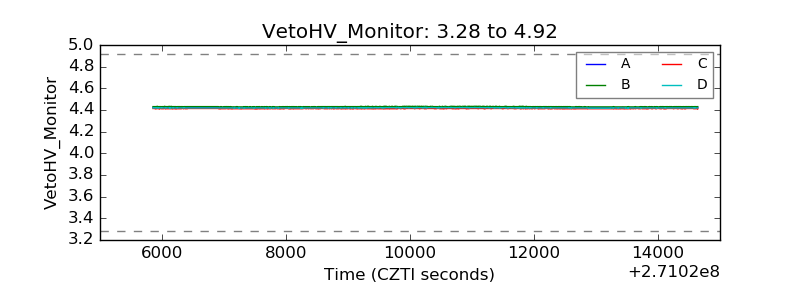 |
| Veto LLD | 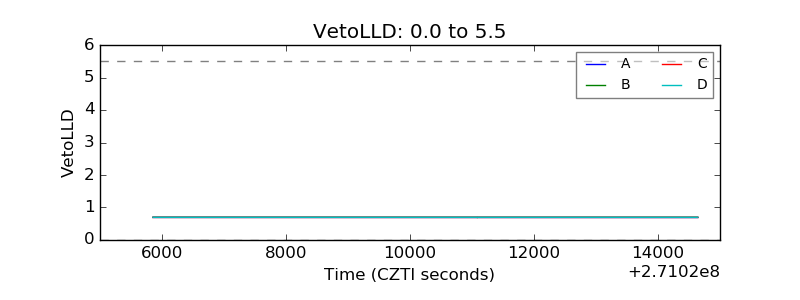 |
| Alpha Counter | 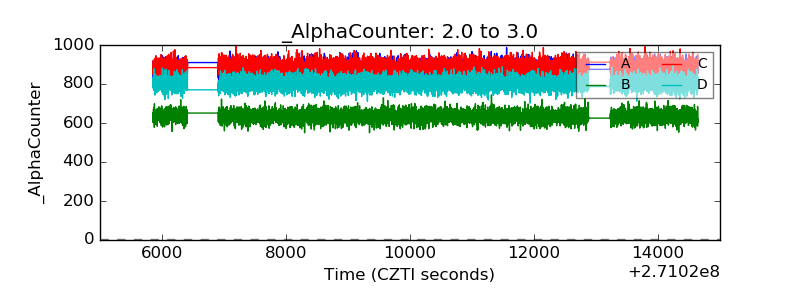 |
| _CPM_Rate | 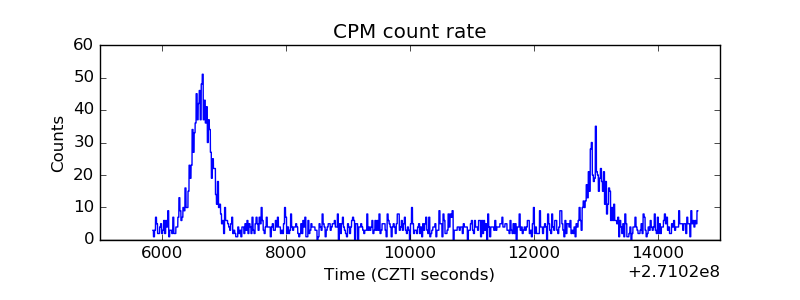 |
| CZT Counter | 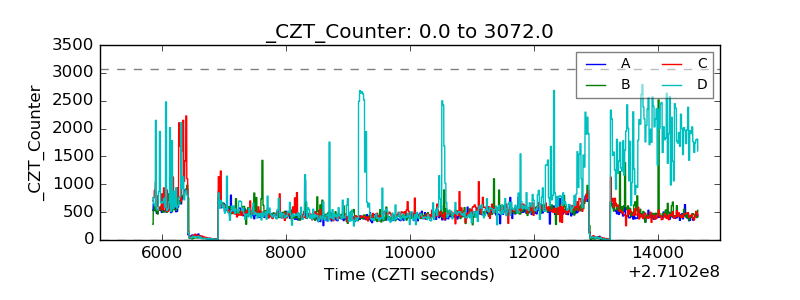 |
| +2.5 Volts monitor |  |
| +5 Volts monitor |  |
| _ROLL_ROT | 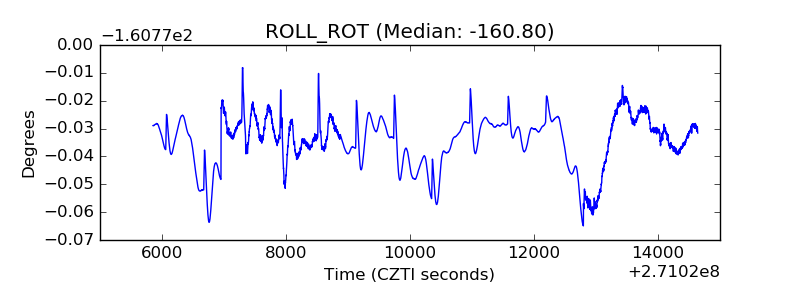 |
| _Roll_DEC | 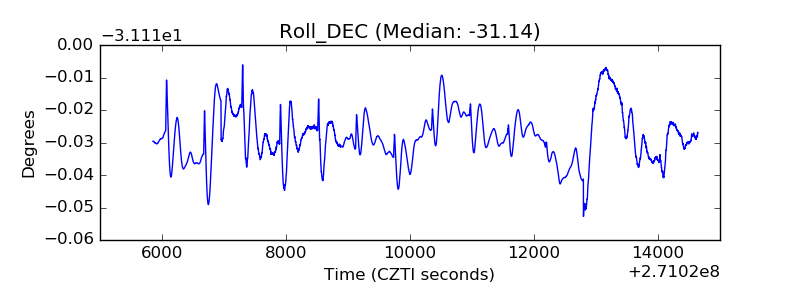 |
| _Roll_RA | 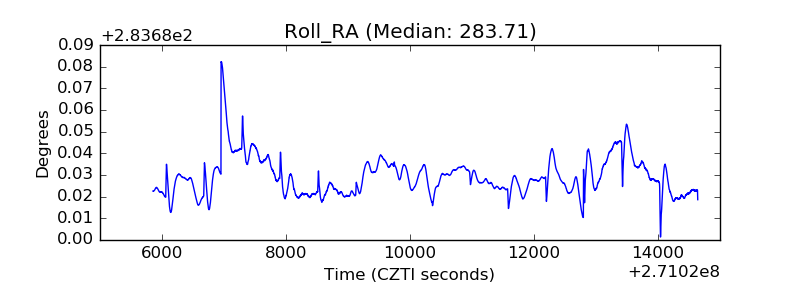 |
| Veto Counter |  |