| Param | Original file | Final file |
|---|---|---|
| Filename | modeM0/AS1G08_072T01_9000002272_15406cztM0_level2.evt | modeM0/AS1G08_072T01_9000002272_15406cztM0_level2_quad_clean.evt |
| Size (bytes) | 813,839,040 | 109,445,760 |
| Size | 776.1 MB | 104.4 MB |
| Events in quadrant A | 3,726,833 | 728,997 |
| Events in quadrant B | 4,024,832 | 740,970 |
| Events in quadrant C | 3,880,689 | 731,772 |
| Events in quadrant D | 12,471,791 | 552,911 |
| Mode SS | |||
|---|---|---|---|
| Quadrant | BADHDUFLAG | Total packets | Discarded packets |
| A | 0 | 164 | 0 |
| B | 0 | 164 | 0 |
| C | 0 | 164 | 0 |
| D | 0 | 164 | 0 |
| Mode M9 | |||
|---|---|---|---|
| Quadrant | BADHDUFLAG | Total packets | Discarded packets |
| A | 0 | 8 | 0 |
| B | 0 | 8 | 0 |
| C | 0 | 8 | 0 |
| D | 0 | 8 | 0 |
| Mode M0 | |||
|---|---|---|---|
| Quadrant | BADHDUFLAG | Total packets | Discarded packets |
| A | 0 | 16614 | 3 |
| B | 0 | 17165 | 2 |
| C | 0 | 16815 | 2 |
| D | 0 | 42704 | 2 |
| Quadrant | Total seconds | Saturated seconds | Saturation percentage |
|---|---|---|---|
| A | 8044 | 40 | 0.497265% |
| B | 8044 | 69 | 0.857782% |
| C | 8044 | 22 | 0.273496% |
| D | 8044 | 2320 | 28.841372% |
Noise dominated data is calculated using 1-second bins in cleaned event files. If a bin has >2000 counts, and if more than 50% of those come from <1% of pixels, then it is considered to be noise-dominated and hence unusable.
| Quadrant | # 1 sec bins | Bins with >0 counts | Bins with >2000 counts | High rate bins dominated by noise | Noise dominated (total time) | Noise dominated (detector-on time) | Marked lightcurve |
|---|---|---|---|---|---|---|---|
| A | 8810 | 8047 | 8 | 8 | 0.09% | 0.10% | 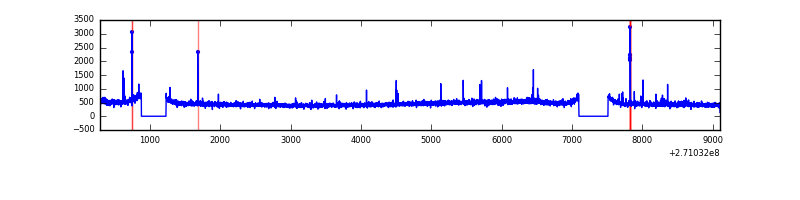 |
| B | 8810 | 8047 | 9 | 9 | 0.10% | 0.11% | 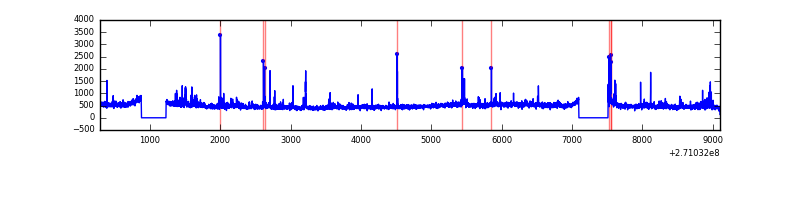 |
| C | 8810 | 8047 | 2 | 2 | 0.02% | 0.02% | 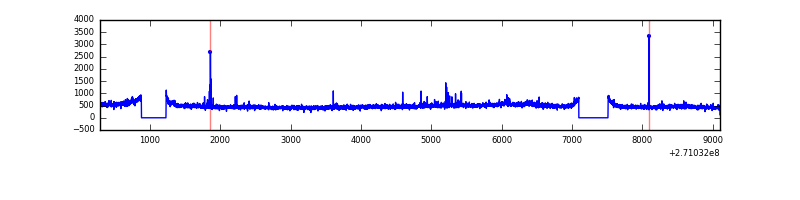 |
| D | 8810 | 8046 | 2195 | 2195 | 24.91% | 27.28% | 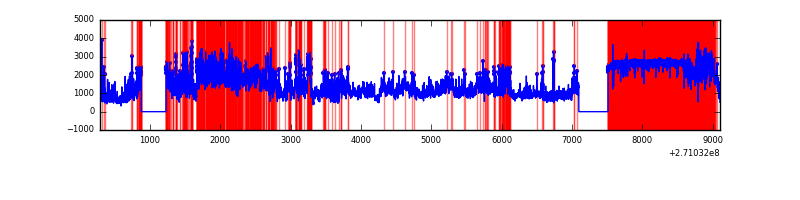 |
Top three noisy pixels from each quadrant. If the there are fewer than three noisy pixels in the level2.evt file, extra rows are filled as -1
| Pixel properties | Quadrant properties | ||||||
|---|---|---|---|---|---|---|---|
| Quadrant | DetID | PixID | Counts | Sigma | Mean | Median | Sigma |
| A | 9 | 143 | 50267 | 256.51 | 948 | 929 | 192.3 |
| A | 13 | 248 | 10383 | 49.15 | 948 | 929 | 192.3 |
| A | 15 | 69 | 10232 | 48.37 | 948 | 929 | 192.3 |
| B | 3 | 209 | 53665 | 287.55 | 953 | 928 | 183.4 |
| B | 4 | 48 | 50392 | 269.7 | 953 | 928 | 183.4 |
| B | 0 | 190 | 36990 | 196.63 | 953 | 928 | 183.4 |
| C | 3 | 233 | 217569 | 1022.45 | 918 | 921 | 211.9 |
| C | 7 | 247 | 44841 | 207.28 | 918 | 921 | 211.9 |
| C | 14 | 234 | 25216 | 114.66 | 918 | 921 | 211.9 |
| D | 13 | 122 | 7227311 | 36813.85 | 799 | 773 | 196.3 |
| D | 9 | 68 | 1424076 | 7250.67 | 799 | 773 | 196.3 |
| D | 5 | 222 | 443145 | 2253.55 | 799 | 773 | 196.3 |
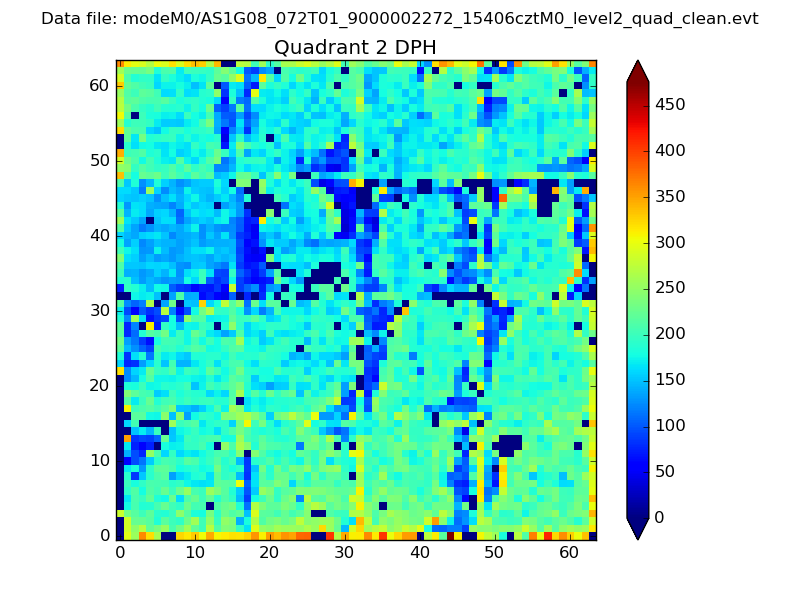
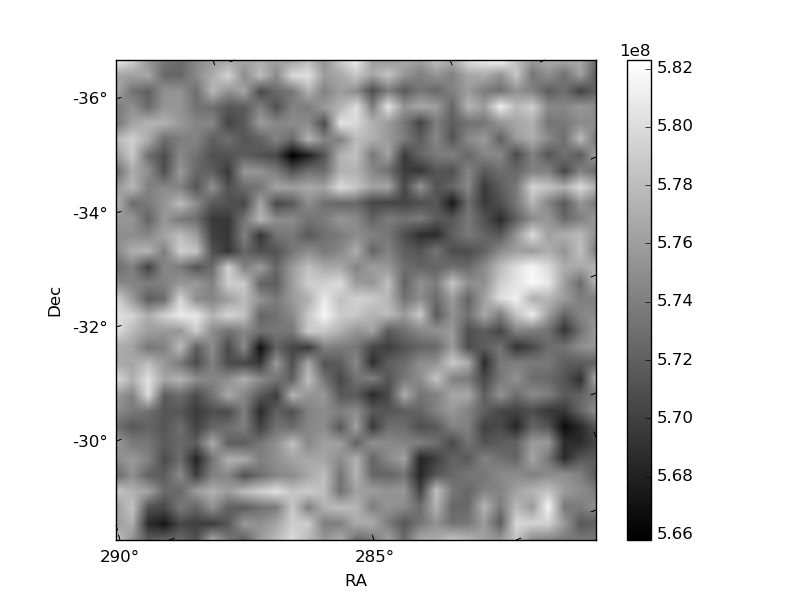
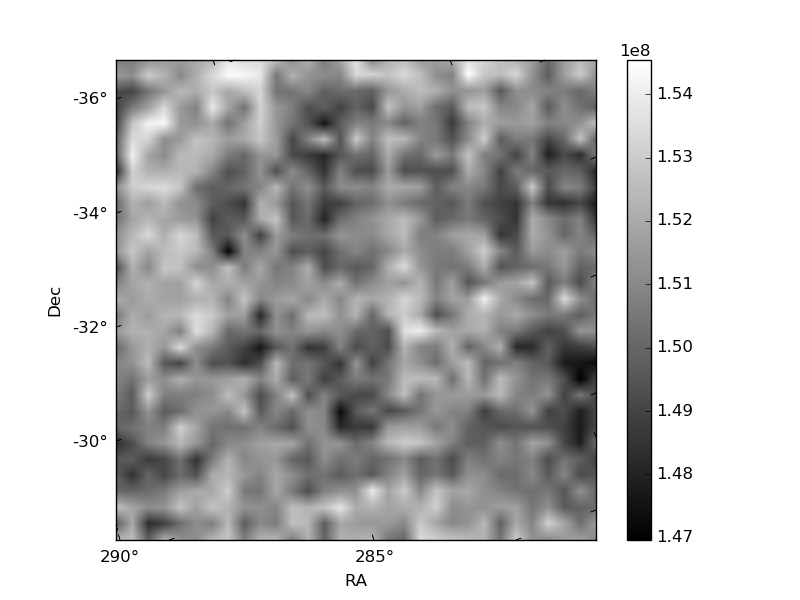
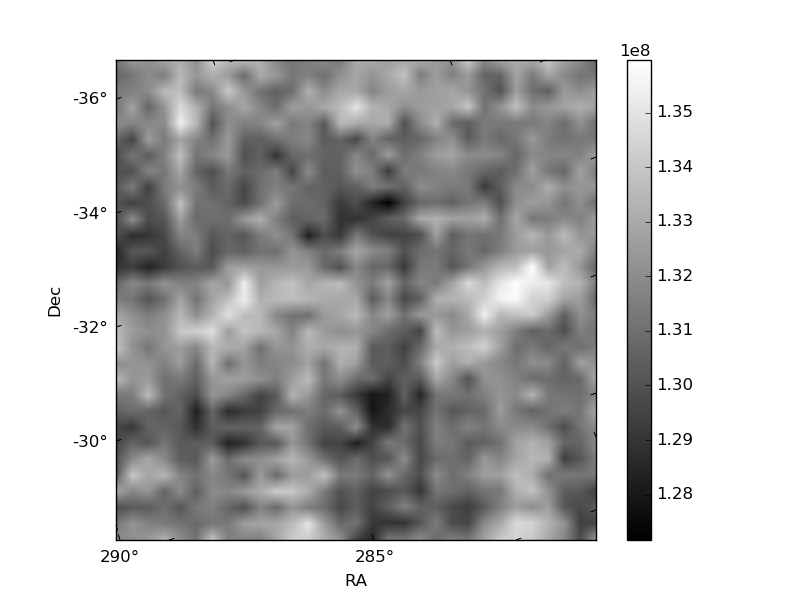
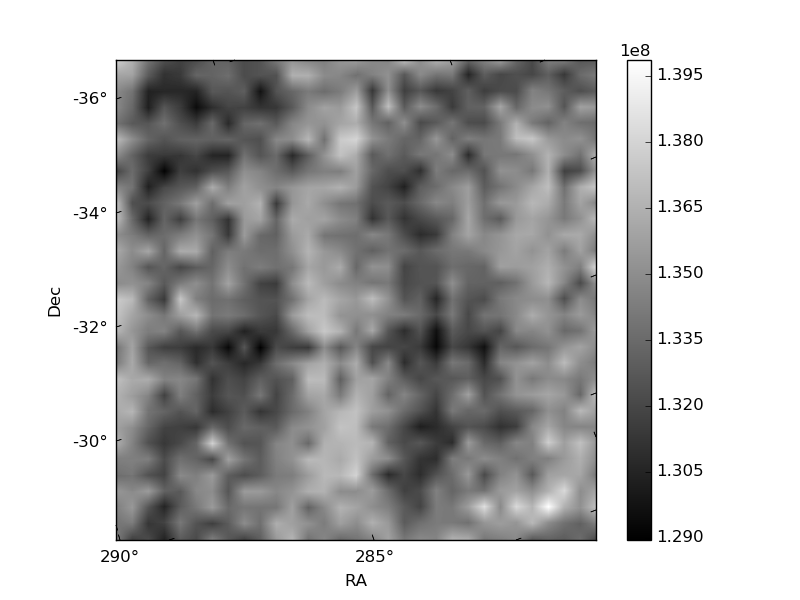
Histogram calculated using DETX and DETY for each event in the final _common_clean file
| Quadrant A | 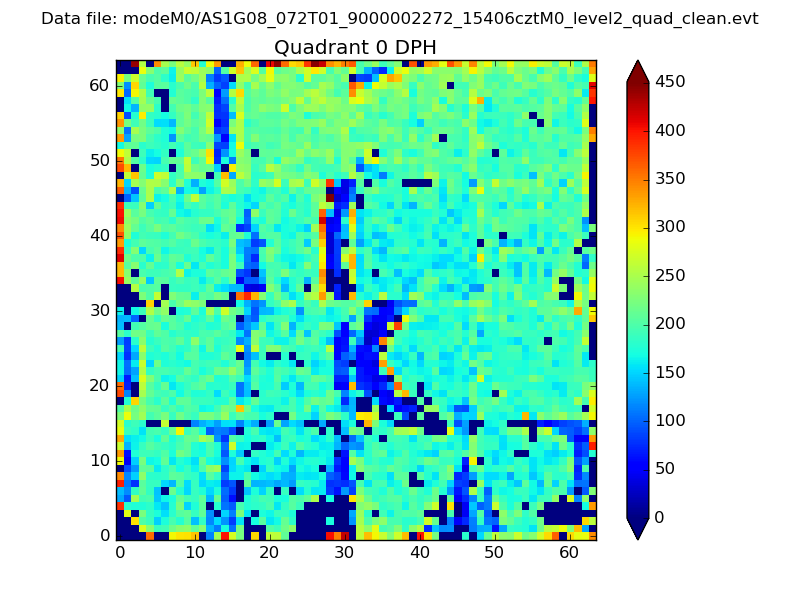 |
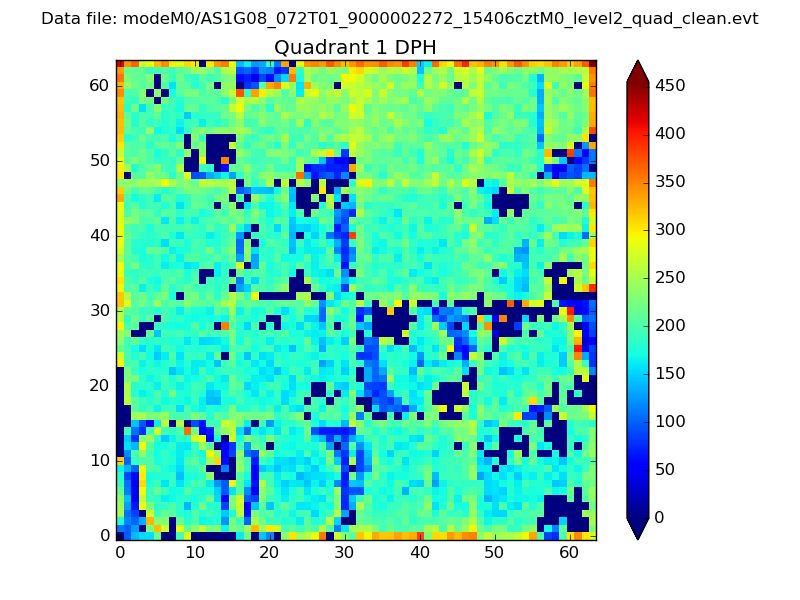 |
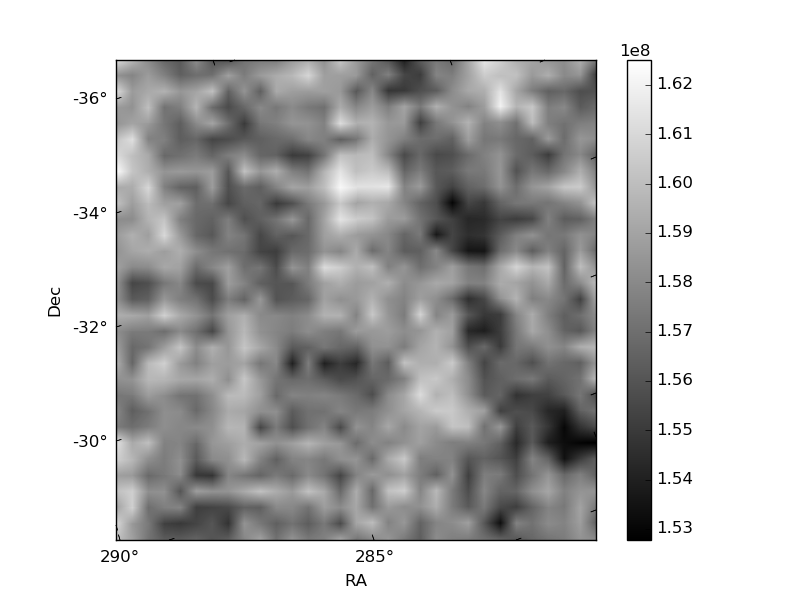
Quadrant B |
|---|---|---|---|
| Quadrant D | 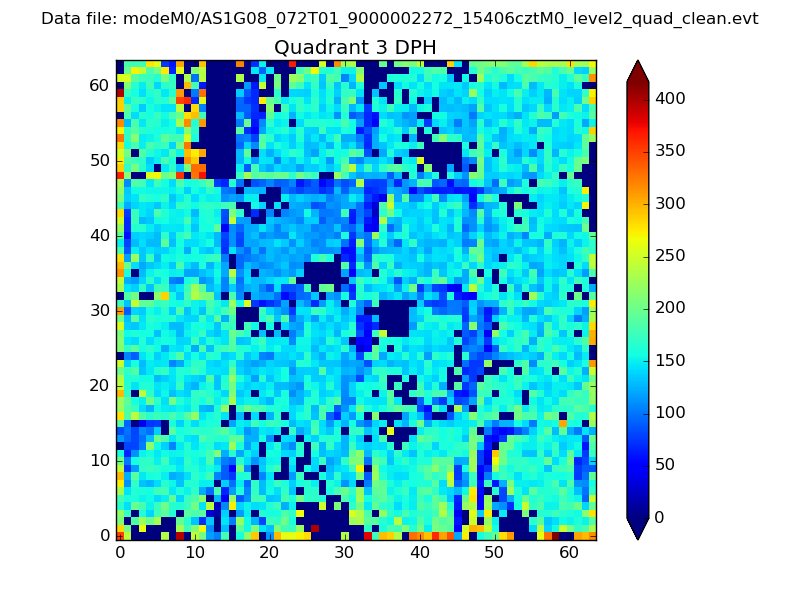 |
 |
Quadrant C |
| Plot type | Count rate plots | Images |
|---|---|---|
| Comparison with Poisson distribution Blue bars denote a histogram of data divided into 1 sec bins. Red curve is a Poisson curve with rate = median count rate of data. |
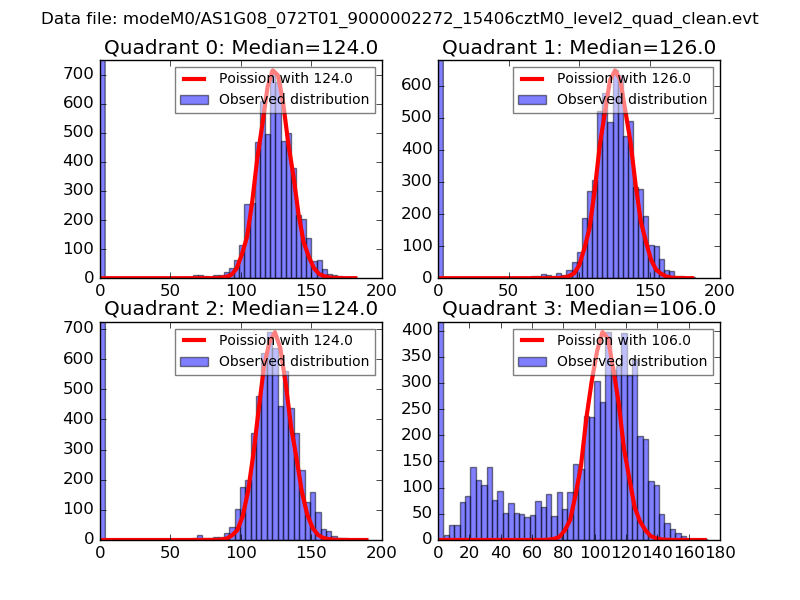 |
 |
| Quadrant-wise count rates Data is divided into 100 sec bins |
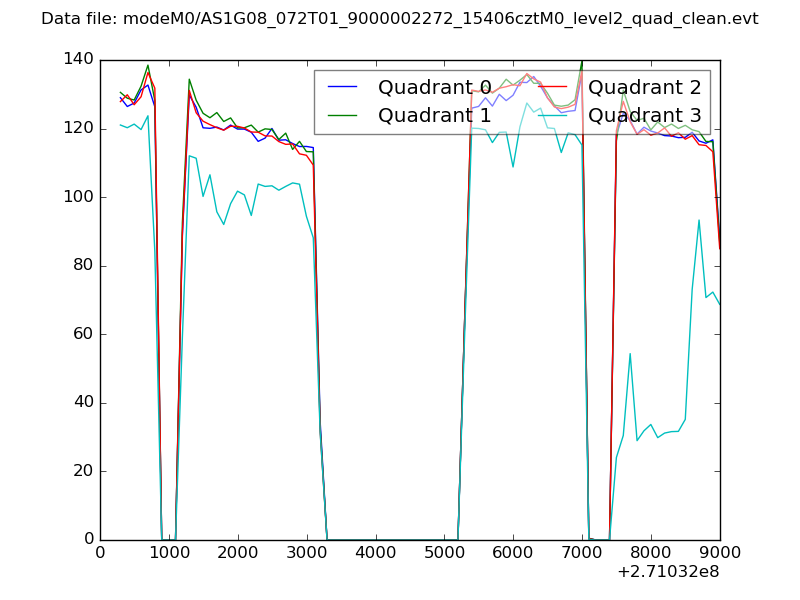 |
|
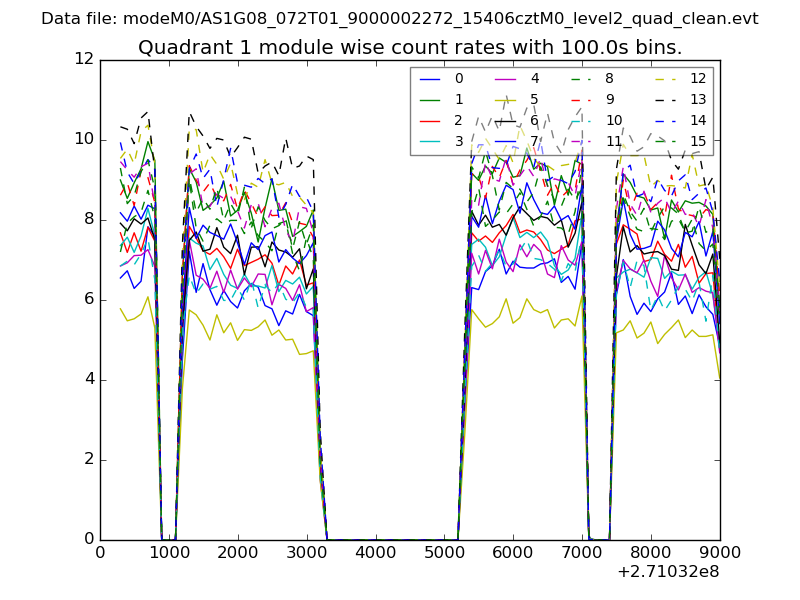
| Module-wise count rates for Quadrant A Data is divided into 100 sec bins |
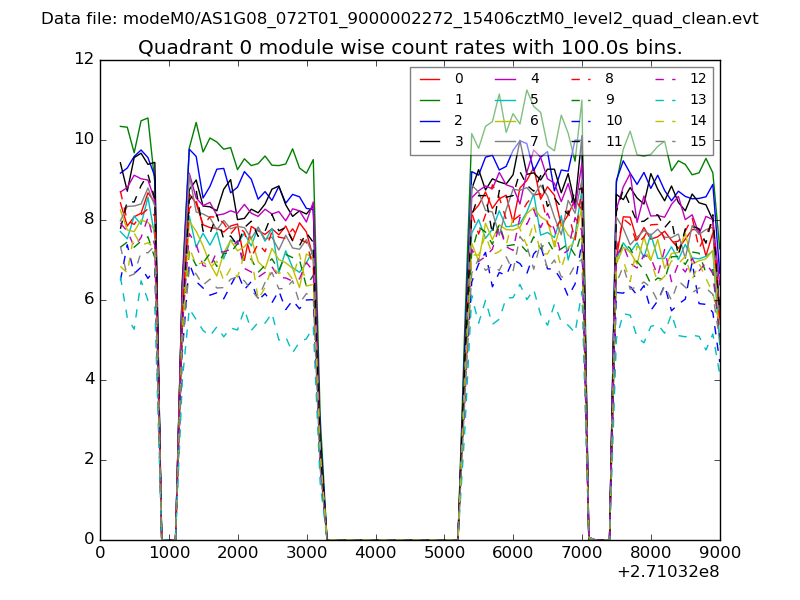 |
 |
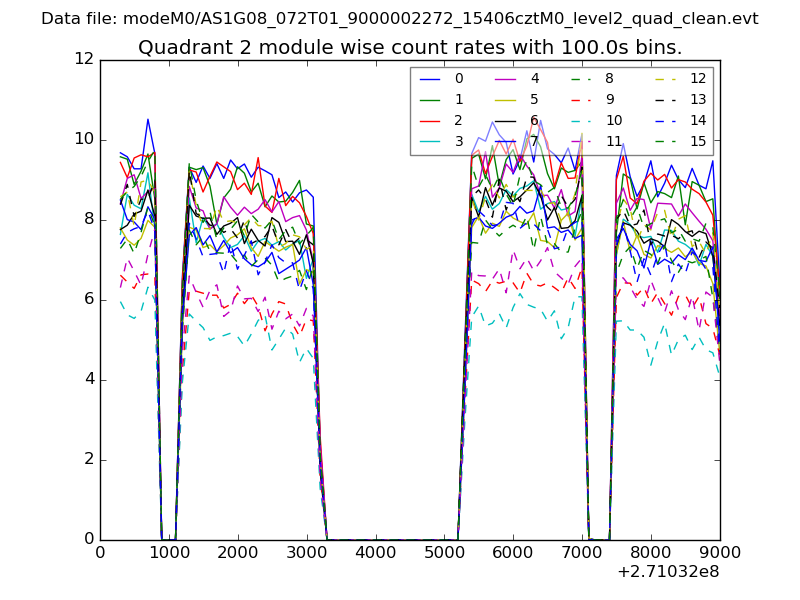
| Module-wise count rates for Quadrant B Data is divided into 100 sec bins |
 |
 |
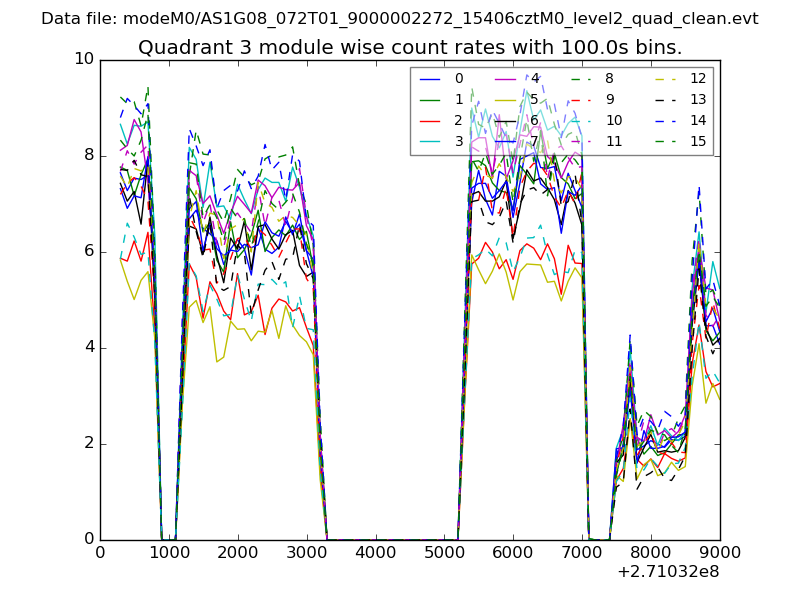
| Module-wise count rates for Quadrant C Data is divided into 100 sec bins |
 |
 |
| Module-wise count rates for Quadrant D Data is divided into 100 sec bins |
 |
 |
| Parameter | Plot |
|---|---|
| CZT HV Monitor | 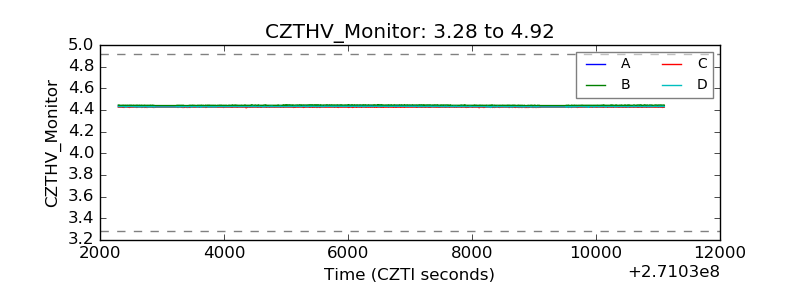 |
| D_VDD | 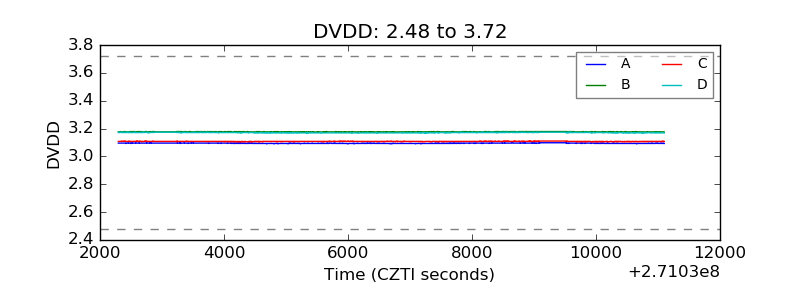 |
| Temperature 1 | 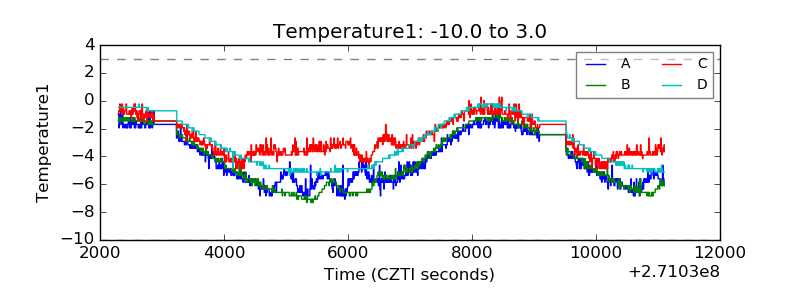 |
| Veto HV Monitor | 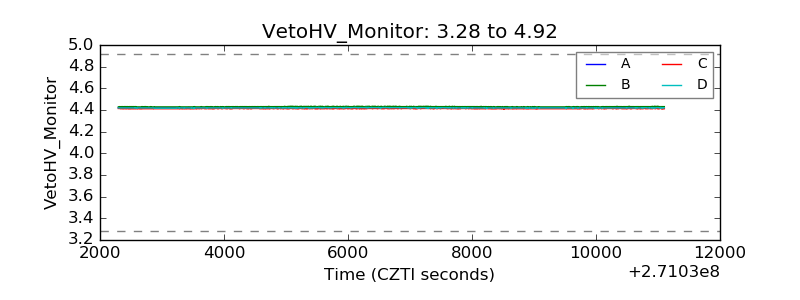 |
| Veto LLD | 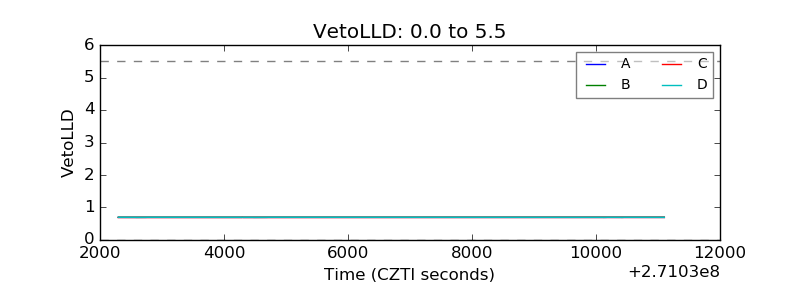 |
| Alpha Counter | 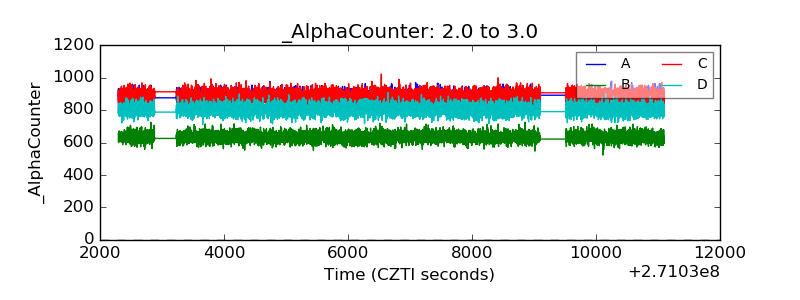 |
| _CPM_Rate | 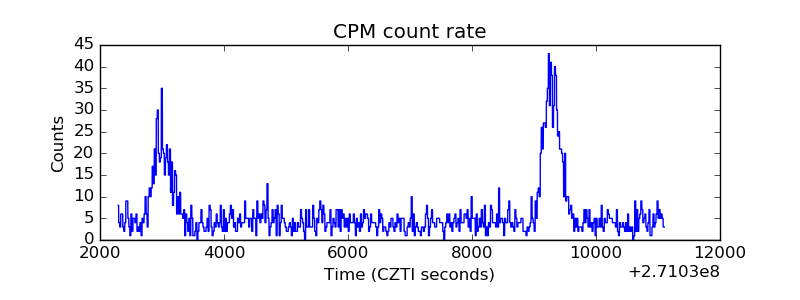 |
| CZT Counter | 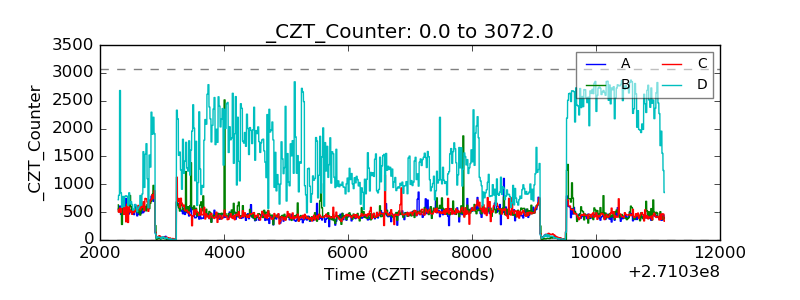 |
| +2.5 Volts monitor |  |
| +5 Volts monitor | 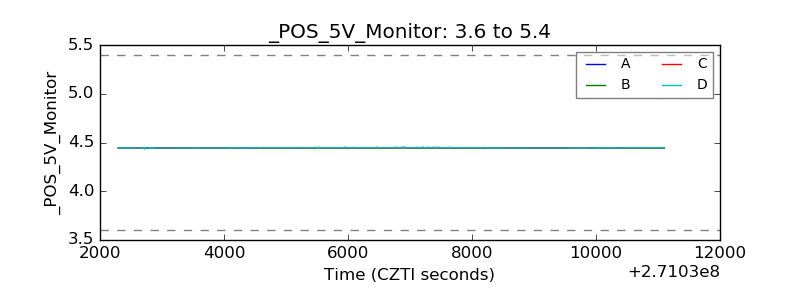 |
| _ROLL_ROT | 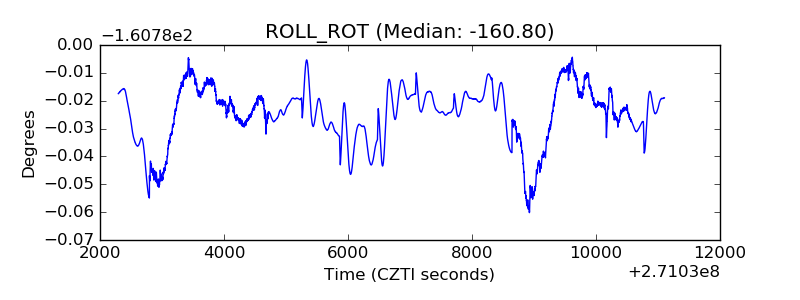 |
| _Roll_DEC | 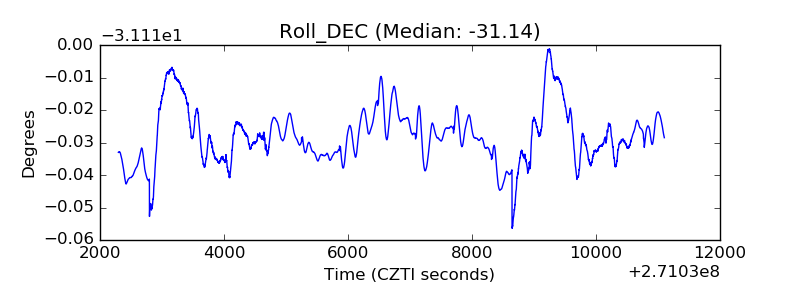 |
| _Roll_RA | 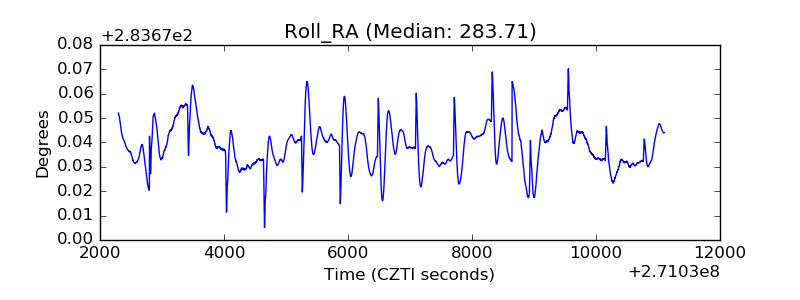 |
| Veto Counter | 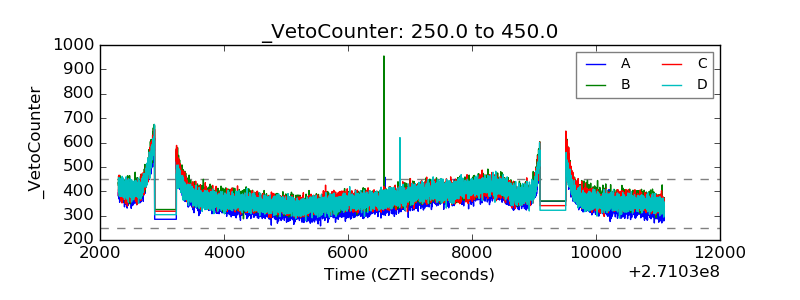 |