| Param | Original file | Final file |
|---|---|---|
| Filename | modeM0/AS1G08_072T01_9000002272_15412cztM0_level2.evt | modeM0/AS1G08_072T01_9000002272_15412cztM0_level2_quad_clean.evt |
| Size (bytes) | 230,126,400 | 30,335,040 |
| Size | 219.5 MB | 28.9 MB |
| Events in quadrant A | 1,592,713 | 171,681 |
| Events in quadrant B | 1,591,296 | 177,975 |
| Events in quadrant C | 1,844,109 | 177,223 |
| Events in quadrant D | 1,725,250 | 166,844 |
| Mode SS | |||
|---|---|---|---|
| Quadrant | BADHDUFLAG | Total packets | Discarded packets |
| A | 0 | 66 | 0 |
| B | 0 | 66 | 2 |
| C | 0 | 66 | 4 |
| D | 0 | 66 | 8 |
| Mode M9 | |||
|---|---|---|---|
| Quadrant | BADHDUFLAG | Total packets | Discarded packets |
| A | 1 | 273359709408 | 0 |
| B | 1 | -1 | -1 |
| C | 1 | -1 | -1 |
| D | 1 | -1 | -1 |
| Mode M0 | |||
|---|---|---|---|
| Quadrant | BADHDUFLAG | Total packets | Discarded packets |
| A | 0 | 6936 | 259 |
| B | 0 | 6866 | 232 |
| C | 0 | 7838 | 373 |
| D | 0 | 7348 | 242 |
| Quadrant | Total seconds | Saturated seconds | Saturation percentage |
|---|---|---|---|
| A | 3155 | 23 | 0.729002% |
| B | 3170 | 25 | 0.788644% |
| C | 3132 | 18 | 0.574713% |
| D | 3158 | 23 | 0.728309% |
Noise dominated data is calculated using 1-second bins in cleaned event files. If a bin has >2000 counts, and if more than 50% of those come from <1% of pixels, then it is considered to be noise-dominated and hence unusable.
| Quadrant | # 1 sec bins | Bins with >0 counts | Bins with >2000 counts | High rate bins dominated by noise | Noise dominated (total time) | Noise dominated (detector-on time) | Marked lightcurve |
|---|---|---|---|---|---|---|---|
| A | 3275 | 3242 | 3 | 3 | 0.09% | 0.09% | 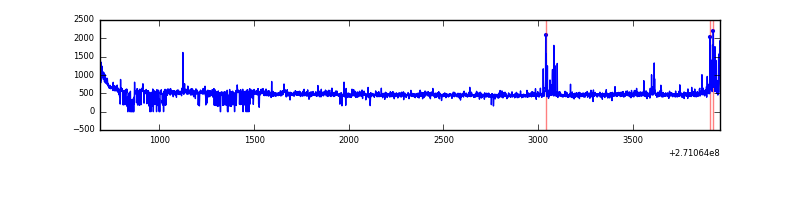 |
| B | 3275 | 3248 | 1 | 1 | 0.03% | 0.03% | 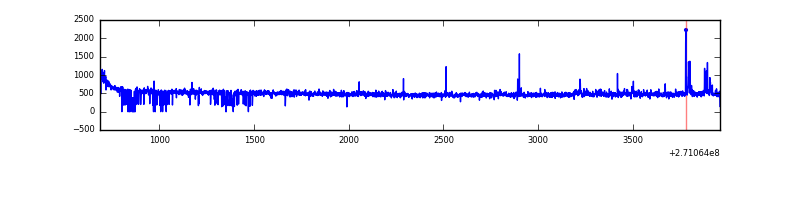 |
| C | 3275 | 3237 | 1 | 1 | 0.03% | 0.03% | 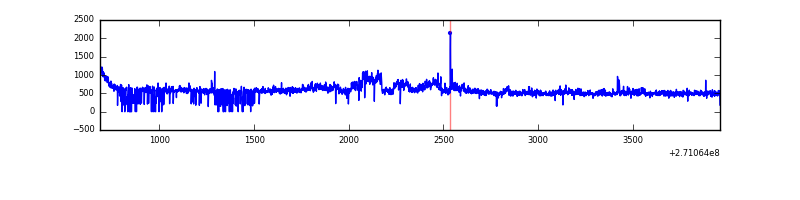 |
| D | 3275 | 3247 | 5 | 5 | 0.15% | 0.15% | 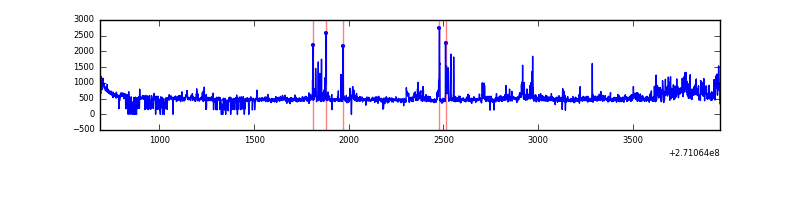 |
Top three noisy pixels from each quadrant. If the there are fewer than three noisy pixels in the level2.evt file, extra rows are filled as -1
| Pixel properties | Quadrant properties | ||||||
|---|---|---|---|---|---|---|---|
| Quadrant | DetID | PixID | Counts | Sigma | Mean | Median | Sigma |
| A | 14 | 238 | 49542 | 612.58 | 392 | 384 | 80.2 |
| A | 14 | 237 | 13940 | 168.93 | 392 | 384 | 80.2 |
| A | 9 | 143 | 9355 | 111.79 | 392 | 384 | 80.2 |
| B | 4 | 48 | 16321 | 210.17 | 395 | 387 | 75.8 |
| B | 3 | 209 | 13007 | 166.45 | 395 | 387 | 75.8 |
| B | 0 | 197 | 9287 | 117.39 | 395 | 387 | 75.8 |
| C | 3 | 233 | 326075 | 3687.69 | 381 | 385 | 88.3 |
| C | 7 | 247 | 18847 | 209.04 | 381 | 385 | 88.3 |
| C | 10 | 22 | 11583 | 126.79 | 381 | 385 | 88.3 |
| D | 5 | 222 | 174340 | 1852.68 | 384 | 373 | 93.9 |
| D | 10 | 70 | 29062 | 305.53 | 384 | 373 | 93.9 |
| D | 2 | 221 | 22782 | 238.65 | 384 | 373 | 93.9 |
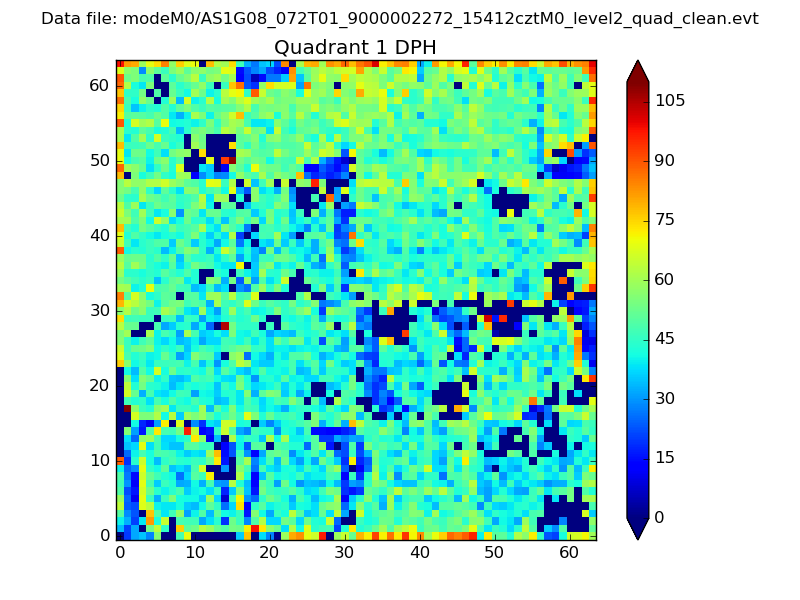
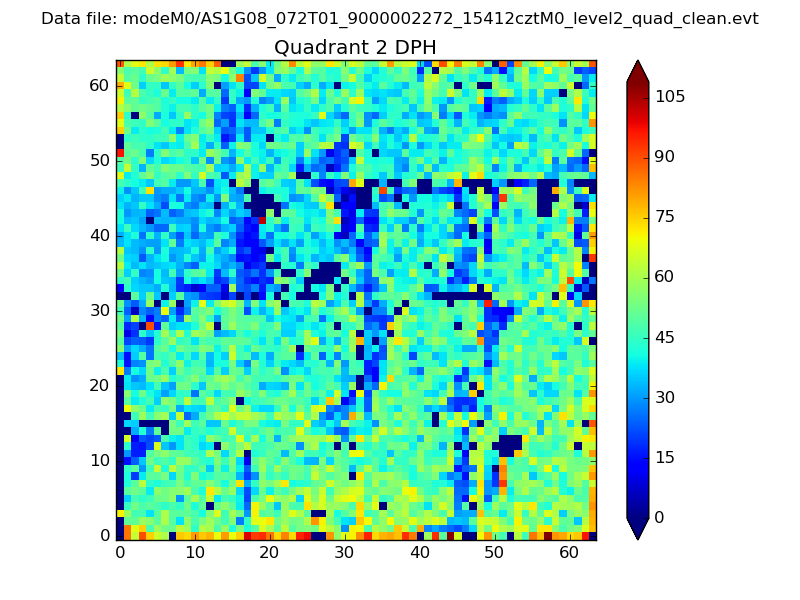
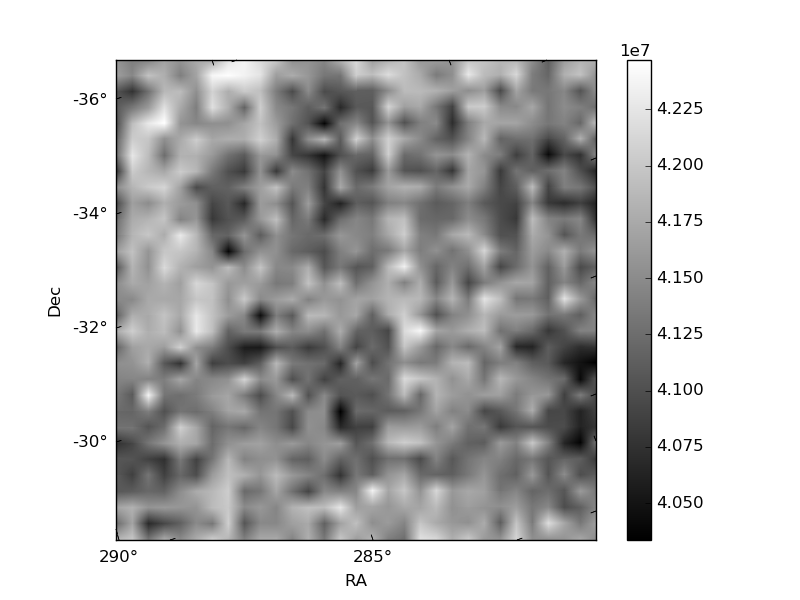
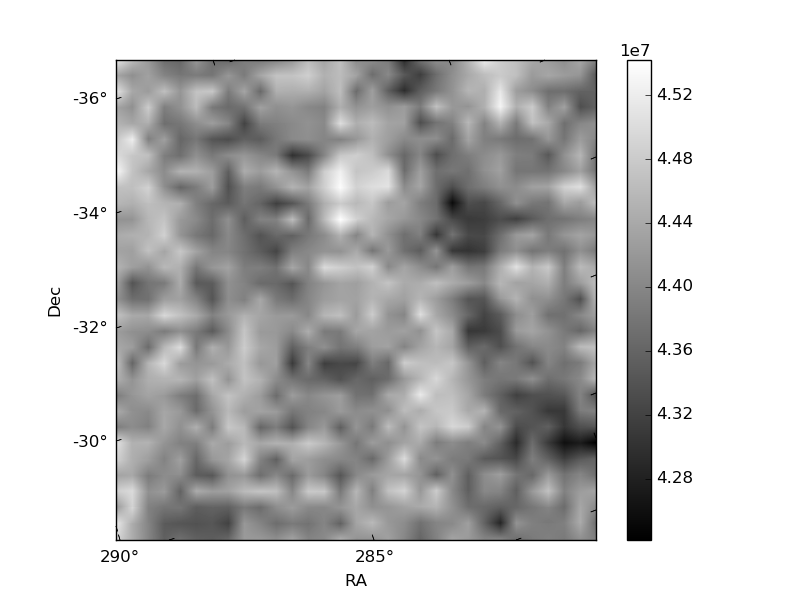
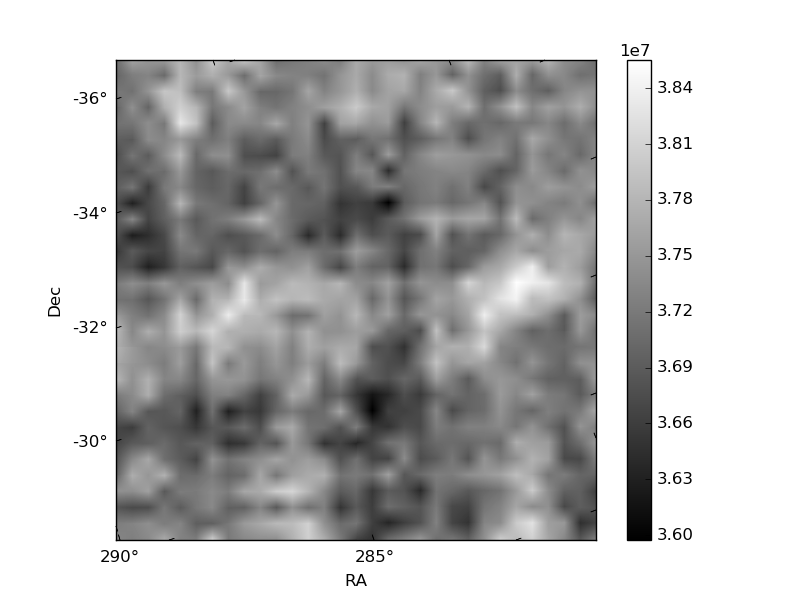
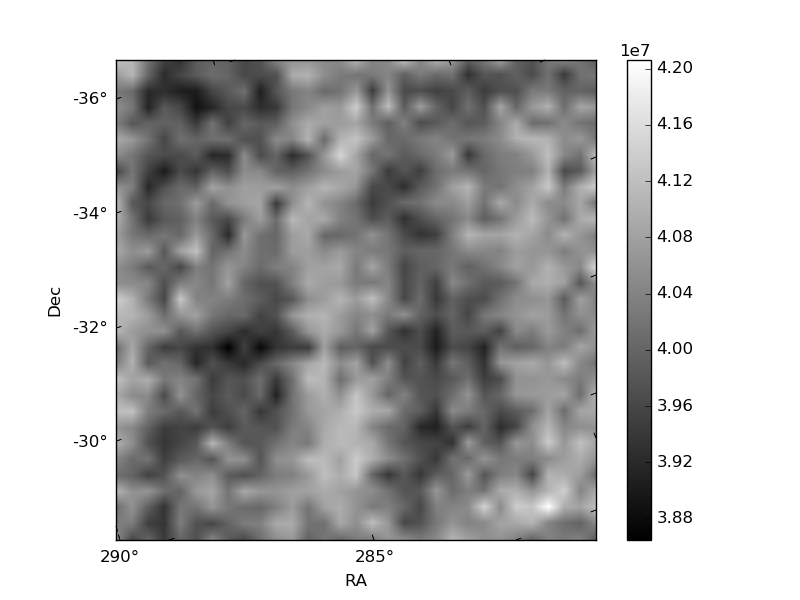
Histogram calculated using DETX and DETY for each event in the final _common_clean file
| Quadrant A |  |
 |
Quadrant B |
|---|---|---|---|
| Quadrant D |  |
 |
Quadrant C |
| Plot type | Count rate plots | Images |
|---|---|---|
| Comparison with Poisson distribution Blue bars denote a histogram of data divided into 1 sec bins. Red curve is a Poisson curve with rate = median count rate of data. |
 |
 |
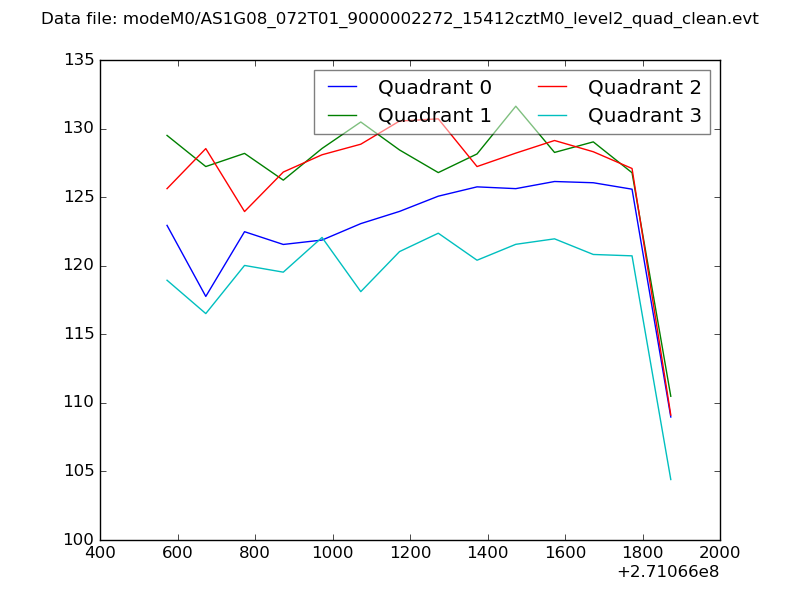
| Quadrant-wise count rates Data is divided into 100 sec bins |
 |
|
| Module-wise count rates for Quadrant A Data is divided into 100 sec bins |
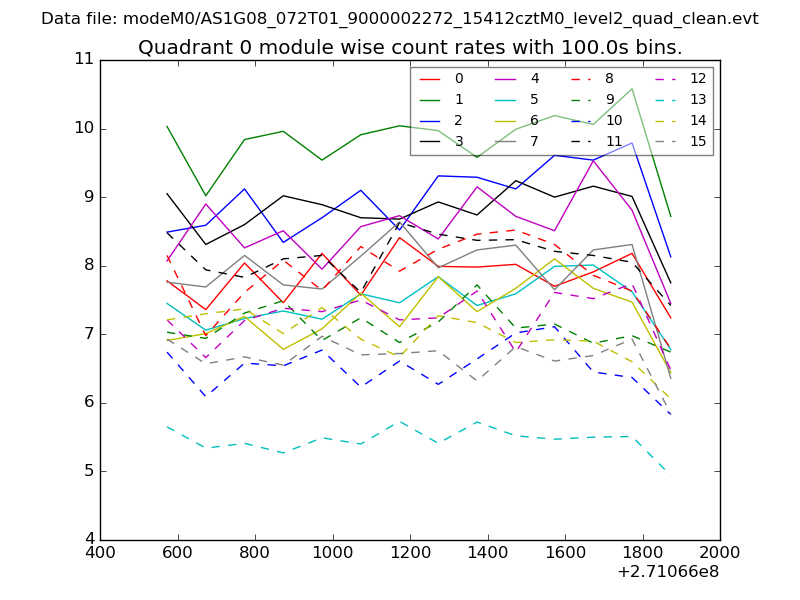 |
 |
| Module-wise count rates for Quadrant B Data is divided into 100 sec bins |
 |
 |
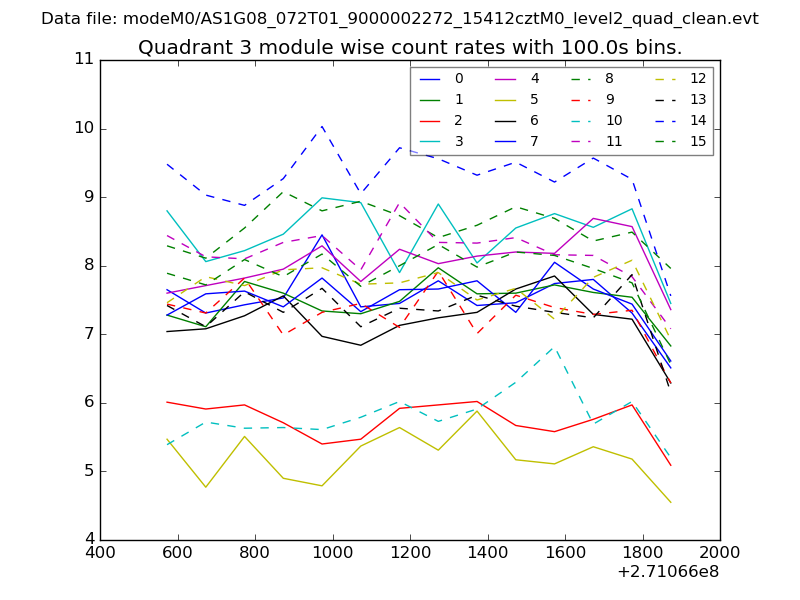
| Module-wise count rates for Quadrant C Data is divided into 100 sec bins |
 |
 |
| Module-wise count rates for Quadrant D Data is divided into 100 sec bins |
 |
 |
| Parameter | Plot |
|---|---|
| CZT HV Monitor |  |
| D_VDD | 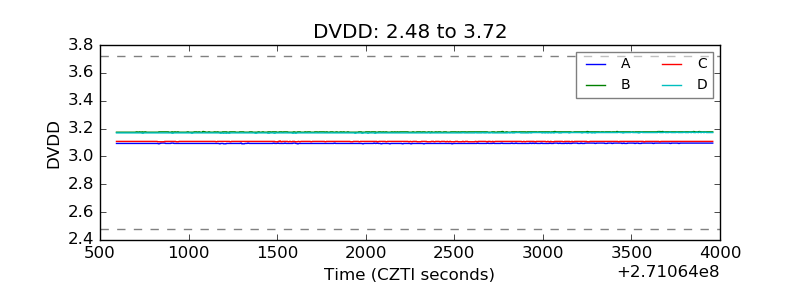 |
| Temperature 1 | 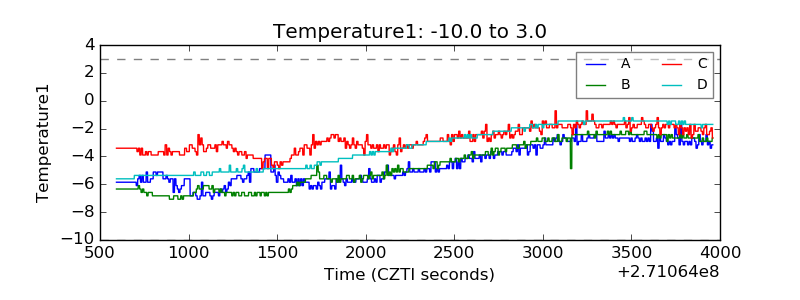 |
| Veto HV Monitor | 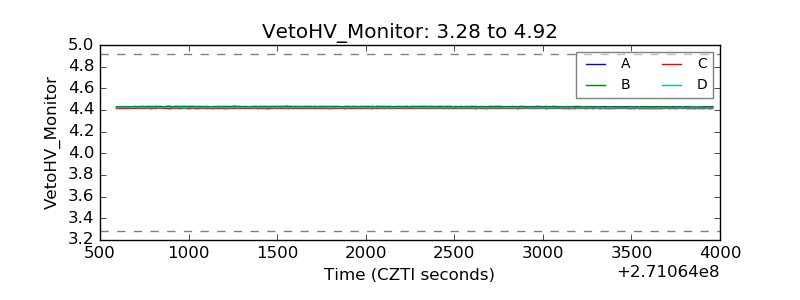 |
| Veto LLD | 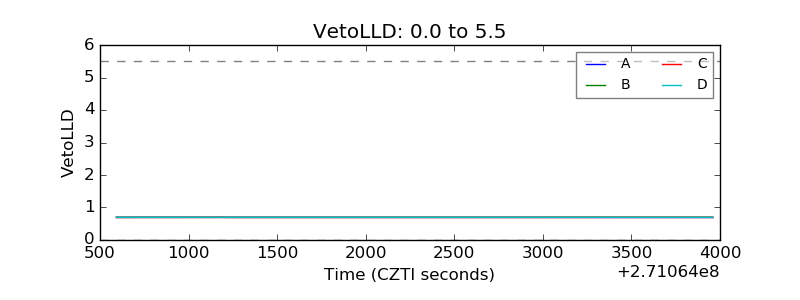 |
| Alpha Counter | 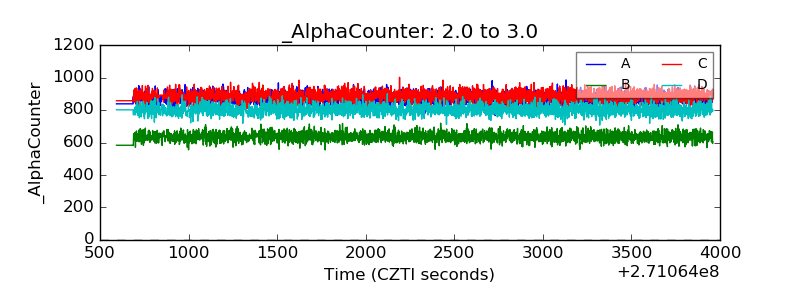 |
| _CPM_Rate | 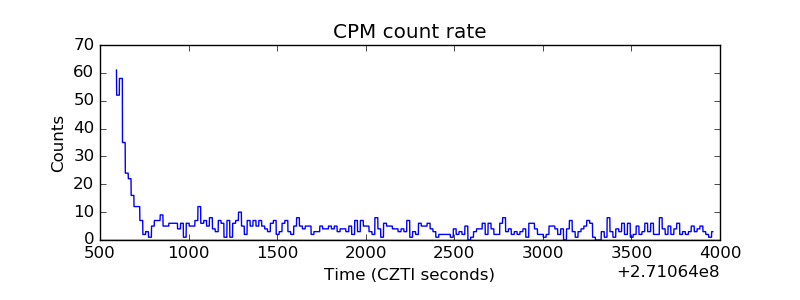 |
| CZT Counter | 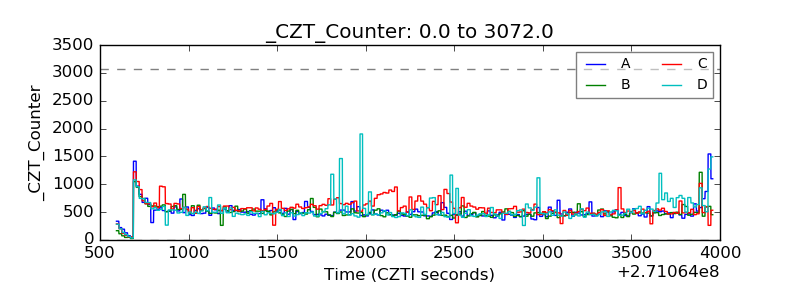 |
| +2.5 Volts monitor |  |
| +5 Volts monitor |  |
| _ROLL_ROT | 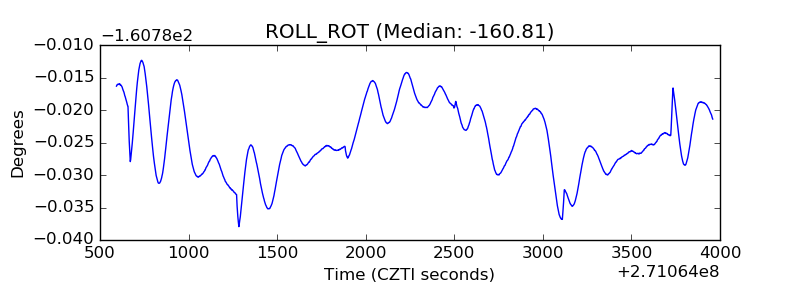 |
| _Roll_DEC | 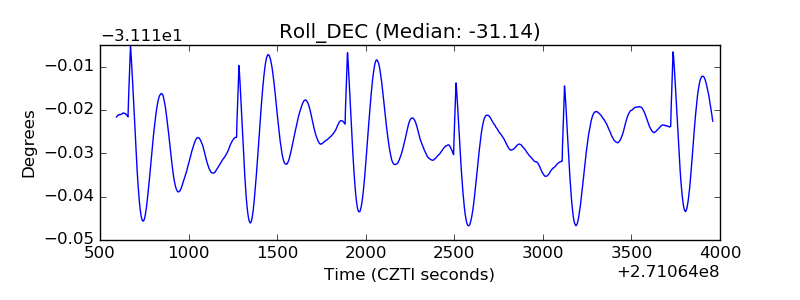 |
| _Roll_RA | 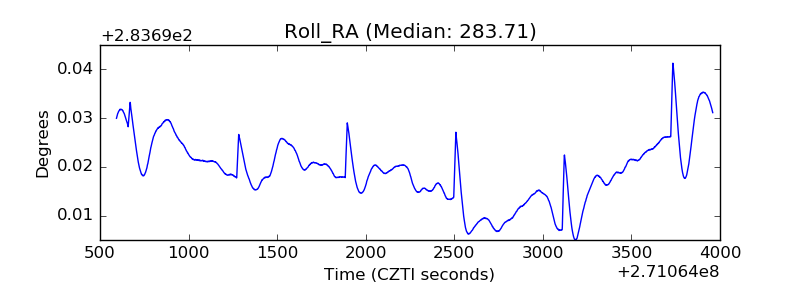 |
| Veto Counter | 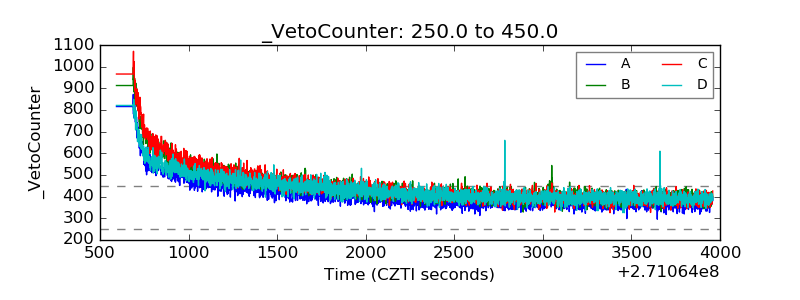 |