| Param | Original file | Final file |
|---|---|---|
| Filename | modeM0/AS1T02_076T01_9000002274cztM0_level2.fits | modeM0/AS1T02_076T01_9000002274cztM0_level2_quad_clean.evt |
| Size (bytes) | 674,688,960 | 686,122,560 |
| Size | 643.4 MB | 654.3 MB |
| Events in quadrant A | 4,132,934 | 4,176,570 |
| Events in quadrant B | 3,970,602 | 4,176,329 |
| Events in quadrant C | 4,007,898 | 3,981,272 |
| Events in quadrant D | 3,467,026 | 3,592,861 |
| Mode M0 | |||
|---|---|---|---|
| Quadrant | BADHDUFLAG | Total packets | Discarded packets |
| A | 0 | 161038 | 0 |
| B | 0 | 155899 | 0 |
| C | 0 | 168379 | 0 |
| D | 0 | 211053 | 0 |
| Mode SS | |||
|---|---|---|---|
| Quadrant | BADHDUFLAG | Total packets | Discarded packets |
| A | 0 | 1442 | 0 |
| B | 0 | 1442 | 0 |
| C | 0 | 1442 | 0 |
| D | 0 | 1442 | 0 |
| Mode M9 | |||
|---|---|---|---|
| Quadrant | BADHDUFLAG | Total packets | Discarded packets |
| A | 0 | 114 | 0 |
| B | 0 | 114 | 0 |
| C | 0 | 114 | 0 |
| D | 0 | 114 | 0 |
| Quadrant | Total seconds | Saturated seconds | Saturation percentage |
|---|---|---|---|
| A | 70764 | 1764 | 2.492793% |
| B | 70765 | 1075 | 1.519113% |
| C | 70765 | 1573 | 2.222850% |
| D | 70765 | 3378 | 4.773546% |
Noise dominated data is calculated using 1-second bins in cleaned event files. If a bin has >2000 counts, and if more than 50% of those come from <1% of pixels, then it is considered to be noise-dominated and hence unusable.
| Quadrant | # 1 sec bins | Bins with >0 counts | Bins with >2000 counts | High rate bins dominated by noise | Noise dominated (total time) | Noise dominated (detector-on time) | Marked lightcurve |
|---|---|---|---|---|---|---|---|
| A | 82236 | 70752 | 0 | 0 | 0.00% | 0.00% |  |
| B | 82236 | 70752 | 0 | 0 | 0.00% | 0.00% |  |
| C | 82236 | 70758 | 0 | 0 | 0.00% | 0.00% |  |
| D | 82236 | 70738 | 0 | 0 | 0.00% | 0.00% |  |
Top three noisy pixels from each quadrant. If the there are fewer than three noisy pixels in the level2.evt file, extra rows are filled as -1
| Pixel properties | Quadrant properties | ||||||
|---|---|---|---|---|---|---|---|
| Quadrant | DetID | PixID | Counts | Sigma | Mean | Median | Sigma |
| A | 0 | 29 | 3991 | 11.35 | 1076 | 1014 | 262.3 |
| A | 7 | 110 | 3322 | 8.8 | 1076 | 1014 | 262.3 |
| A | 0 | 30 | 3176 | 8.24 | 1076 | 1014 | 262.3 |
| B | 2 | 9 | 3312 | 11.31 | 1051 | 1006 | 203.9 |
| B | 2 | 8 | 2750 | 8.55 | 1051 | 1006 | 203.9 |
| B | 3 | 80 | 2721 | 8.41 | 1051 | 1006 | 203.9 |
| C | 1 | 81 | 3142 | 7.97 | 1060 | 991 | 269.8 |
| C | 1 | 80 | 3133 | 7.94 | 1060 | 991 | 269.8 |
| C | 3 | 126 | 2739 | 6.48 | 1060 | 991 | 269.8 |
| D | 3 | 14 | 2556 | 6.22 | 990 | 898 | 266.4 |
| D | 6 | 231 | 2474 | 5.92 | 990 | 898 | 266.4 |
| D | 10 | 189 | 2460 | 5.86 | 990 | 898 | 266.4 |
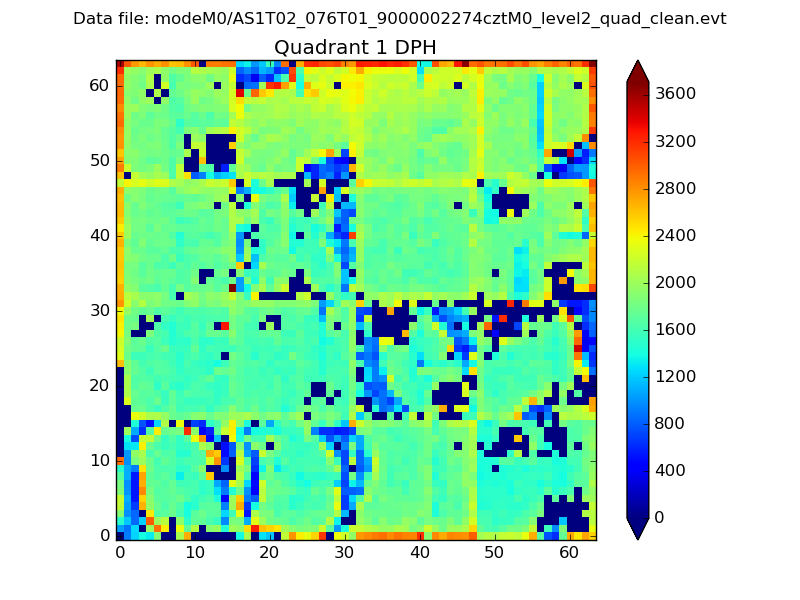
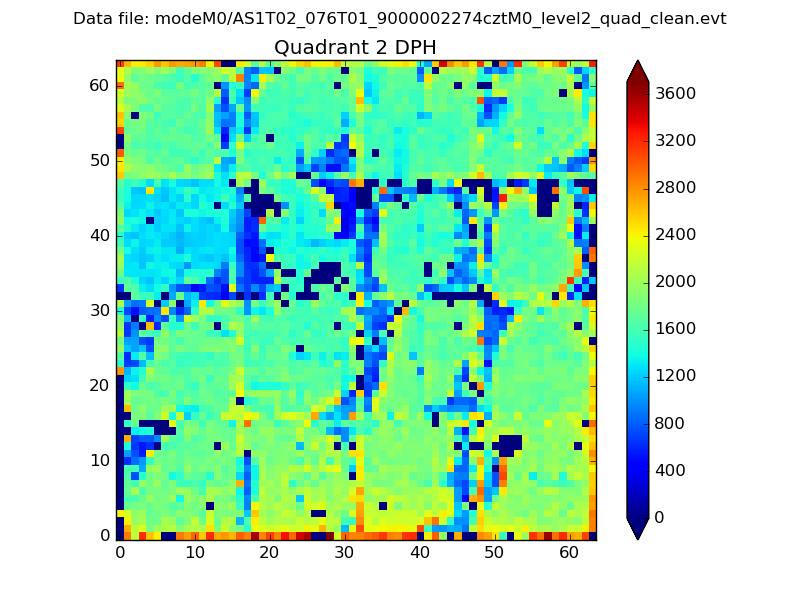
Histogram calculated using DETX and DETY for each event in the final _common_clean file
| Quadrant A |  |
 |
Quadrant B |
|---|---|---|---|
| Quadrant D |  |
 |
Quadrant C |
| Plot type | Count rate plots | Images |
|---|---|---|
| Comparison with Poisson distribution Blue bars denote a histogram of data divided into 1 sec bins. Red curve is a Poisson curve with rate = median count rate of data. |
 |
 |
| Quadrant-wise count rates Data is divided into 100 sec bins |
 |
|
| Module-wise count rates for Quadrant A Data is divided into 100 sec bins |
 |
 |
| Module-wise count rates for Quadrant B Data is divided into 100 sec bins |
 |
 |
| Module-wise count rates for Quadrant C Data is divided into 100 sec bins |
 |
 |
| Module-wise count rates for Quadrant D Data is divided into 100 sec bins |
 |
 |
| Parameter | Plot |
|---|---|
| CZT HV Monitor |  |
| D_VDD | 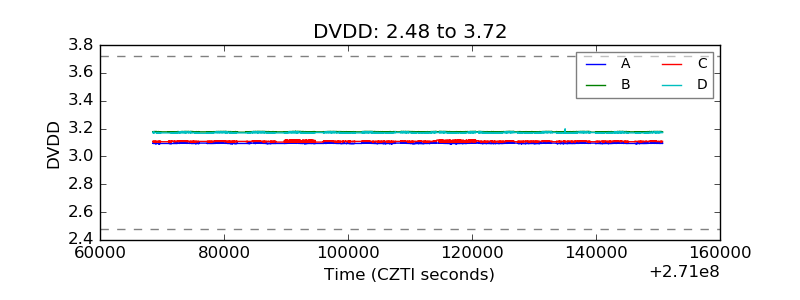 |
| Temperature 1 |  |
| Veto HV Monitor |  |
| Veto LLD |  |
| Alpha Counter |  |
| _CPM_Rate |  |
| CZT Counter |  |
| +2.5 Volts monitor |  |
| +5 Volts monitor |  |
| _ROLL_ROT | 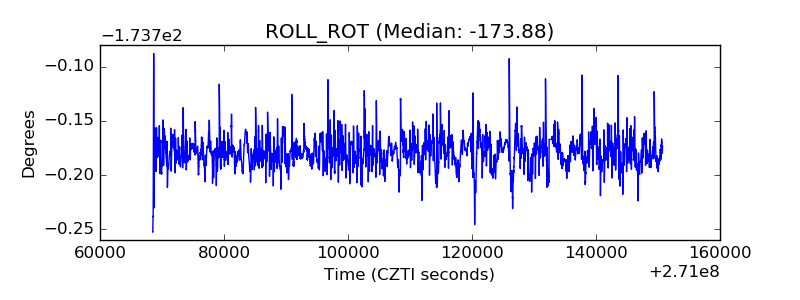 |
| _Roll_DEC |  |
| _Roll_RA | 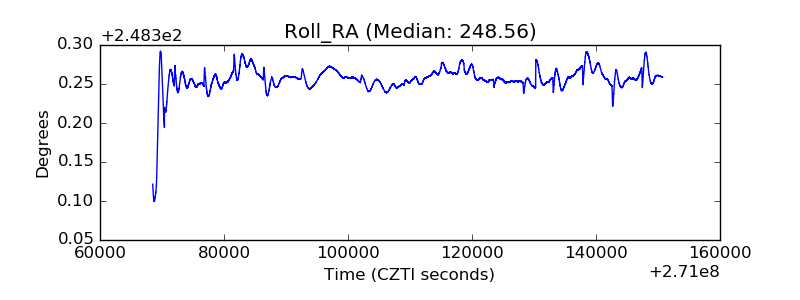 |
| Veto Counter |  |