| Param | Original file | Final file |
|---|---|---|
| Filename | modeM0/AS1T02_076T01_9000002274_15412cztM0_level2.evt | modeM0/AS1T02_076T01_9000002274_15412cztM0_level2_quad_clean.evt |
| Size (bytes) | 205,084,800 | 41,662,080 |
| Size | 195.6 MB | 39.7 MB |
| Events in quadrant A | 1,633,263 | 267,581 |
| Events in quadrant B | 1,479,970 | 273,799 |
| Events in quadrant C | 1,455,631 | 271,500 |
| Events in quadrant D | 1,459,556 | 258,042 |
| Mode M0 | |||
|---|---|---|---|
| Quadrant | BADHDUFLAG | Total packets | Discarded packets |
| A | 0 | 6645 | 17 |
| B | 0 | 6129 | 3 |
| C | 0 | 6046 | 3 |
| D | 0 | 6153 | 3 |
| Mode SS | |||
|---|---|---|---|
| Quadrant | BADHDUFLAG | Total packets | Discarded packets |
| A | 0 | 56 | 0 |
| B | 0 | 56 | 0 |
| C | 0 | 56 | 0 |
| D | 0 | 56 | 0 |
| Mode M9 | |||
|---|---|---|---|
| Quadrant | BADHDUFLAG | Total packets | Discarded packets |
| A | 0 | 11 | 0 |
| B | 0 | 11 | 0 |
| C | 0 | 11 | 0 |
| D | 0 | 11 | 0 |
| Quadrant | Total seconds | Saturated seconds | Saturation percentage |
|---|---|---|---|
| A | 2652 | 105 | 3.959276% |
| B | 2653 | 45 | 1.696193% |
| C | 2653 | 36 | 1.356954% |
| D | 2653 | 58 | 2.186204% |
Noise dominated data is calculated using 1-second bins in cleaned event files. If a bin has >2000 counts, and if more than 50% of those come from <1% of pixels, then it is considered to be noise-dominated and hence unusable.
| Quadrant | # 1 sec bins | Bins with >0 counts | Bins with >2000 counts | High rate bins dominated by noise | Noise dominated (total time) | Noise dominated (detector-on time) | Marked lightcurve |
|---|---|---|---|---|---|---|---|
| A | 3800 | 2654 | 56 | 56 | 1.47% | 2.11% | 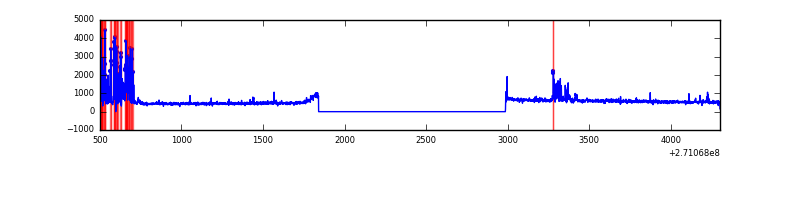 |
| B | 3800 | 2655 | 6 | 6 | 0.16% | 0.23% | 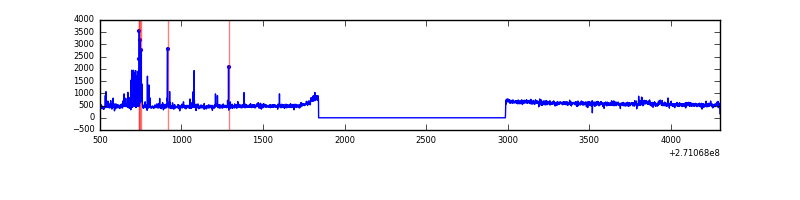 |
| C | 3800 | 2655 | 1 | 1 | 0.03% | 0.04% | 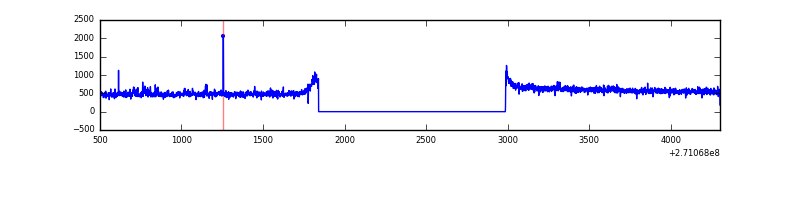 |
| D | 3800 | 2655 | 13 | 13 | 0.34% | 0.49% | 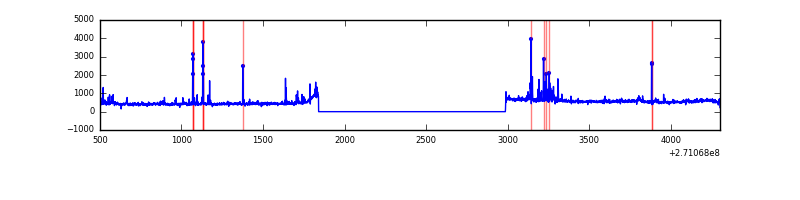 |
Top three noisy pixels from each quadrant. If the there are fewer than three noisy pixels in the level2.evt file, extra rows are filled as -1
| Pixel properties | Quadrant properties | ||||||
|---|---|---|---|---|---|---|---|
| Quadrant | DetID | PixID | Counts | Sigma | Mean | Median | Sigma |
| A | 14 | 238 | 209353 | 2913.65 | 350 | 342 | 71.7 |
| A | 14 | 237 | 70315 | 975.44 | 350 | 342 | 71.7 |
| A | 9 | 143 | 8408 | 112.44 | 350 | 342 | 71.7 |
| B | 0 | 197 | 62954 | 916.77 | 352 | 342 | 68.3 |
| B | 0 | 189 | 16185 | 231.97 | 352 | 342 | 68.3 |
| B | 12 | 111 | 7746 | 108.41 | 352 | 342 | 68.3 |
| C | 3 | 233 | 80357 | 1002.03 | 344 | 346 | 79.8 |
| C | 7 | 247 | 24710 | 305.13 | 344 | 346 | 79.8 |
| C | 10 | 22 | 6069 | 71.67 | 344 | 346 | 79.8 |
| D | 10 | 70 | 52442 | 622.54 | 342 | 332 | 83.7 |
| D | 13 | 122 | 41325 | 489.73 | 342 | 332 | 83.7 |
| D | 7 | 38 | 20211 | 237.49 | 342 | 332 | 83.7 |
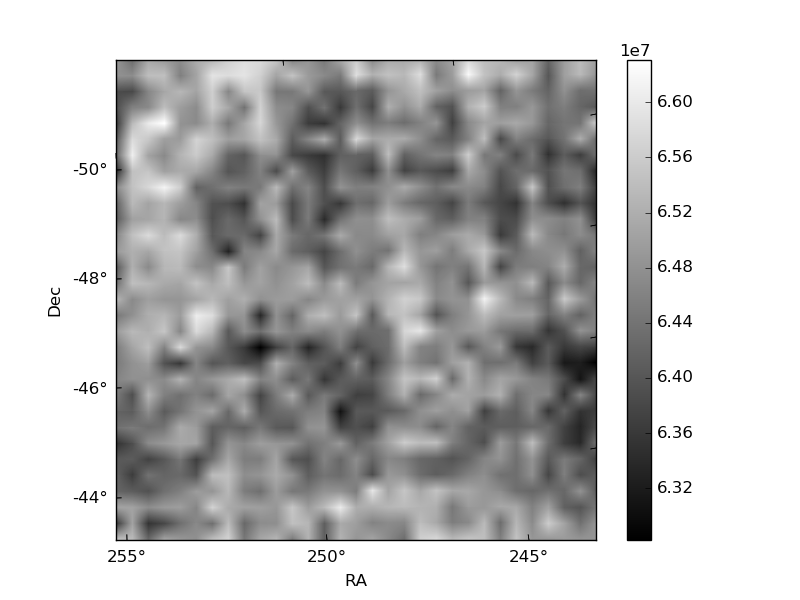
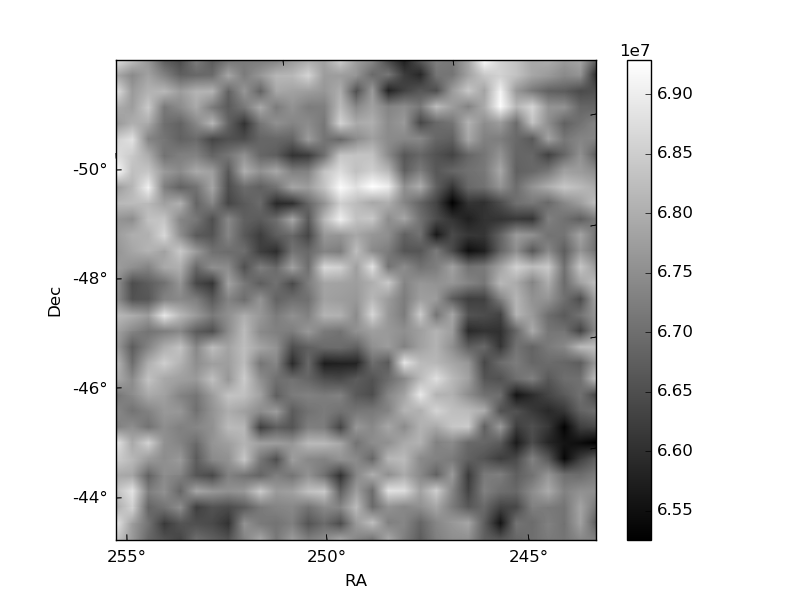
Histogram calculated using DETX and DETY for each event in the final _common_clean file
| Quadrant A | 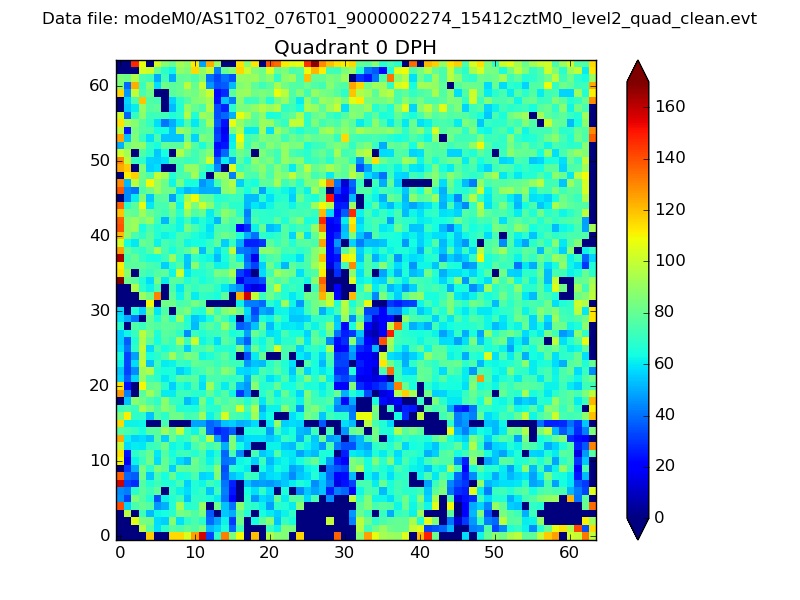 |
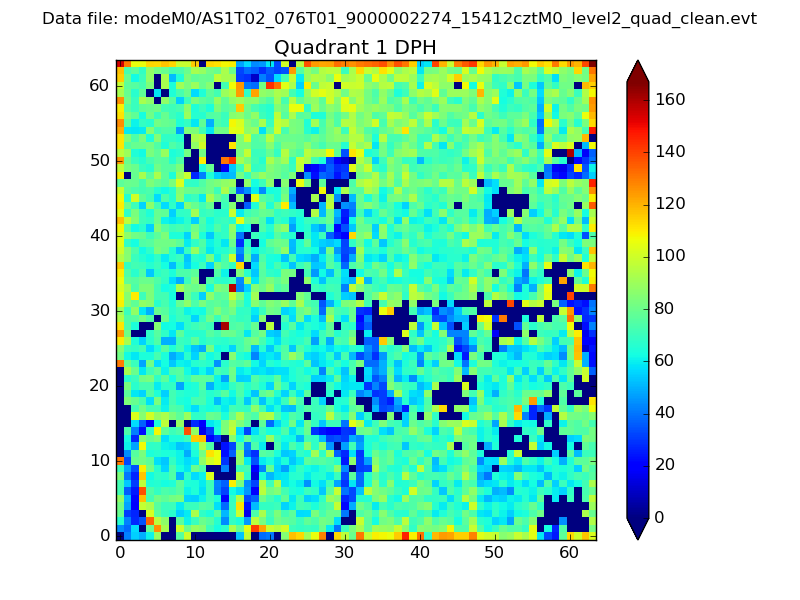 |
Quadrant B |
|---|---|---|---|
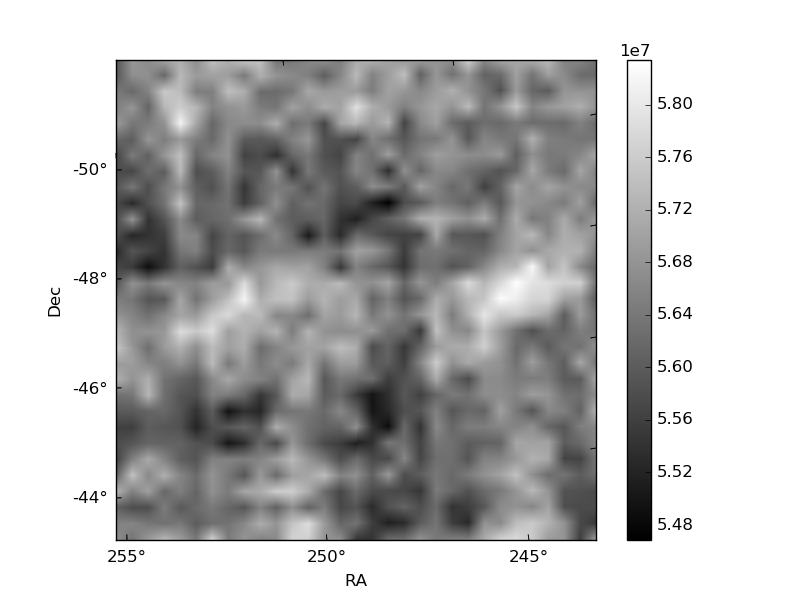
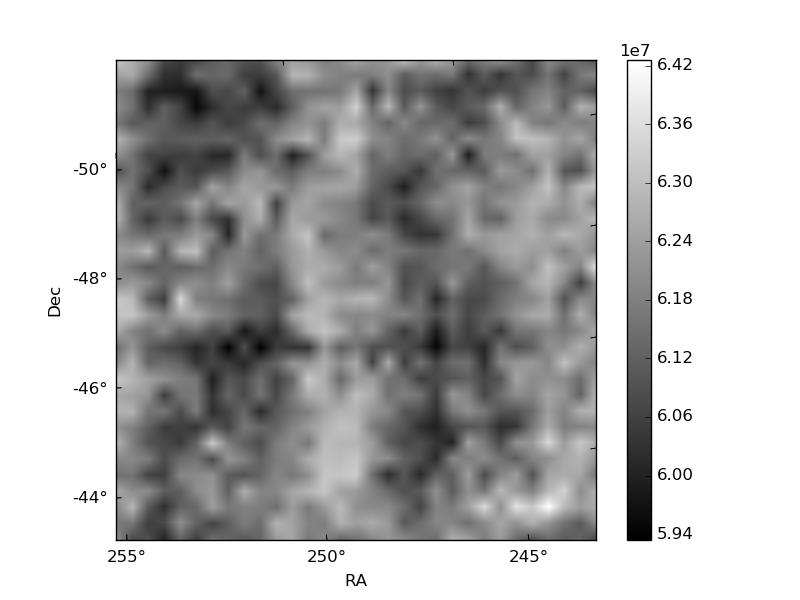
| Quadrant D |  |
 |
Quadrant C |
| Plot type | Count rate plots | Images |
|---|---|---|
| Comparison with Poisson distribution Blue bars denote a histogram of data divided into 1 sec bins. Red curve is a Poisson curve with rate = median count rate of data. |
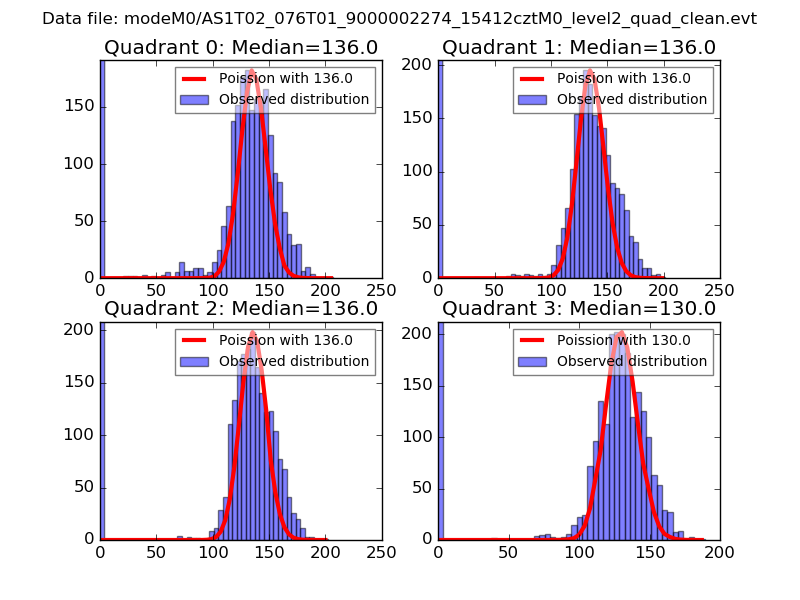 |
 |
| Quadrant-wise count rates Data is divided into 100 sec bins |
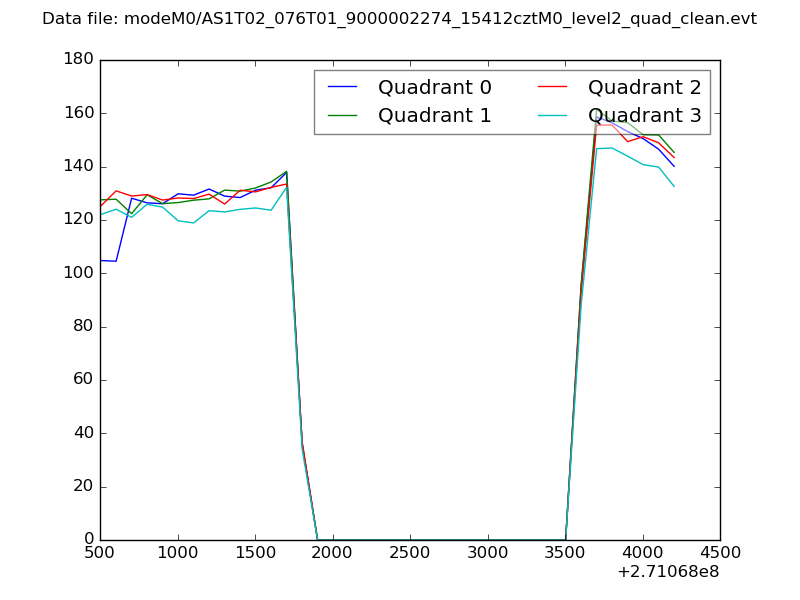 |
|
| Module-wise count rates for Quadrant A Data is divided into 100 sec bins |
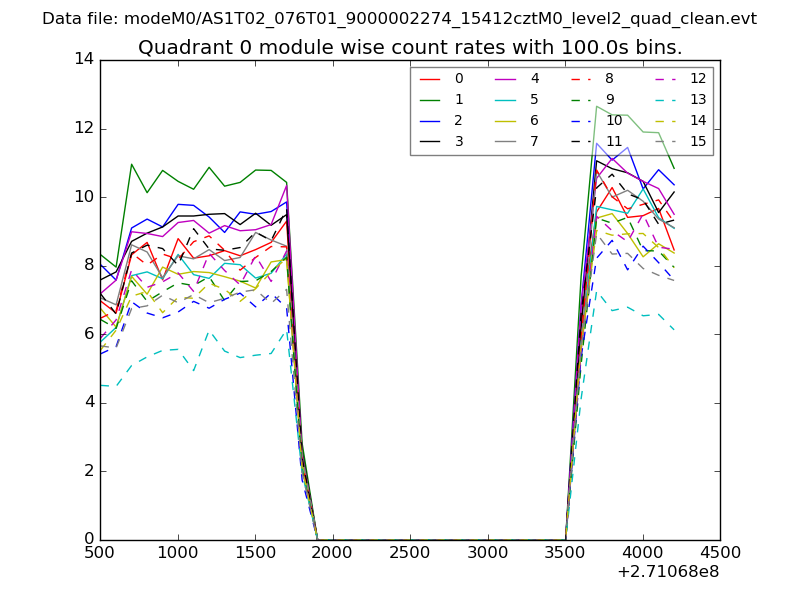 |
 |
| Module-wise count rates for Quadrant B Data is divided into 100 sec bins |
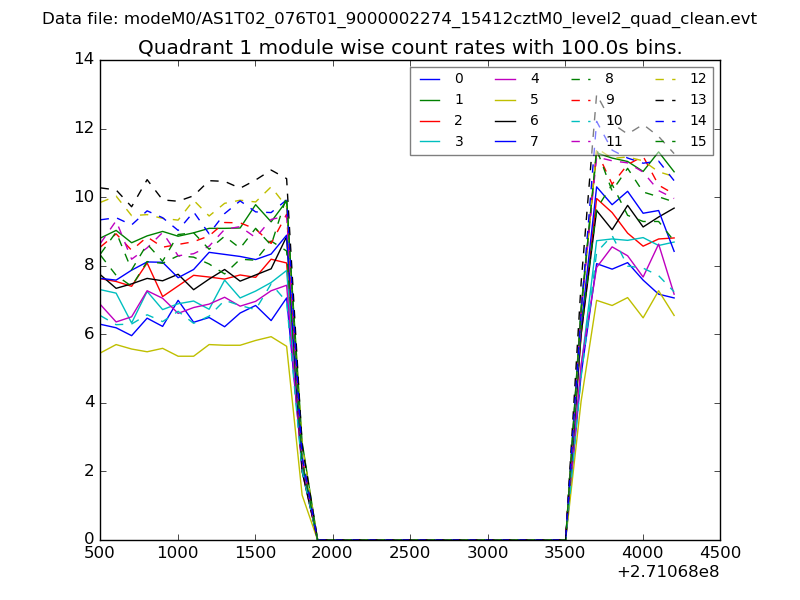 |
 |
| Module-wise count rates for Quadrant C Data is divided into 100 sec bins |
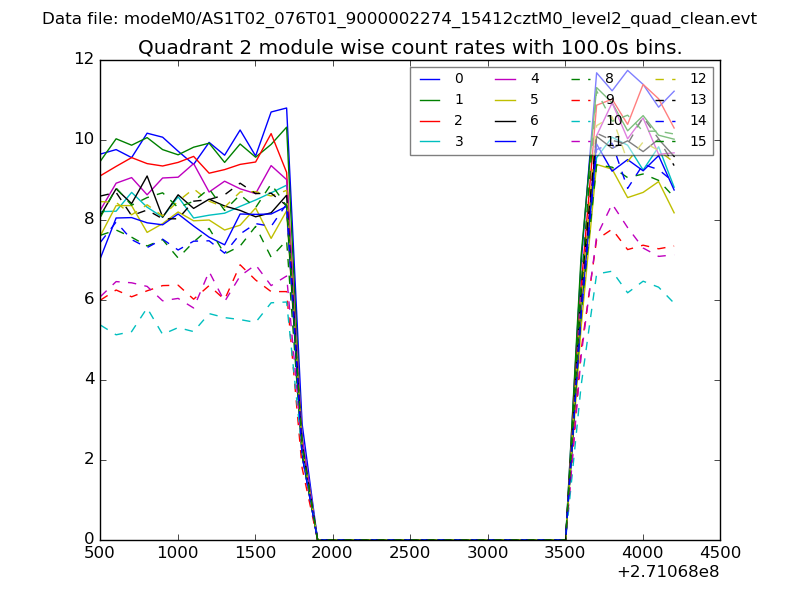 |
 |
| Module-wise count rates for Quadrant D Data is divided into 100 sec bins |
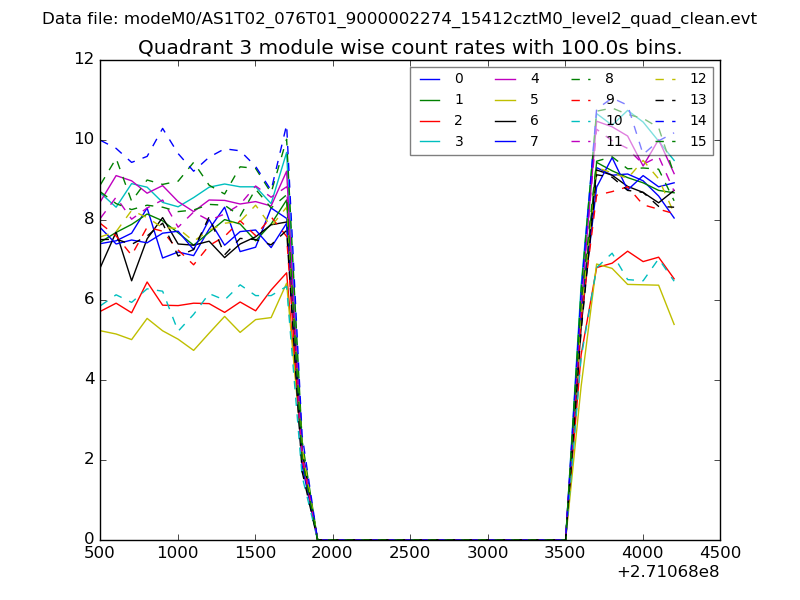 |
 |
| Parameter | Plot |
|---|---|
| CZT HV Monitor | 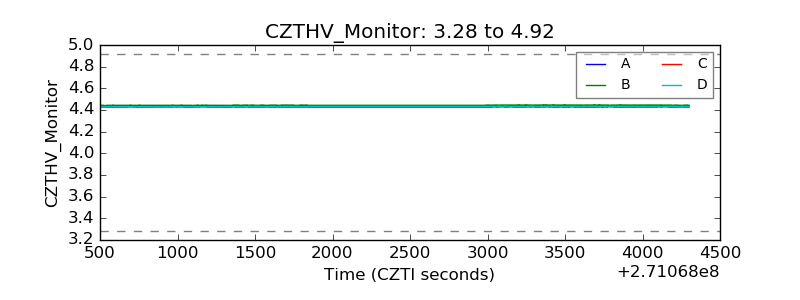 |
| D_VDD | 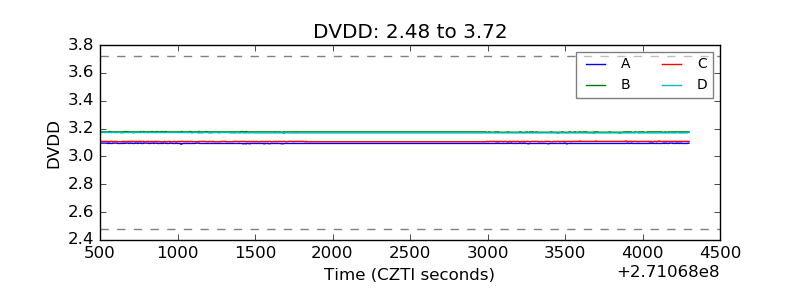 |
| Temperature 1 | 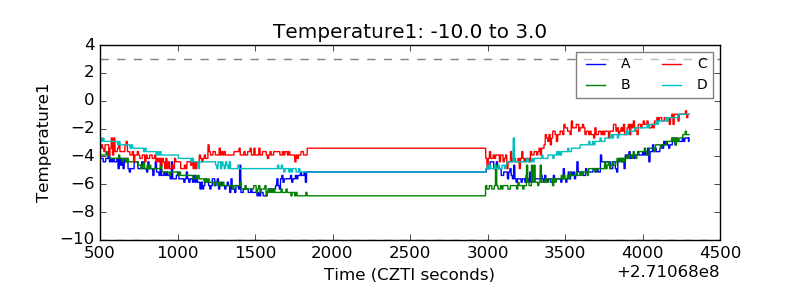 |
| Veto HV Monitor | 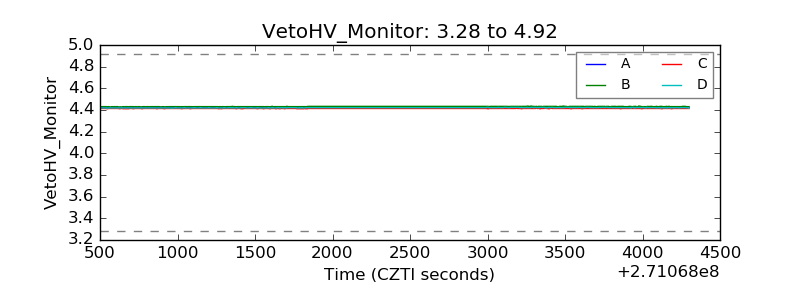 |
| Veto LLD | 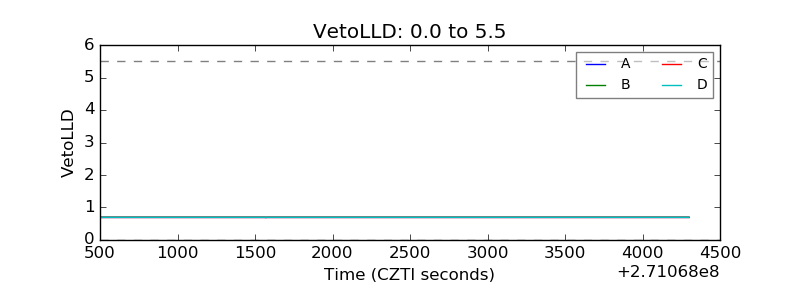 |
| Alpha Counter | 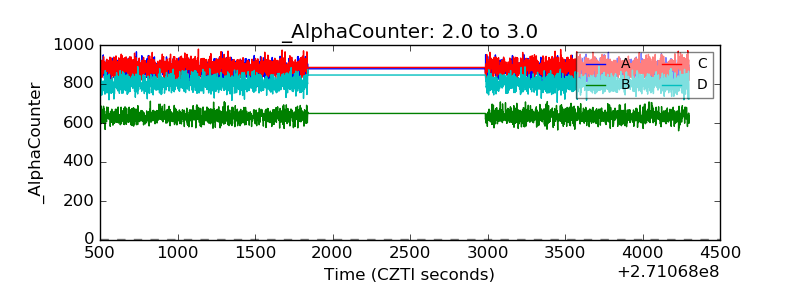 |
| _CPM_Rate | 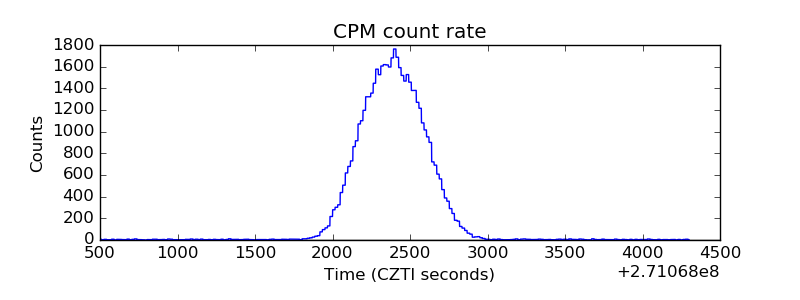 |
| CZT Counter |  |
| +2.5 Volts monitor |  |
| +5 Volts monitor | 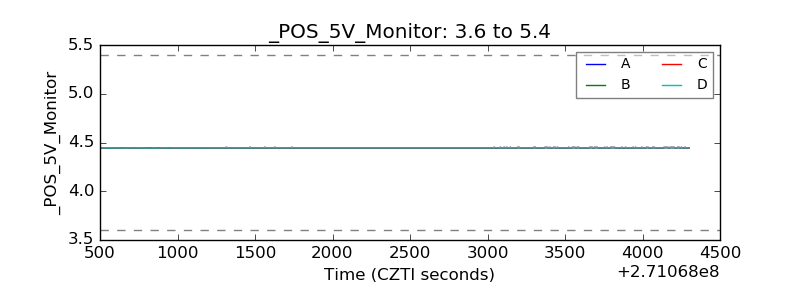 |
| _ROLL_ROT | 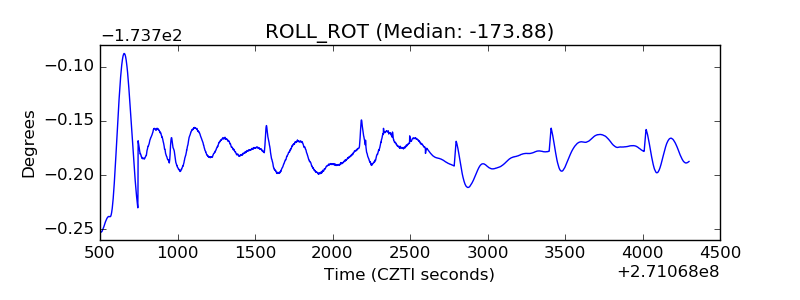 |
| _Roll_DEC | 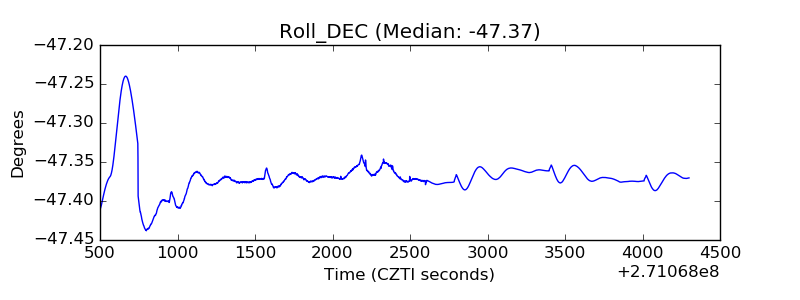 |
| _Roll_RA | 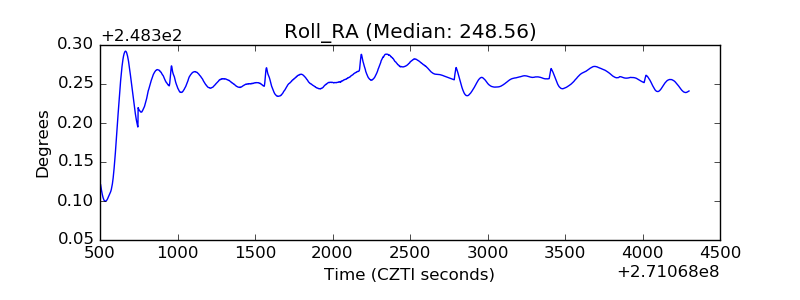 |
| Veto Counter | 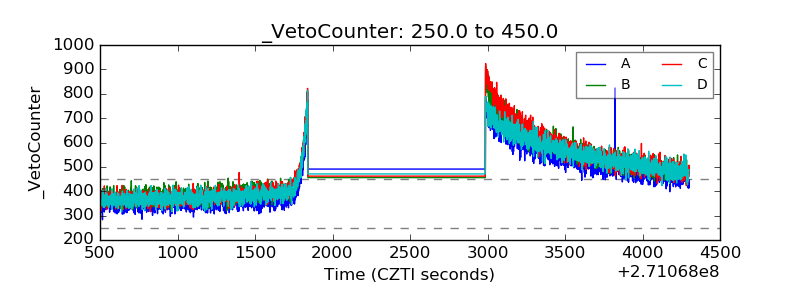 |