| Param | Original file | Final file |
|---|---|---|
| Filename | modeM0/AS1T02_076T01_9000002274_15414cztM0_level2.evt | modeM0/AS1T02_076T01_9000002274_15414cztM0_level2_quad_clean.evt |
| Size (bytes) | 485,827,200 | 118,820,160 |
| Size | 463.3 MB | 113.3 MB |
| Events in quadrant A | 3,321,557 | 810,185 |
| Events in quadrant B | 3,270,598 | 814,487 |
| Events in quadrant C | 3,824,933 | 789,379 |
| Events in quadrant D | 3,887,489 | 764,026 |
| Mode M0 | |||
|---|---|---|---|
| Quadrant | BADHDUFLAG | Total packets | Discarded packets |
| A | 0 | 13684 | 2 |
| B | 0 | 13415 | 1 |
| C | 0 | 15495 | 1 |
| D | 0 | 15706 | 1 |
| Mode SS | |||
|---|---|---|---|
| Quadrant | BADHDUFLAG | Total packets | Discarded packets |
| A | 0 | 124 | 0 |
| B | 0 | 124 | 0 |
| C | 0 | 124 | 0 |
| D | 0 | 124 | 0 |
| Mode M9 | |||
|---|---|---|---|
| Quadrant | BADHDUFLAG | Total packets | Discarded packets |
| A | 0 | 12 | 0 |
| B | 0 | 12 | 0 |
| C | 0 | 12 | 0 |
| D | 0 | 12 | 0 |
| Quadrant | Total seconds | Saturated seconds | Saturation percentage |
|---|---|---|---|
| A | 6021 | 131 | 2.175718% |
| B | 6021 | 93 | 1.544594% |
| C | 6021 | 117 | 1.943199% |
| D | 6021 | 140 | 2.325195% |
Noise dominated data is calculated using 1-second bins in cleaned event files. If a bin has >2000 counts, and if more than 50% of those come from <1% of pixels, then it is considered to be noise-dominated and hence unusable.
| Quadrant | # 1 sec bins | Bins with >0 counts | Bins with >2000 counts | High rate bins dominated by noise | Noise dominated (total time) | Noise dominated (detector-on time) | Marked lightcurve |
|---|---|---|---|---|---|---|---|
| A | 7297 | 6022 | 28 | 28 | 0.38% | 0.46% | 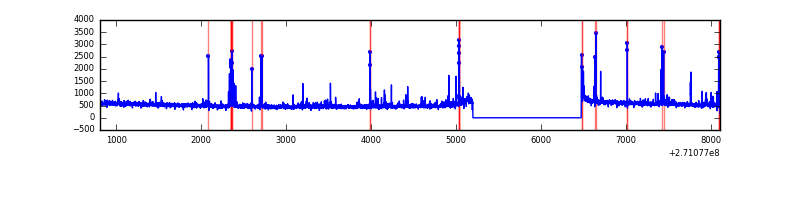 |
| B | 7297 | 6022 | 3 | 3 | 0.04% | 0.05% | 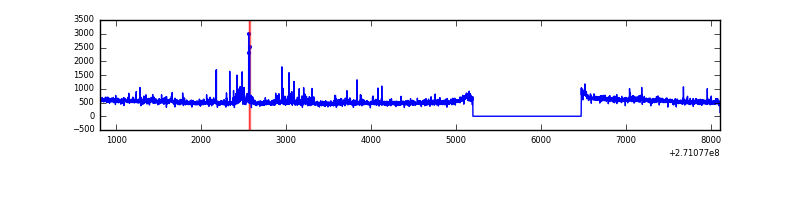 |
| C | 7297 | 6022 | 42 | 42 | 0.58% | 0.70% | 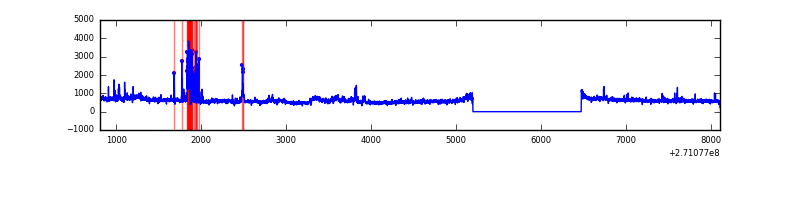 |
| D | 7297 | 6022 | 43 | 43 | 0.59% | 0.71% | 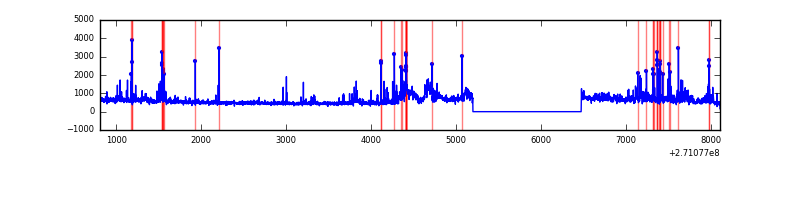 |
Top three noisy pixels from each quadrant. If the there are fewer than three noisy pixels in the level2.evt file, extra rows are filled as -1
| Pixel properties | Quadrant properties | ||||||
|---|---|---|---|---|---|---|---|
| Quadrant | DetID | PixID | Counts | Sigma | Mean | Median | Sigma |
| A | 14 | 237 | 70326 | 436.94 | 797 | 783 | 159.2 |
| A | 13 | 248 | 70010 | 434.95 | 797 | 783 | 159.2 |
| A | 14 | 238 | 65892 | 409.08 | 797 | 783 | 159.2 |
| B | 7 | 220 | 40004 | 269.12 | 786 | 772 | 145.8 |
| B | 0 | 219 | 23000 | 152.48 | 786 | 772 | 145.8 |
| B | 0 | 189 | 21366 | 141.27 | 786 | 772 | 145.8 |
| C | 3 | 233 | 616748 | 3557.98 | 755 | 757 | 173.1 |
| C | 3 | 9 | 142594 | 819.26 | 755 | 757 | 173.1 |
| C | 7 | 247 | 105649 | 605.86 | 755 | 757 | 173.1 |
| D | 13 | 122 | 650465 | 3510.62 | 767 | 745 | 185.1 |
| D | 2 | 33 | 186145 | 1001.77 | 767 | 745 | 185.1 |
| D | 2 | 120 | 27905 | 146.75 | 767 | 745 | 185.1 |
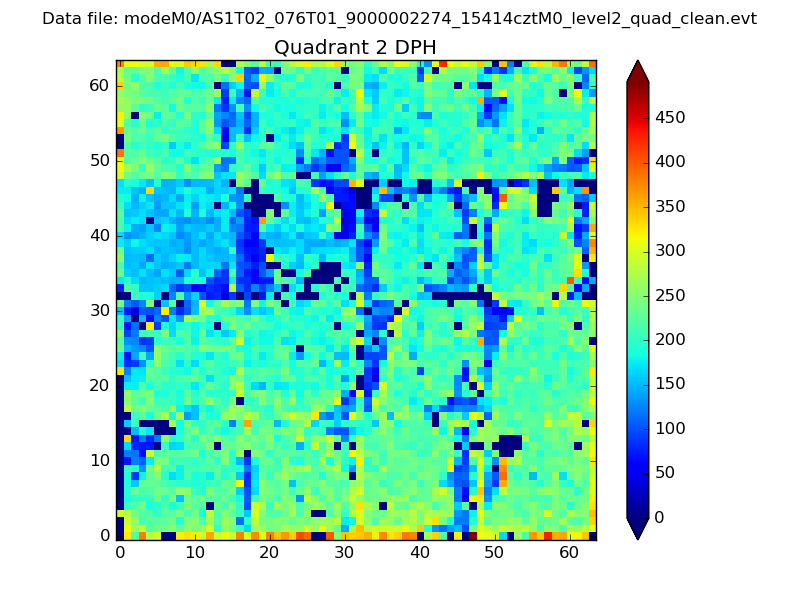
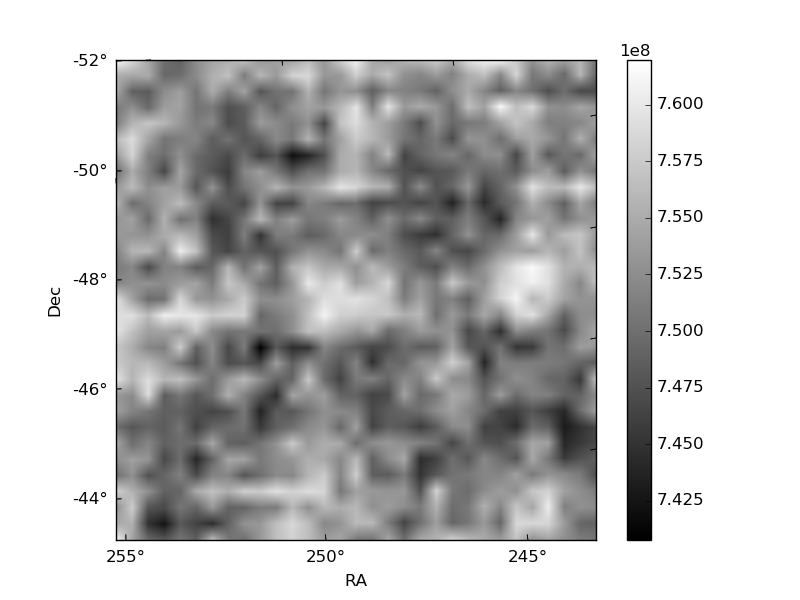
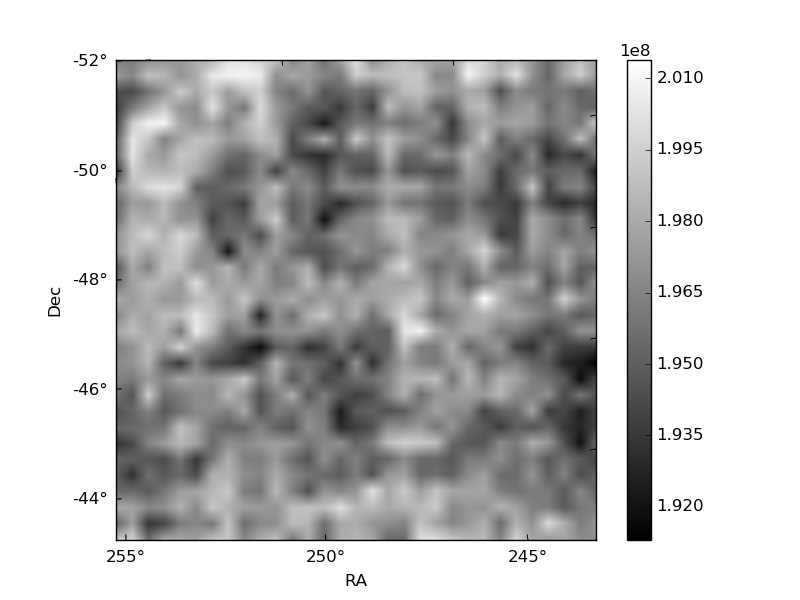
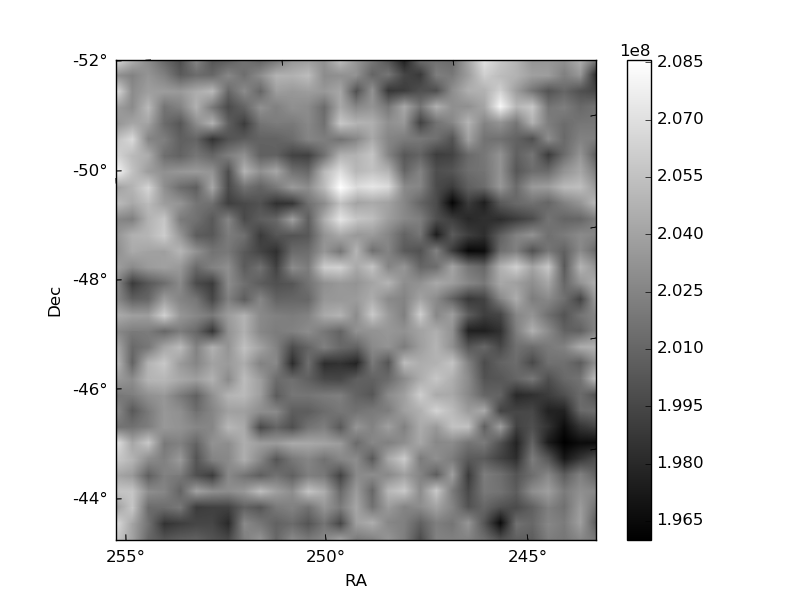
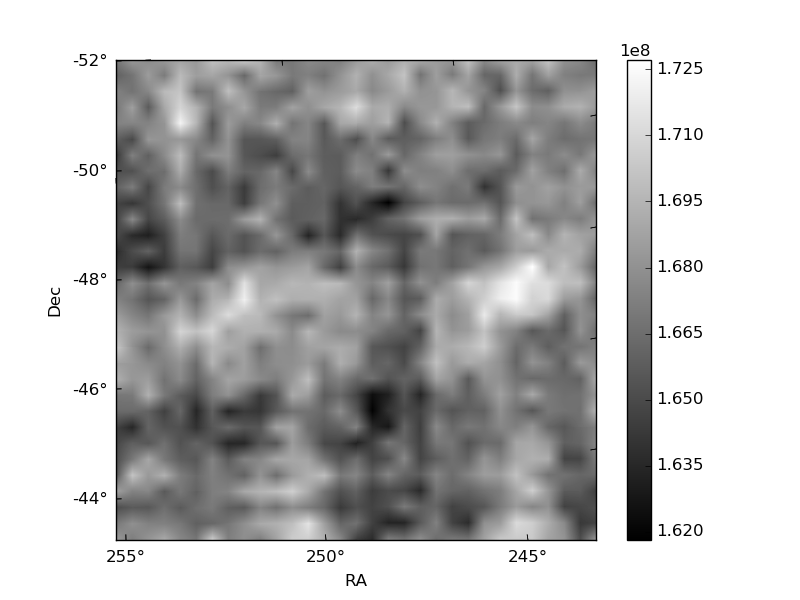
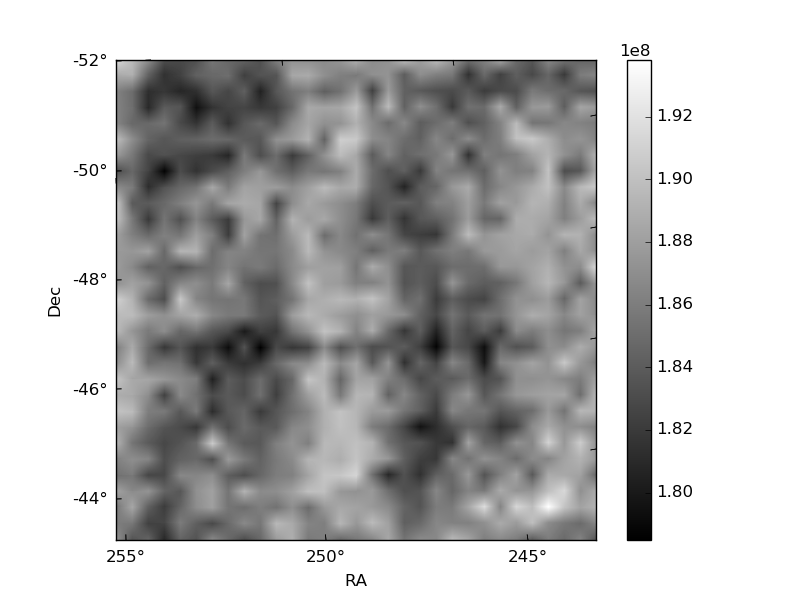
Histogram calculated using DETX and DETY for each event in the final _common_clean file
| Quadrant A | 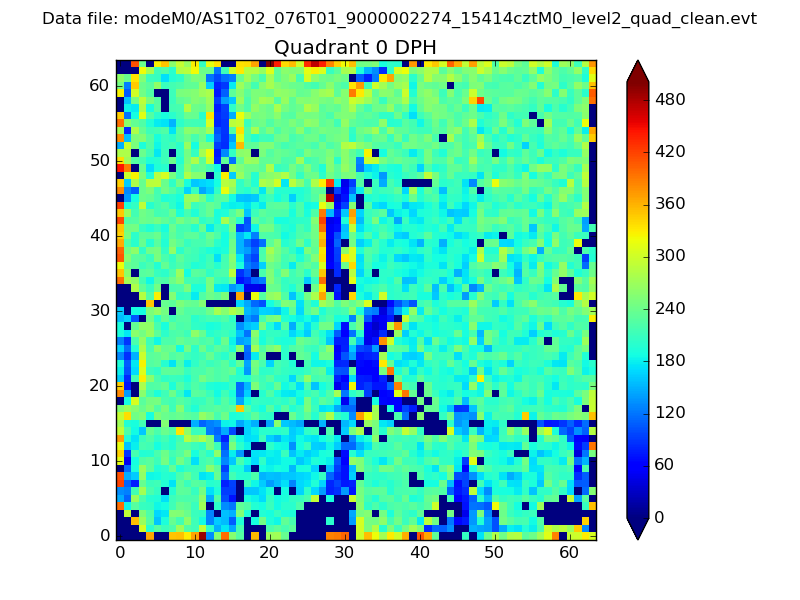 |
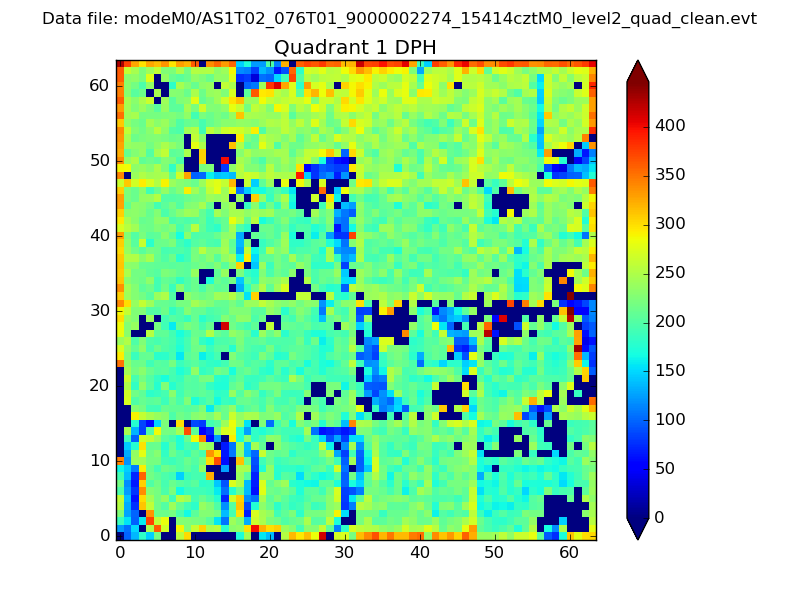 |
Quadrant B |
|---|---|---|---|
| Quadrant D | 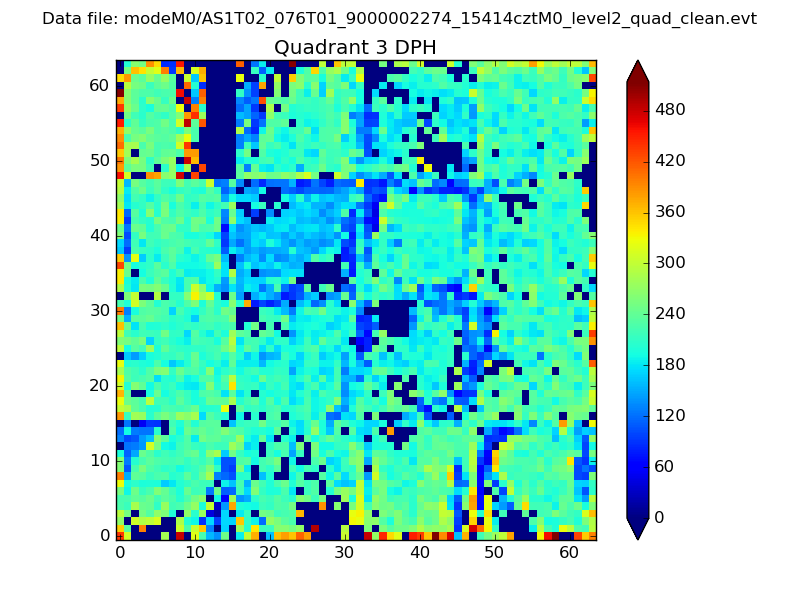 |
 |
Quadrant C |
| Plot type | Count rate plots | Images |
|---|---|---|
| Comparison with Poisson distribution Blue bars denote a histogram of data divided into 1 sec bins. Red curve is a Poisson curve with rate = median count rate of data. |
 |
 |
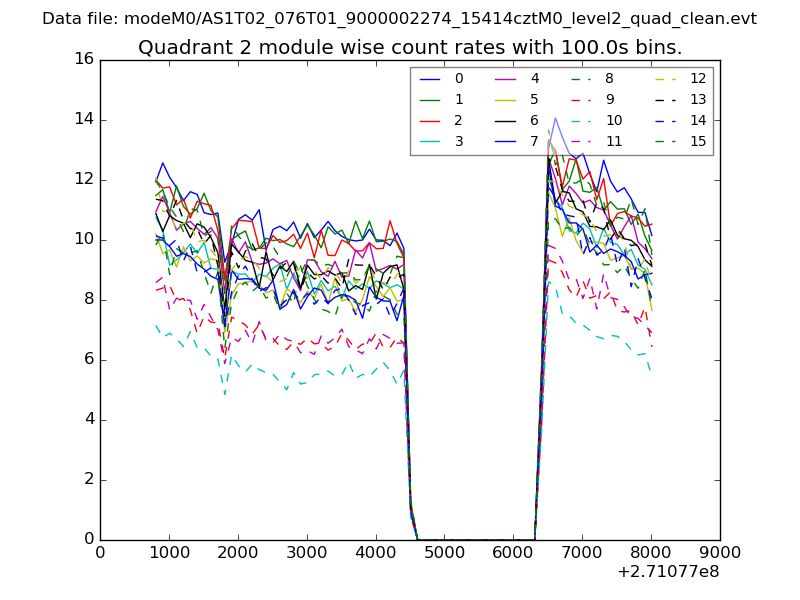
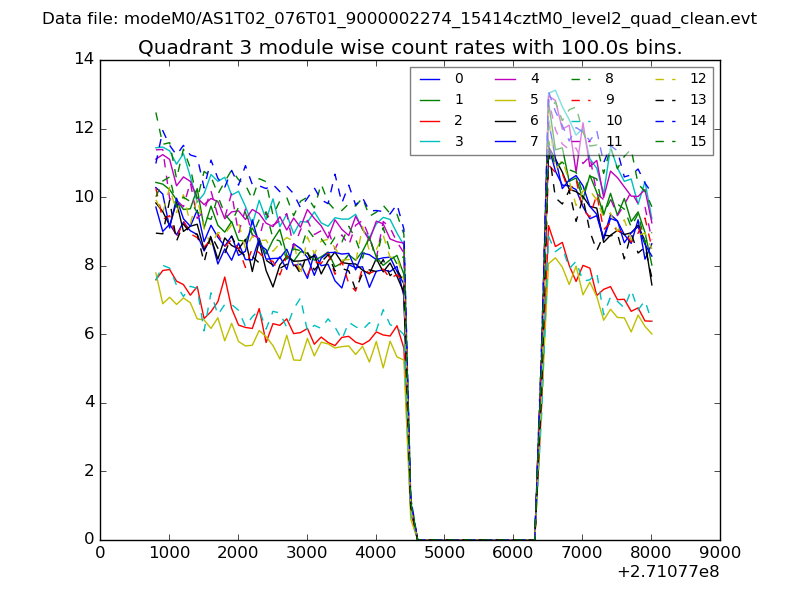
| Quadrant-wise count rates Data is divided into 100 sec bins |
 |
|
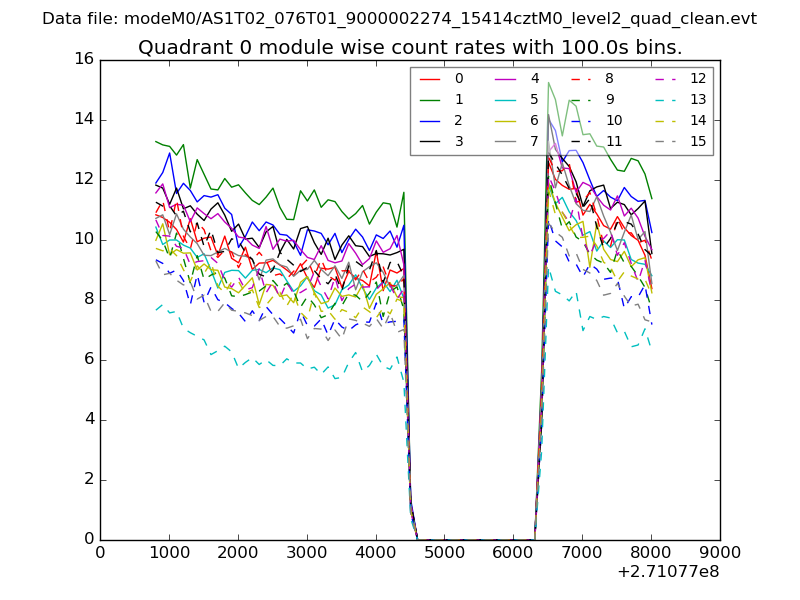
| Module-wise count rates for Quadrant A Data is divided into 100 sec bins |
 |
 |
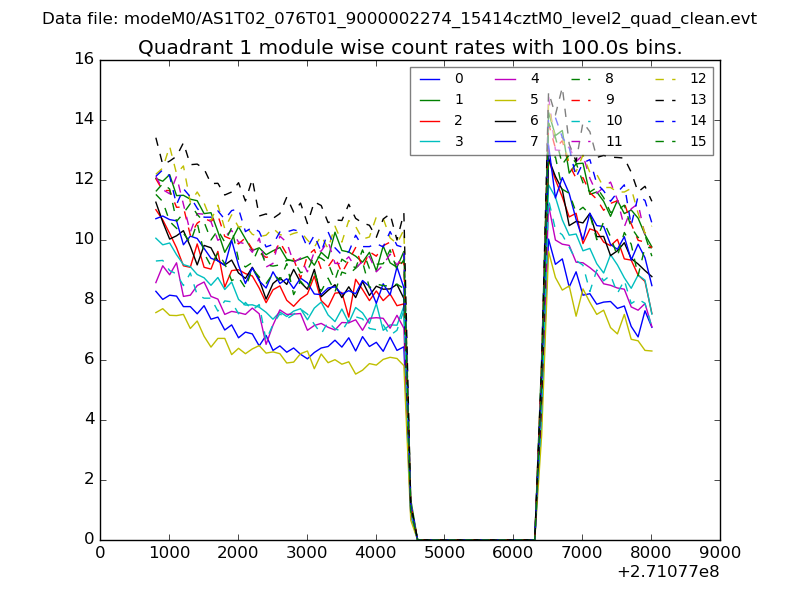
| Module-wise count rates for Quadrant B Data is divided into 100 sec bins |
 |
 |
| Module-wise count rates for Quadrant C Data is divided into 100 sec bins |
 |
 |
| Module-wise count rates for Quadrant D Data is divided into 100 sec bins |
 |
 |
| Parameter | Plot |
|---|---|
| CZT HV Monitor | 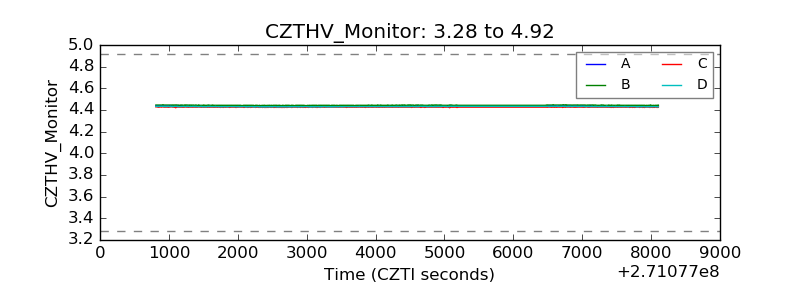 |
| D_VDD | 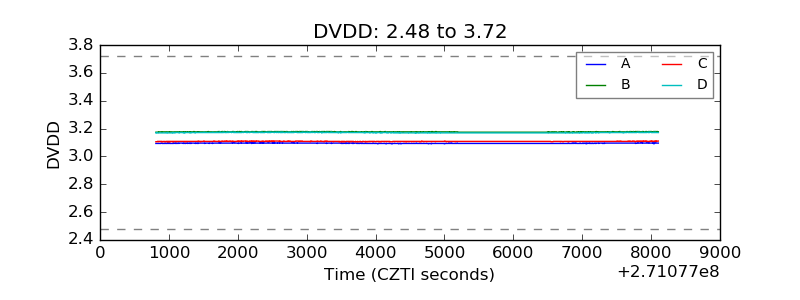 |
| Temperature 1 | 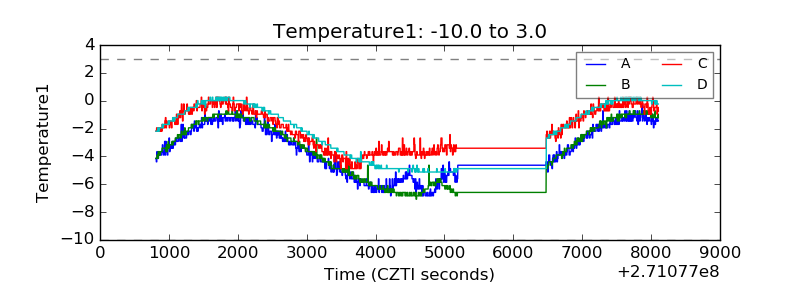 |
| Veto HV Monitor | 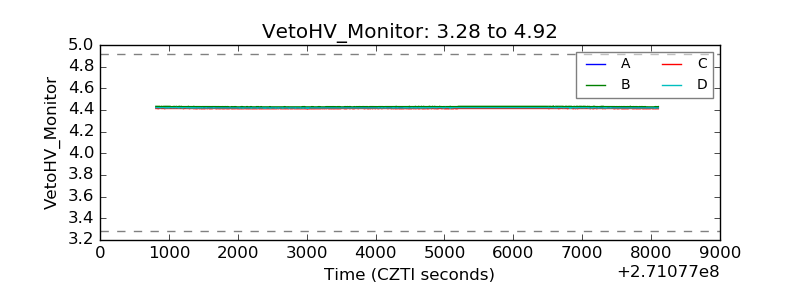 |
| Veto LLD | 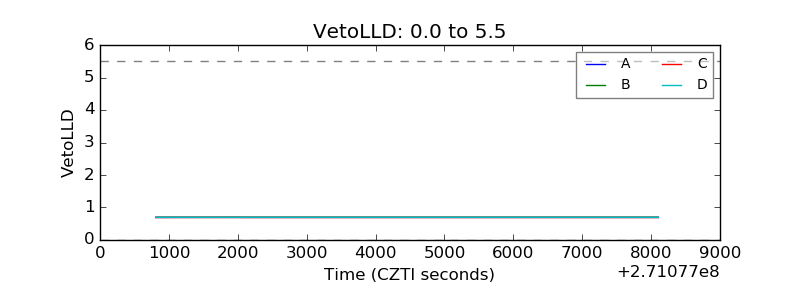 |
| Alpha Counter | 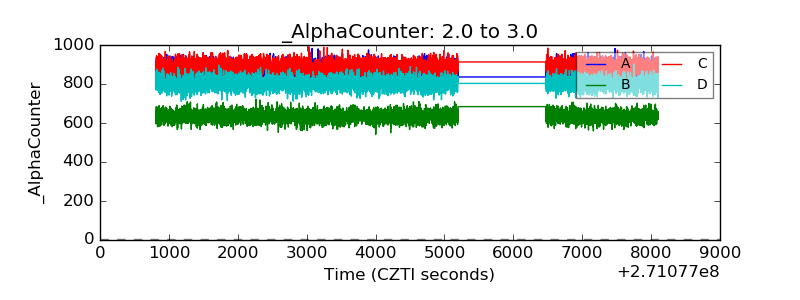 |
| _CPM_Rate |  |
| CZT Counter | 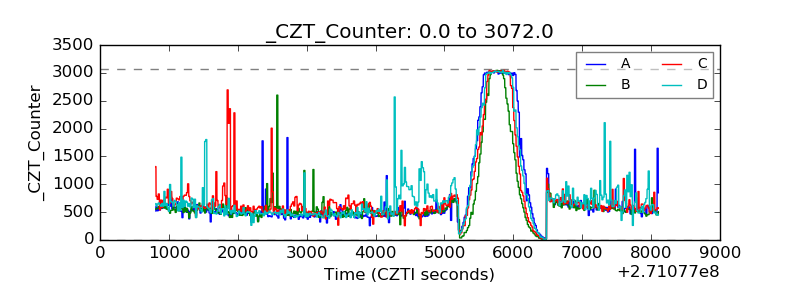 |
| +2.5 Volts monitor |  |
| +5 Volts monitor |  |
| _ROLL_ROT | 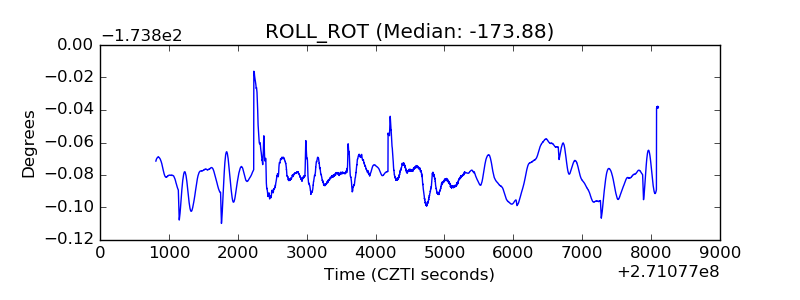 |
| _Roll_DEC | 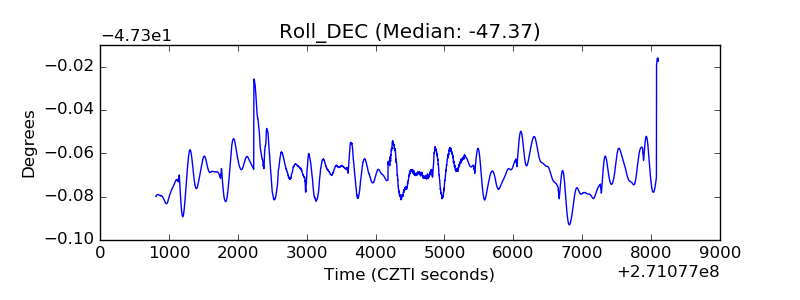 |
| _Roll_RA | 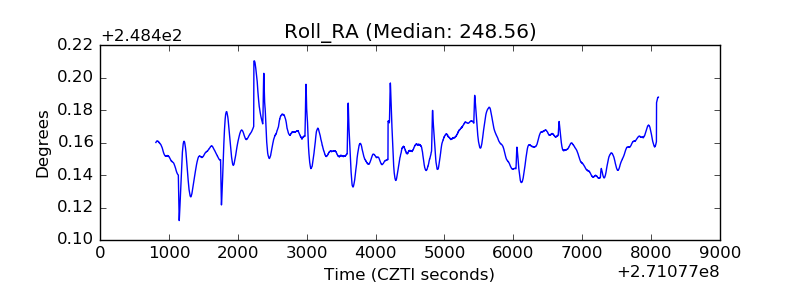 |
| Veto Counter | 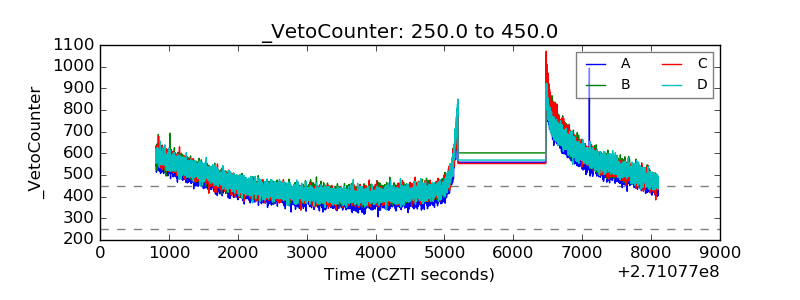 |