| Param | Original file | Final file |
|---|---|---|
| Filename | modeM0/AS1T02_076T01_9000002274_15415cztM0_level2.evt | modeM0/AS1T02_076T01_9000002274_15415cztM0_level2_quad_clean.evt |
| Size (bytes) | 479,096,640 | 99,112,320 |
| Size | 456.9 MB | 94.5 MB |
| Events in quadrant A | 2,992,991 | 673,164 |
| Events in quadrant B | 3,021,001 | 673,372 |
| Events in quadrant C | 3,380,363 | 651,116 |
| Events in quadrant D | 4,735,315 | 612,247 |
| Mode M0 | |||
|---|---|---|---|
| Quadrant | BADHDUFLAG | Total packets | Discarded packets |
| A | 0 | 12456 | 2 |
| B | 0 | 12417 | 1 |
| C | 0 | 13907 | 1 |
| D | 0 | 17867 | 1 |
| Mode SS | |||
|---|---|---|---|
| Quadrant | BADHDUFLAG | Total packets | Discarded packets |
| A | 0 | 114 | 0 |
| B | 0 | 114 | 0 |
| C | 0 | 114 | 0 |
| D | 0 | 114 | 0 |
| Mode M9 | |||
|---|---|---|---|
| Quadrant | BADHDUFLAG | Total packets | Discarded packets |
| A | 0 | 13 | 0 |
| B | 0 | 13 | 0 |
| C | 0 | 13 | 0 |
| D | 0 | 13 | 0 |
| Quadrant | Total seconds | Saturated seconds | Saturation percentage |
|---|---|---|---|
| A | 5599 | 103 | 1.839614% |
| B | 5599 | 85 | 1.518128% |
| C | 5599 | 77 | 1.375246% |
| D | 5599 | 492 | 8.787283% |
Noise dominated data is calculated using 1-second bins in cleaned event files. If a bin has >2000 counts, and if more than 50% of those come from <1% of pixels, then it is considered to be noise-dominated and hence unusable.
| Quadrant | # 1 sec bins | Bins with >0 counts | Bins with >2000 counts | High rate bins dominated by noise | Noise dominated (total time) | Noise dominated (detector-on time) | Marked lightcurve |
|---|---|---|---|---|---|---|---|
| A | 6915 | 5601 | 12 | 12 | 0.17% | 0.21% | 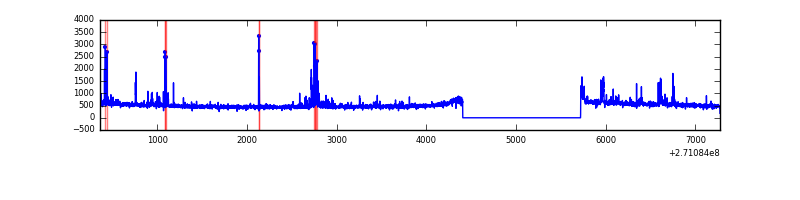 |
| B | 6915 | 5601 | 6 | 6 | 0.09% | 0.11% | 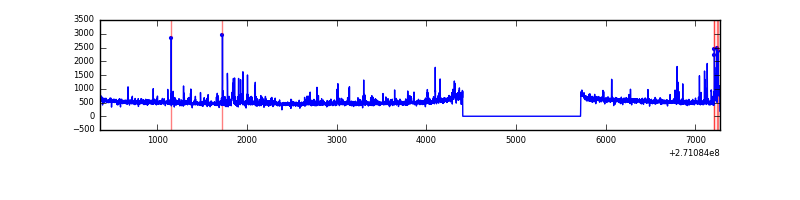 |
| C | 6915 | 5601 | 26 | 26 | 0.38% | 0.46% | 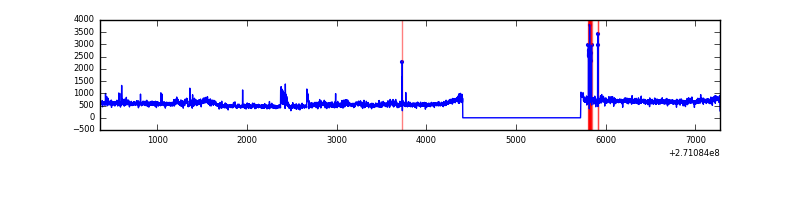 |
| D | 6915 | 5601 | 354 | 354 | 5.12% | 6.32% | 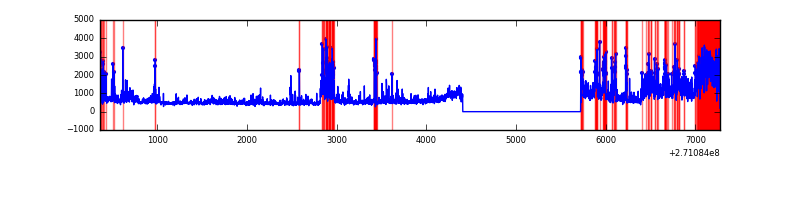 |
Top three noisy pixels from each quadrant. If the there are fewer than three noisy pixels in the level2.evt file, extra rows are filled as -1
| Pixel properties | Quadrant properties | ||||||
|---|---|---|---|---|---|---|---|
| Quadrant | DetID | PixID | Counts | Sigma | Mean | Median | Sigma |
| A | 14 | 238 | 80509 | 547.26 | 723 | 711 | 145.8 |
| A | 13 | 248 | 56814 | 384.76 | 723 | 711 | 145.8 |
| A | 14 | 237 | 32043 | 214.88 | 723 | 711 | 145.8 |
| B | 7 | 220 | 45621 | 336.49 | 713 | 698 | 133.5 |
| B | 10 | 245 | 36053 | 264.82 | 713 | 698 | 133.5 |
| B | 0 | 197 | 32453 | 237.86 | 713 | 698 | 133.5 |
| C | 3 | 233 | 581674 | 3775.45 | 679 | 683 | 153.9 |
| C | 7 | 247 | 138979 | 898.69 | 679 | 683 | 153.9 |
| C | 14 | 234 | 5383 | 30.54 | 679 | 683 | 153.9 |
| D | 13 | 122 | 1467485 | 8865.54 | 676 | 658 | 165.5 |
| D | 12 | 221 | 269563 | 1625.27 | 676 | 658 | 165.5 |
| D | 2 | 33 | 223752 | 1348.39 | 676 | 658 | 165.5 |
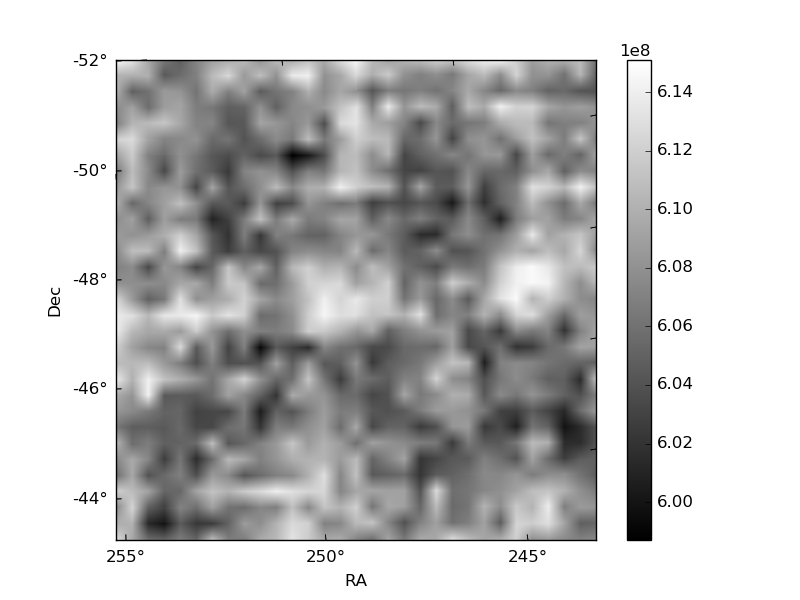
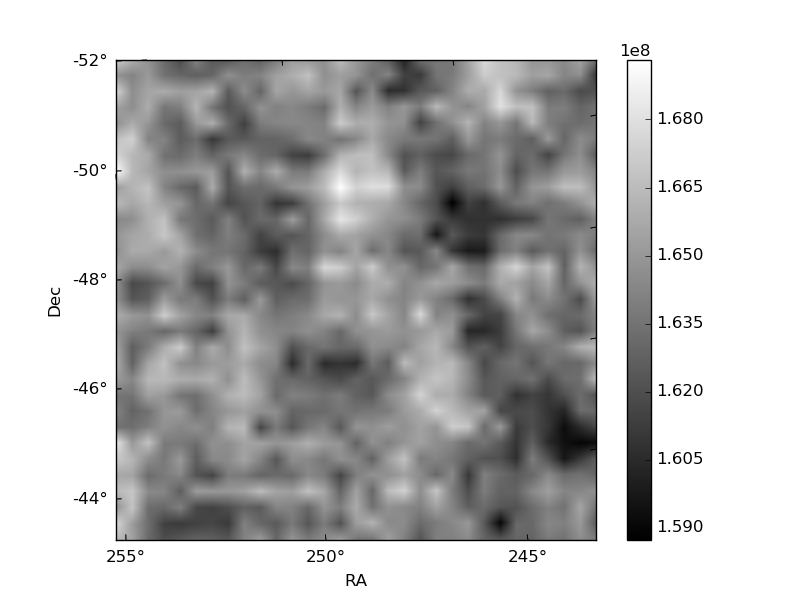
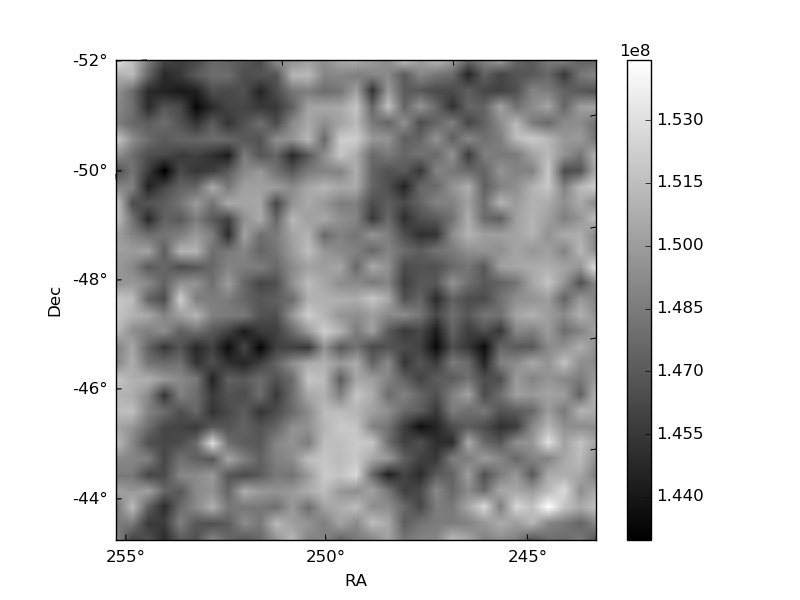
Histogram calculated using DETX and DETY for each event in the final _common_clean file
| Quadrant A | 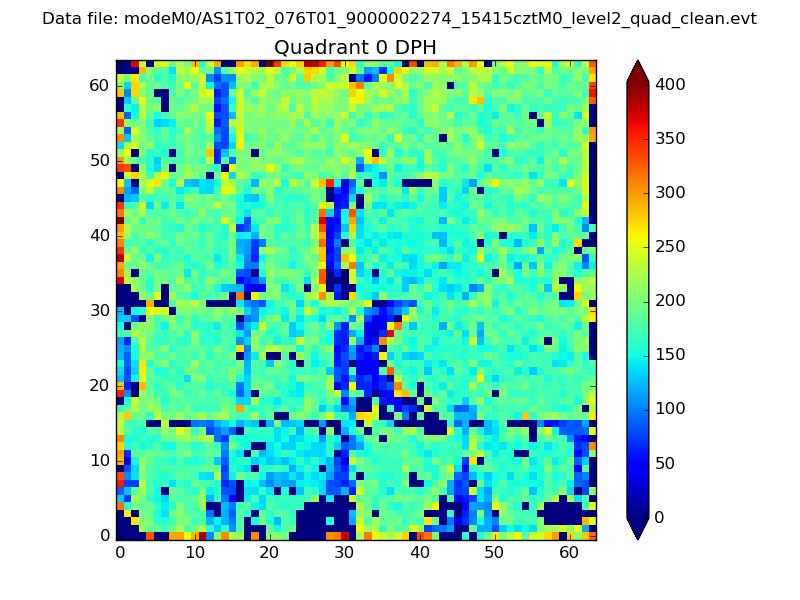 |
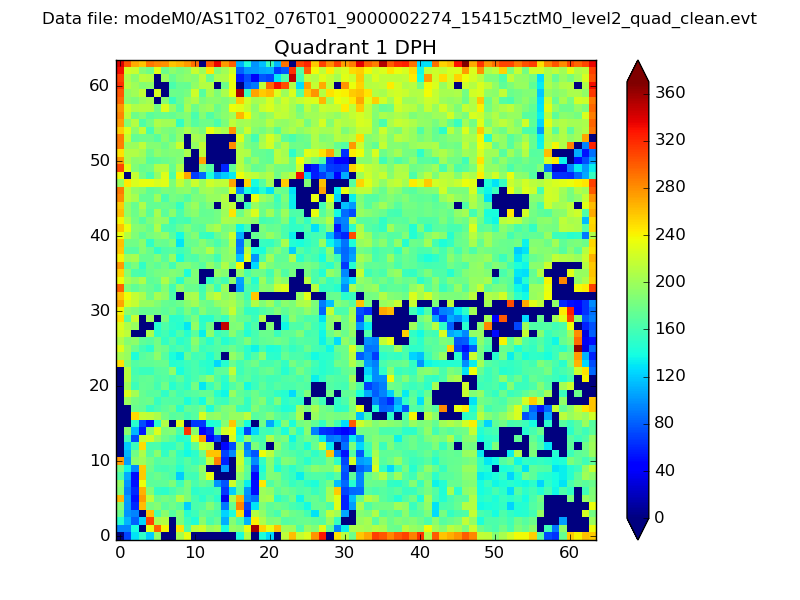 |
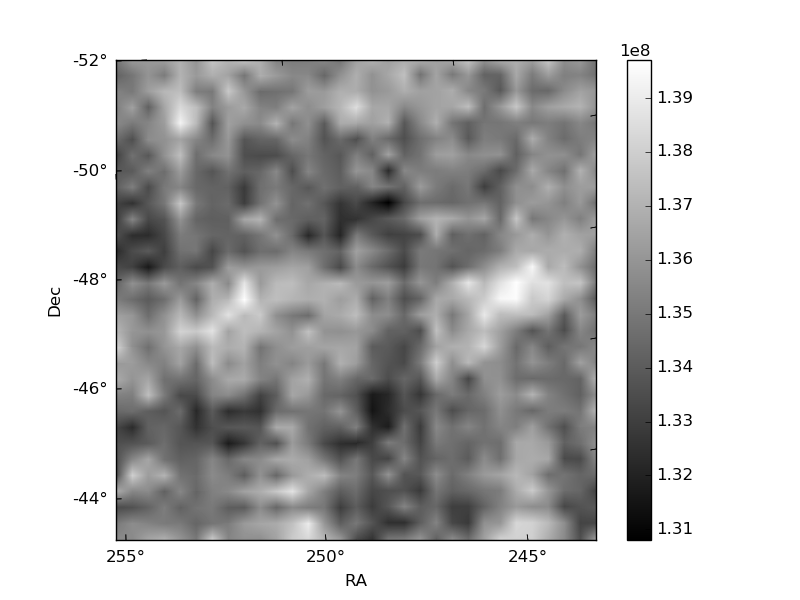
Quadrant B |
|---|---|---|---|
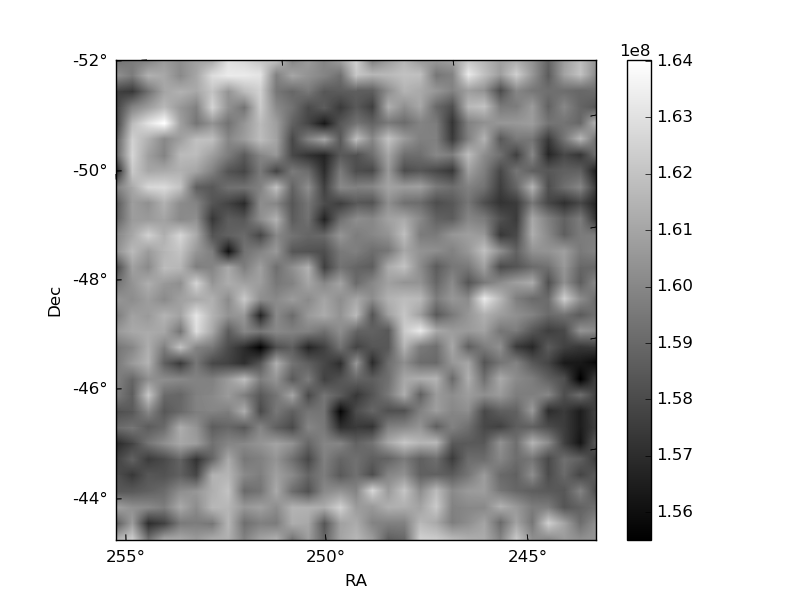
| Quadrant D | 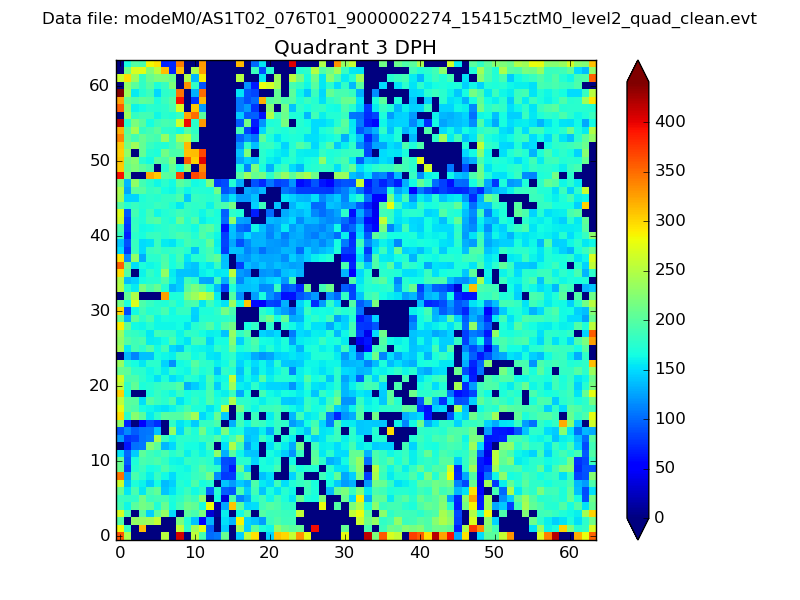 |
 |
Quadrant C |
| Plot type | Count rate plots | Images |
|---|---|---|
| Comparison with Poisson distribution Blue bars denote a histogram of data divided into 1 sec bins. Red curve is a Poisson curve with rate = median count rate of data. |
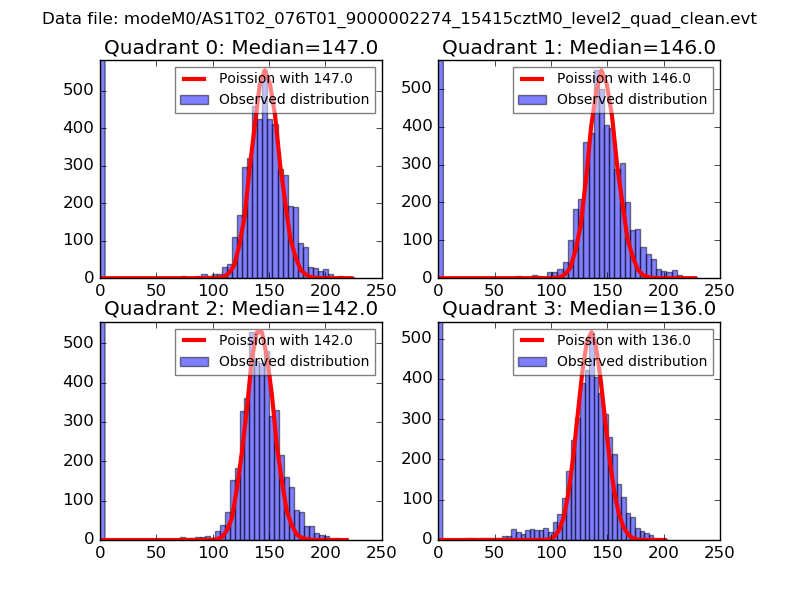 |
 |
| Quadrant-wise count rates Data is divided into 100 sec bins |
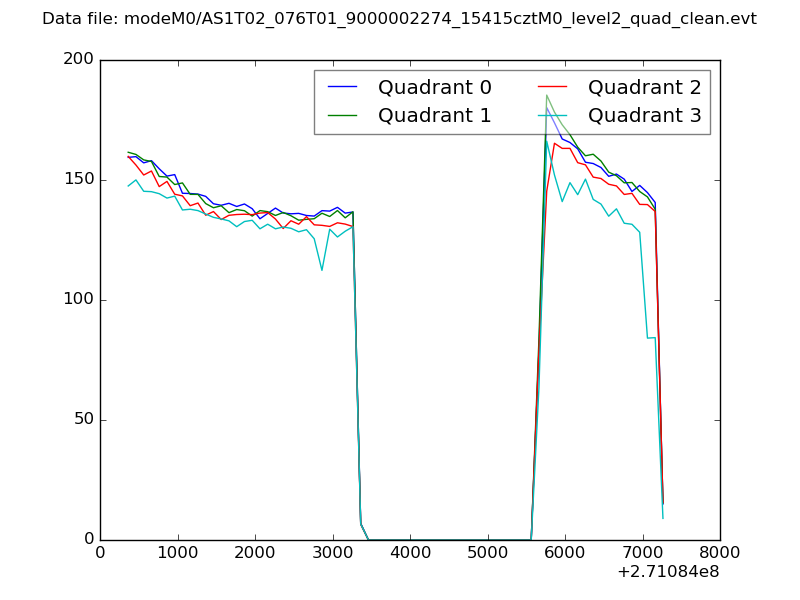 |
|
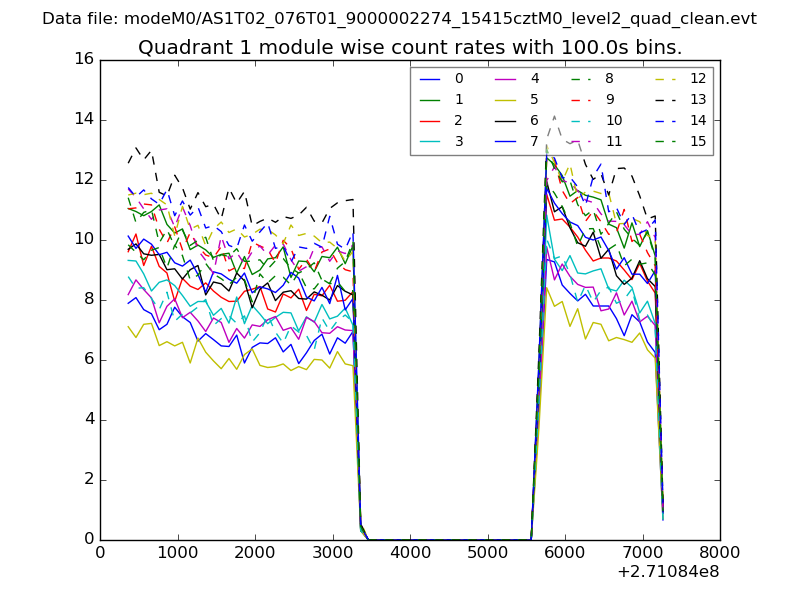
| Module-wise count rates for Quadrant A Data is divided into 100 sec bins |
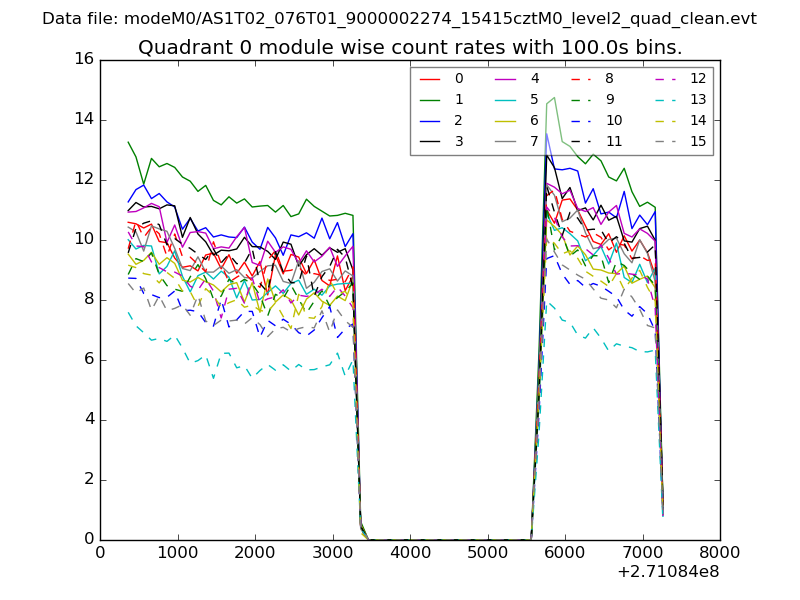 |
 |
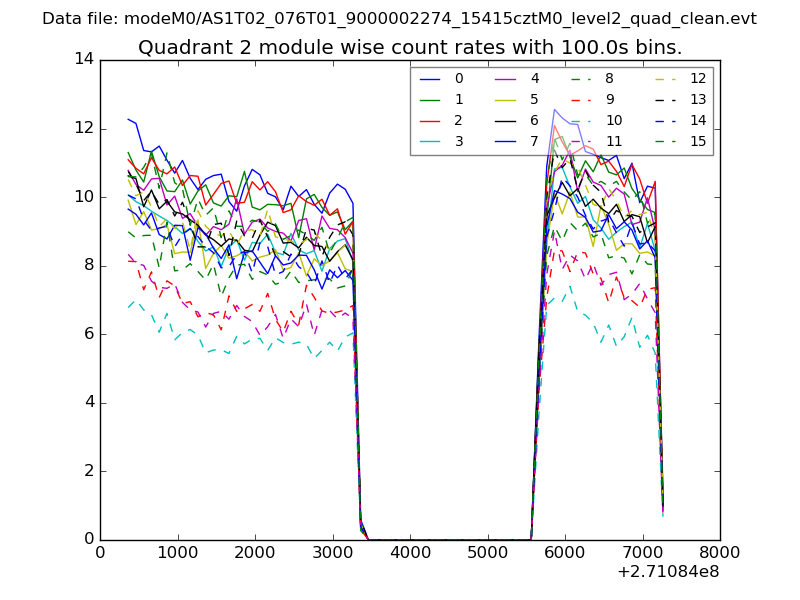
| Module-wise count rates for Quadrant B Data is divided into 100 sec bins |
 |
 |
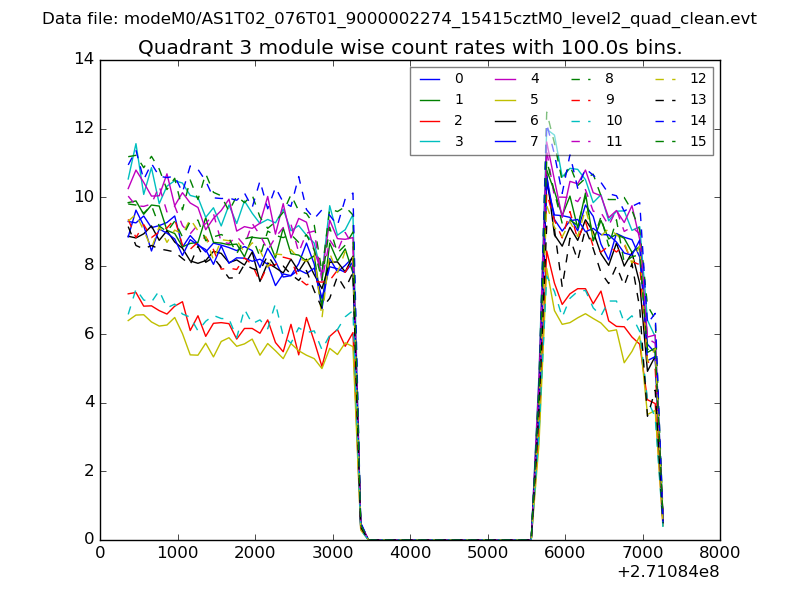
| Module-wise count rates for Quadrant C Data is divided into 100 sec bins |
 |
 |
| Module-wise count rates for Quadrant D Data is divided into 100 sec bins |
 |
 |
| Parameter | Plot |
|---|---|
| CZT HV Monitor | 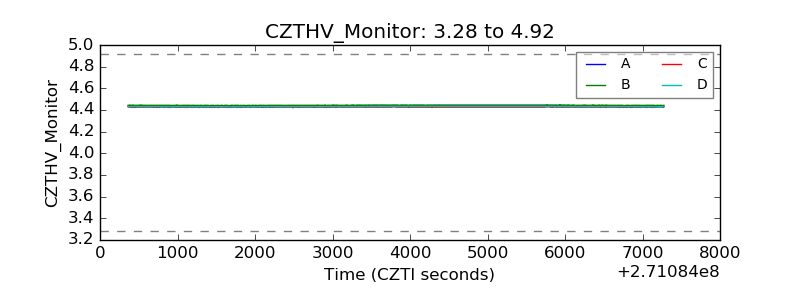 |
| D_VDD | 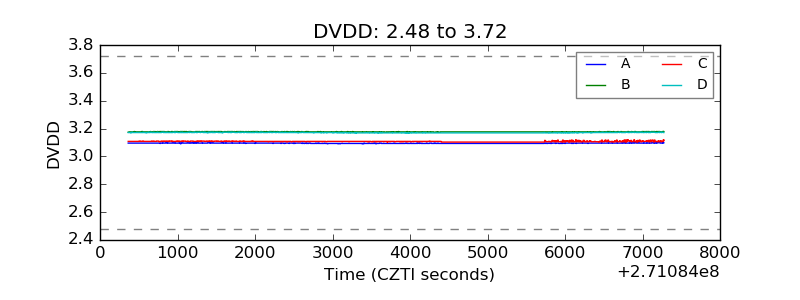 |
| Temperature 1 | 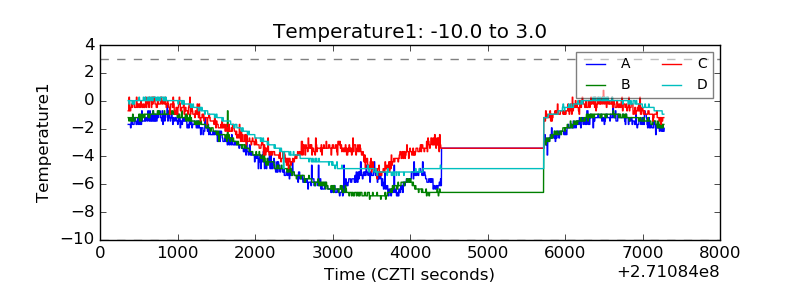 |
| Veto HV Monitor | 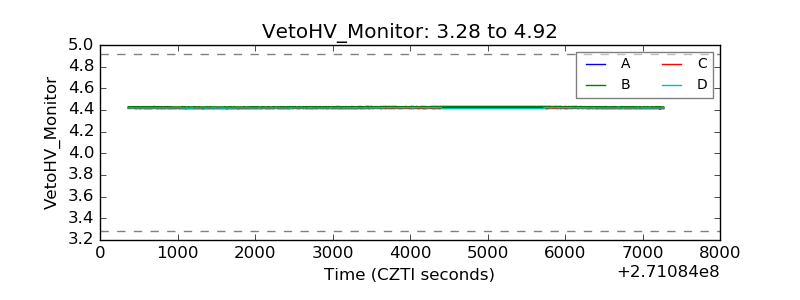 |
| Veto LLD | 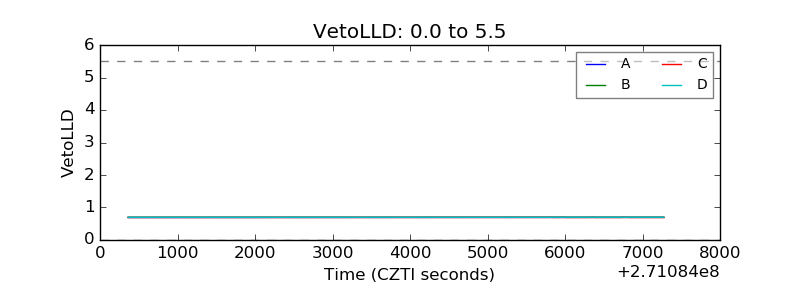 |
| Alpha Counter | 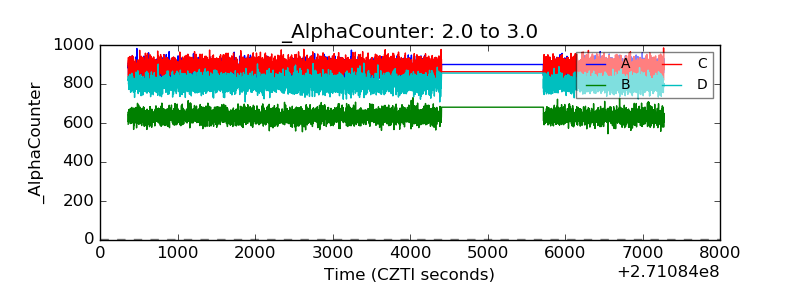 |
| _CPM_Rate | 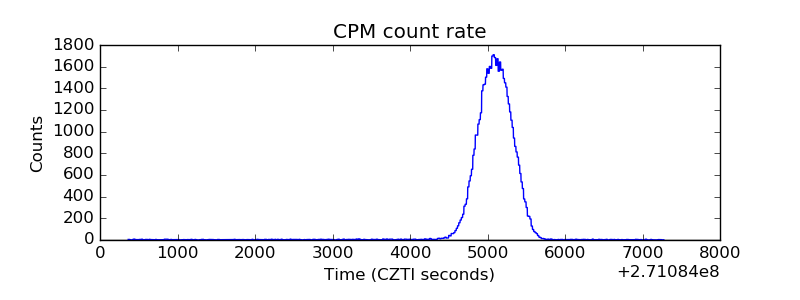 |
| CZT Counter | 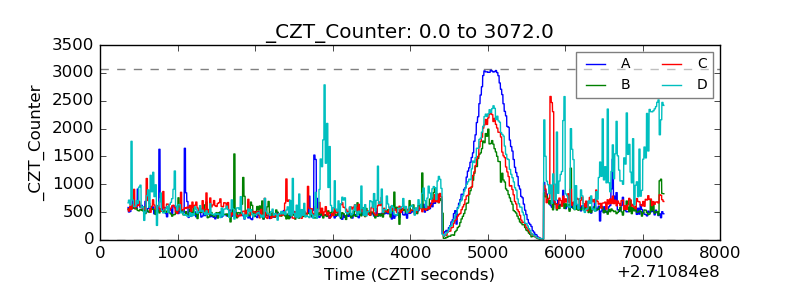 |
| +2.5 Volts monitor |  |
| +5 Volts monitor |  |
| _ROLL_ROT | 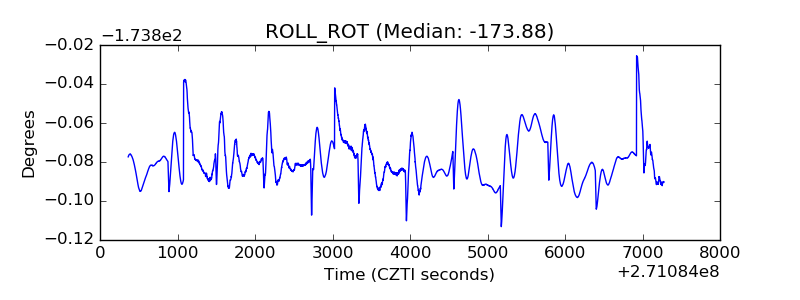 |
| _Roll_DEC | 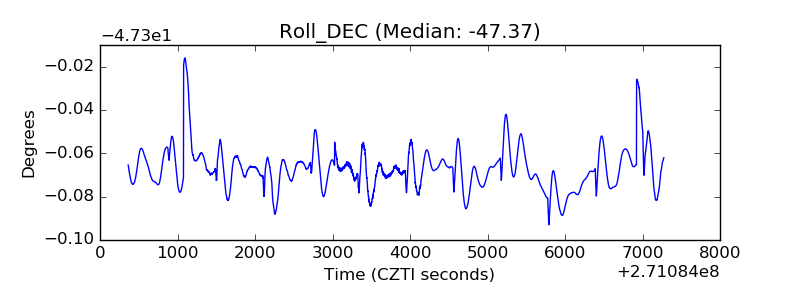 |
| _Roll_RA | 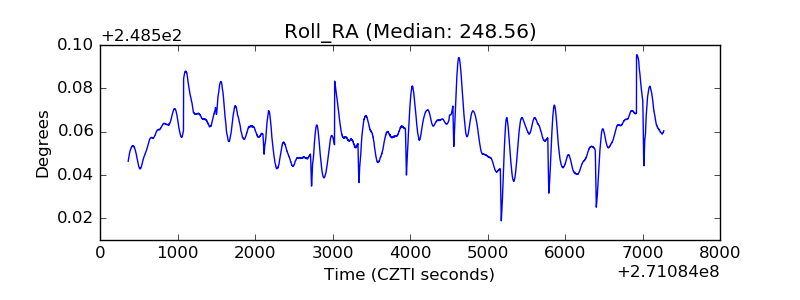 |
| Veto Counter | 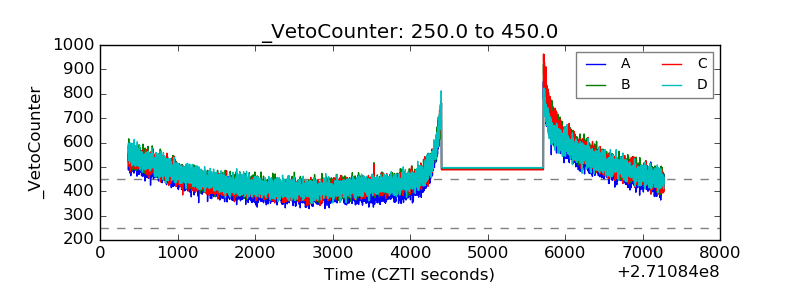 |