| Param | Original file | Final file |
|---|---|---|
| Filename | modeM0/AS1T02_076T01_9000002274_15416cztM0_level2.evt | modeM0/AS1T02_076T01_9000002274_15416cztM0_level2_quad_clean.evt |
| Size (bytes) | 581,630,400 | 94,040,640 |
| Size | 554.7 MB | 89.7 MB |
| Events in quadrant A | 3,121,418 | 634,058 |
| Events in quadrant B | 3,172,662 | 632,623 |
| Events in quadrant C | 4,670,085 | 602,247 |
| Events in quadrant D | 6,241,672 | 556,929 |
| Mode M0 | |||
|---|---|---|---|
| Quadrant | BADHDUFLAG | Total packets | Discarded packets |
| A | 0 | 13157 | 2 |
| B | 0 | 13187 | 1 |
| C | 0 | 18021 | 1 |
| D | 0 | 22809 | 1 |
| Mode SS | |||
|---|---|---|---|
| Quadrant | BADHDUFLAG | Total packets | Discarded packets |
| A | 0 | 124 | 0 |
| B | 0 | 124 | 0 |
| C | 0 | 124 | 0 |
| D | 0 | 124 | 0 |
| Mode M9 | |||
|---|---|---|---|
| Quadrant | BADHDUFLAG | Total packets | Discarded packets |
| A | 0 | 12 | 0 |
| B | 0 | 12 | 0 |
| C | 0 | 12 | 0 |
| D | 0 | 12 | 0 |
| Quadrant | Total seconds | Saturated seconds | Saturation percentage |
|---|---|---|---|
| A | 6036 | 126 | 2.087475% |
| B | 6036 | 100 | 1.656726% |
| C | 6036 | 377 | 6.245858% |
| D | 6036 | 774 | 12.823062% |
Noise dominated data is calculated using 1-second bins in cleaned event files. If a bin has >2000 counts, and if more than 50% of those come from <1% of pixels, then it is considered to be noise-dominated and hence unusable.
| Quadrant | # 1 sec bins | Bins with >0 counts | Bins with >2000 counts | High rate bins dominated by noise | Noise dominated (total time) | Noise dominated (detector-on time) | Marked lightcurve |
|---|---|---|---|---|---|---|---|
| A | 7267 | 6038 | 12 | 12 | 0.17% | 0.20% | 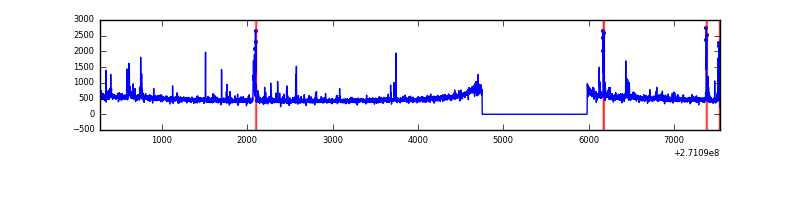 |
| B | 7267 | 6037 | 6 | 6 | 0.08% | 0.10% | 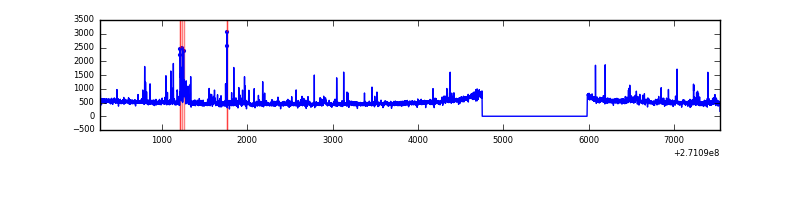 |
| C | 7267 | 6038 | 374 | 374 | 5.15% | 6.19% | 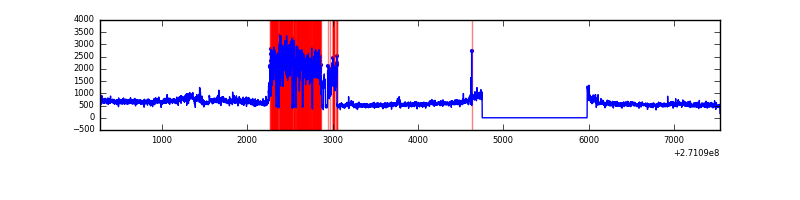 |
| D | 7267 | 6037 | 683 | 683 | 9.40% | 11.31% | 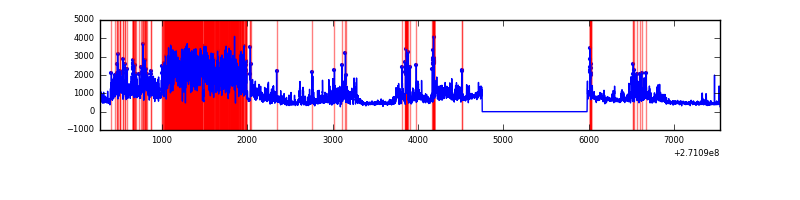 |
Top three noisy pixels from each quadrant. If the there are fewer than three noisy pixels in the level2.evt file, extra rows are filled as -1
| Pixel properties | Quadrant properties | ||||||
|---|---|---|---|---|---|---|---|
| Quadrant | DetID | PixID | Counts | Sigma | Mean | Median | Sigma |
| A | 14 | 238 | 80117 | 525.09 | 757 | 743 | 151.2 |
| A | 13 | 248 | 55020 | 359.06 | 757 | 743 | 151.2 |
| A | 14 | 237 | 39605 | 257.09 | 757 | 743 | 151.2 |
| B | 10 | 245 | 52368 | 362.57 | 753 | 738 | 142.4 |
| B | 0 | 197 | 34615 | 237.9 | 753 | 738 | 142.4 |
| B | 7 | 220 | 27180 | 185.69 | 753 | 738 | 142.4 |
| C | 3 | 233 | 1813660 | 11100.6 | 711 | 715 | 163.3 |
| C | 7 | 247 | 67659 | 409.9 | 711 | 715 | 163.3 |
| C | 8 | 128 | 7559 | 41.91 | 711 | 715 | 163.3 |
| D | 13 | 122 | 2503384 | 14714.35 | 700 | 680 | 170.1 |
| D | 5 | 222 | 610935 | 3587.92 | 700 | 680 | 170.1 |
| D | 2 | 33 | 291415 | 1709.34 | 700 | 680 | 170.1 |
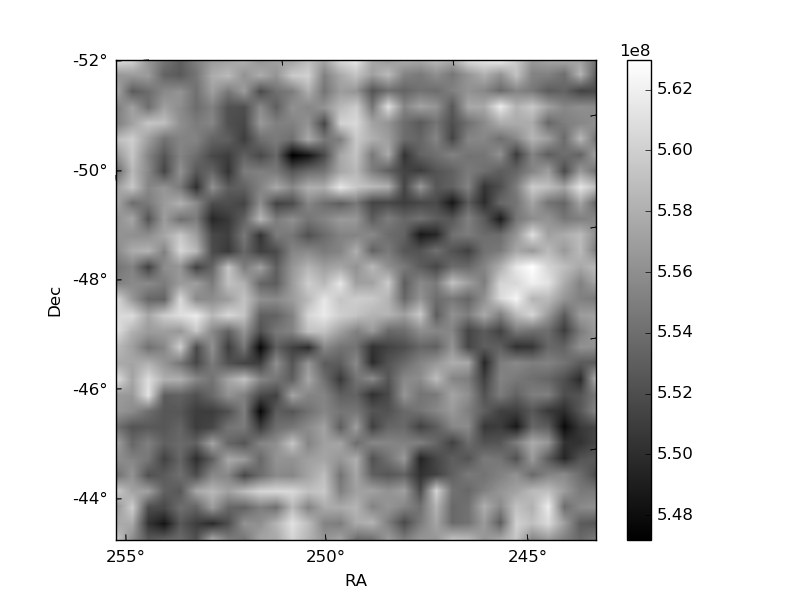
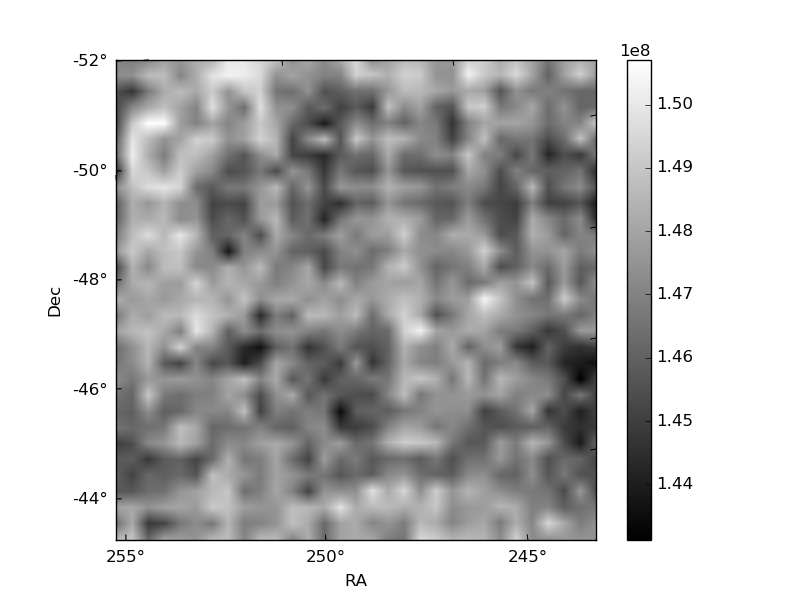
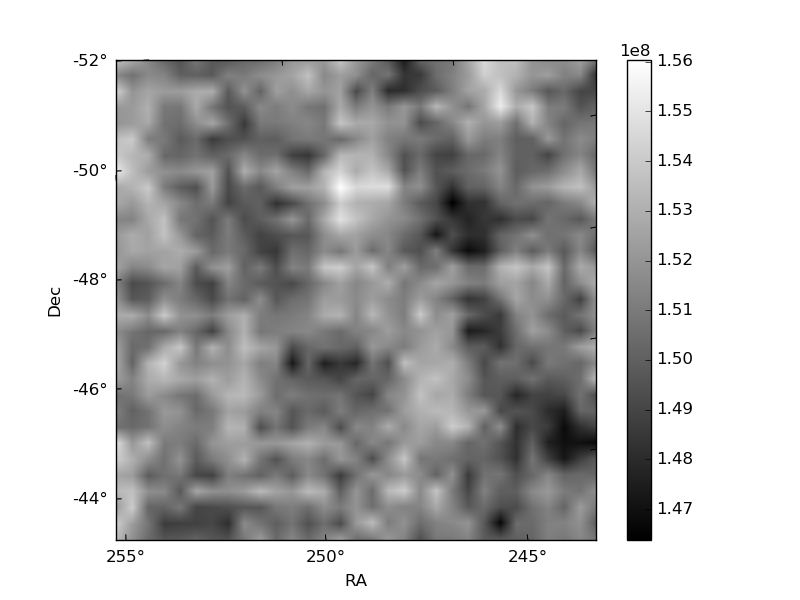
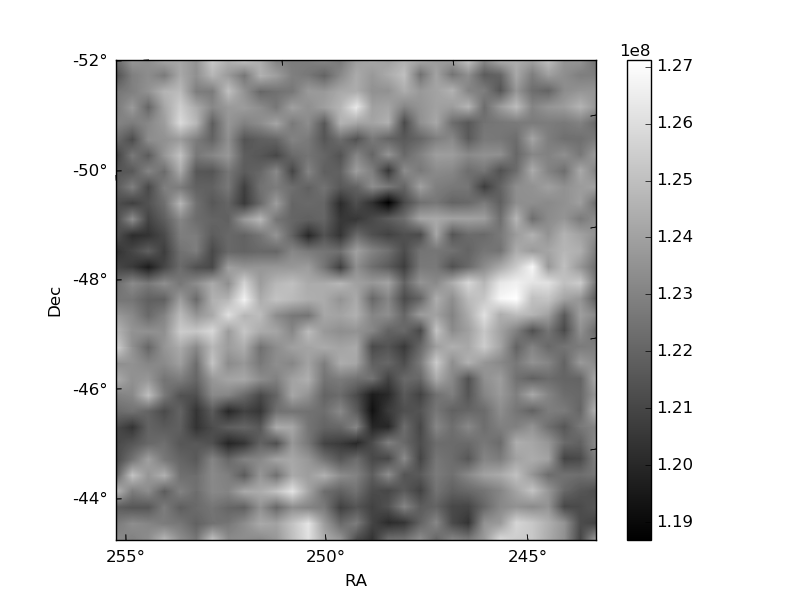
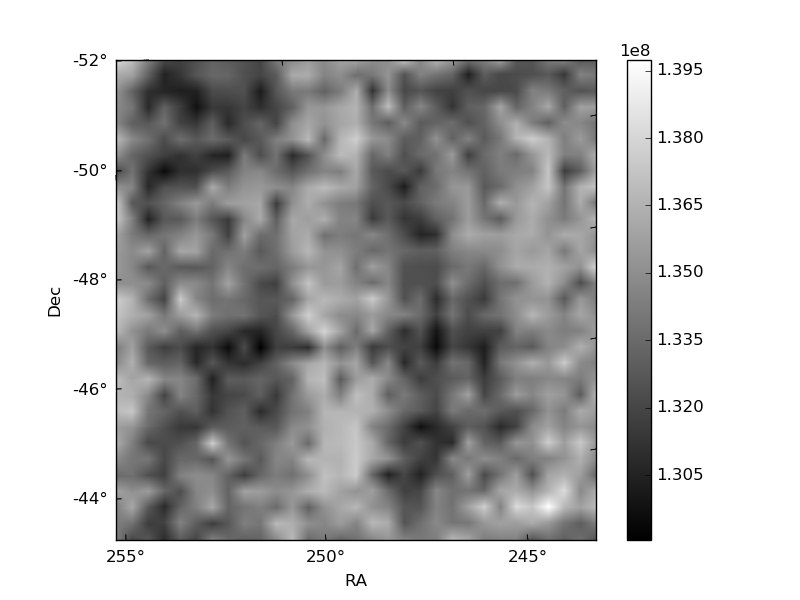
Histogram calculated using DETX and DETY for each event in the final _common_clean file
| Quadrant A | 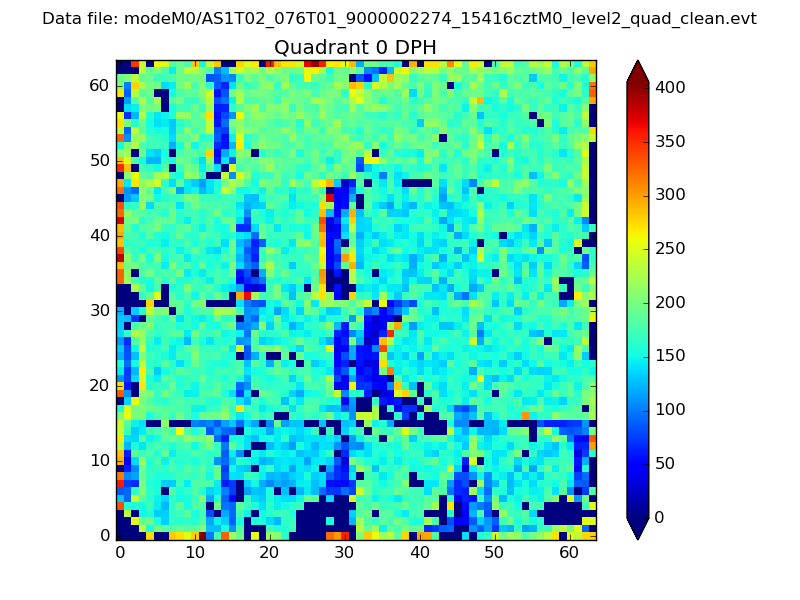 |
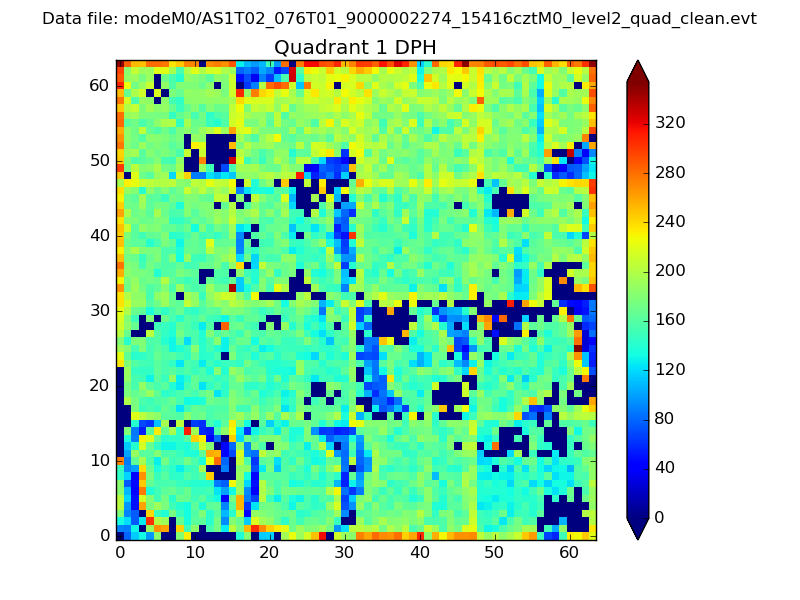 |
Quadrant B |
|---|---|---|---|
| Quadrant D | 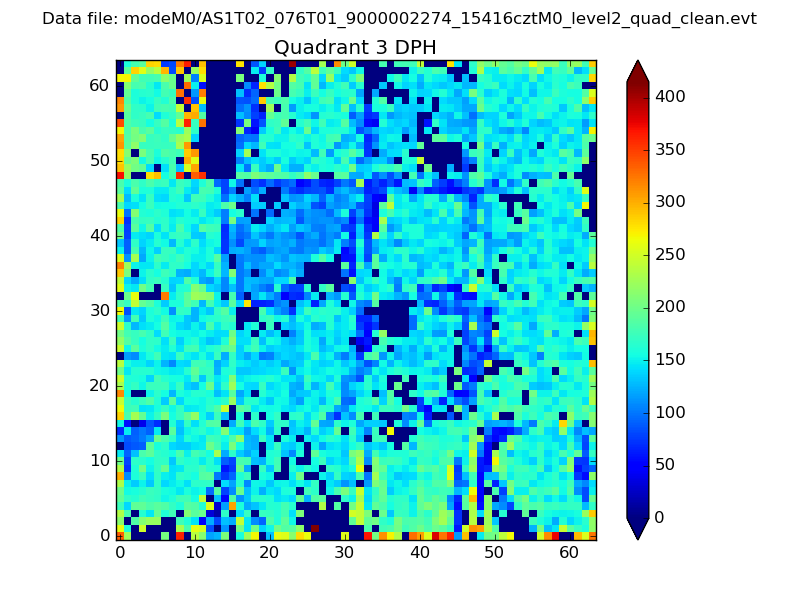 |
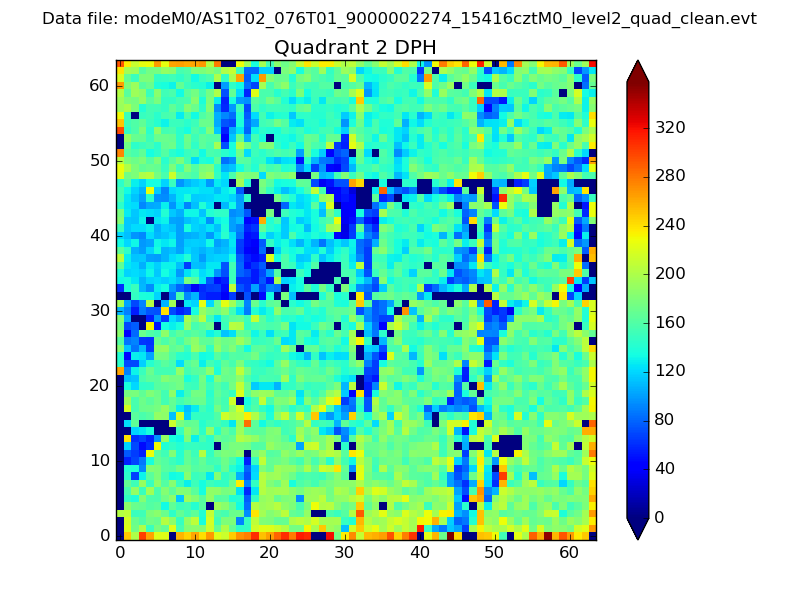 |
Quadrant C |
| Plot type | Count rate plots | Images |
|---|---|---|
| Comparison with Poisson distribution Blue bars denote a histogram of data divided into 1 sec bins. Red curve is a Poisson curve with rate = median count rate of data. |
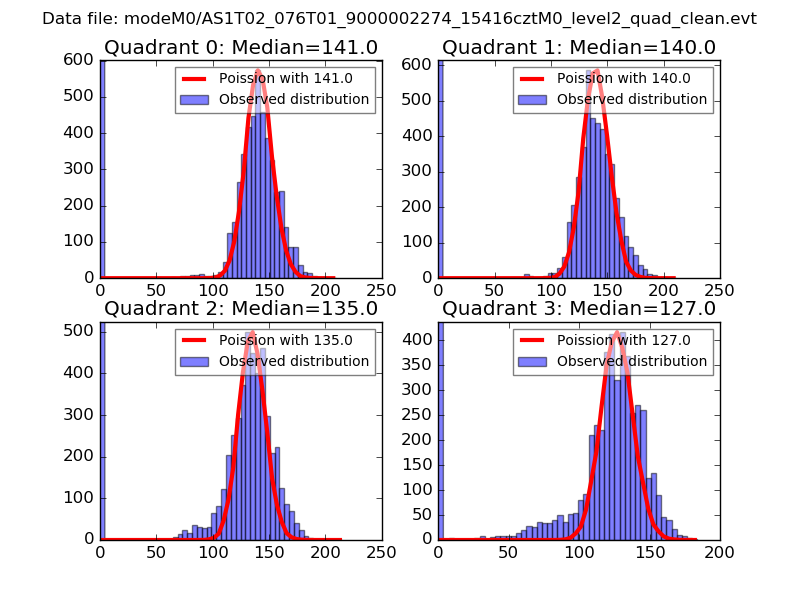 |
 |
| Quadrant-wise count rates Data is divided into 100 sec bins |
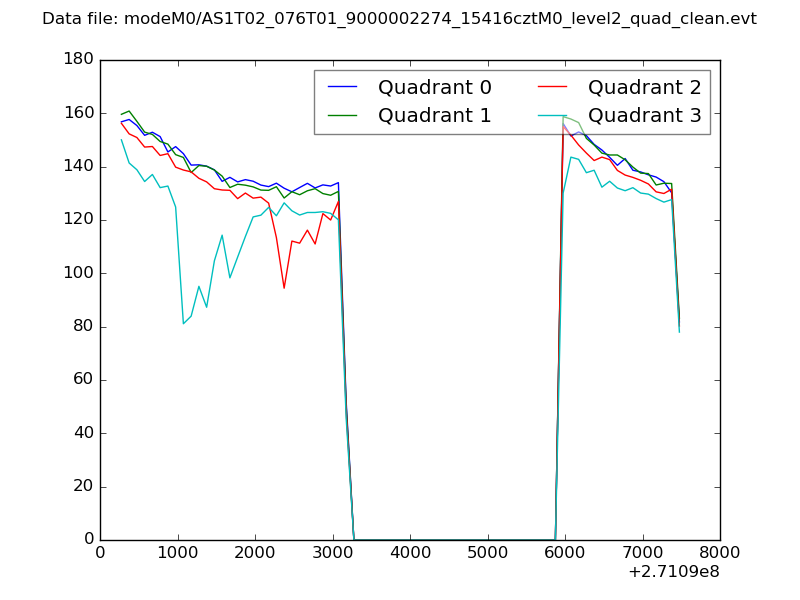 |
|
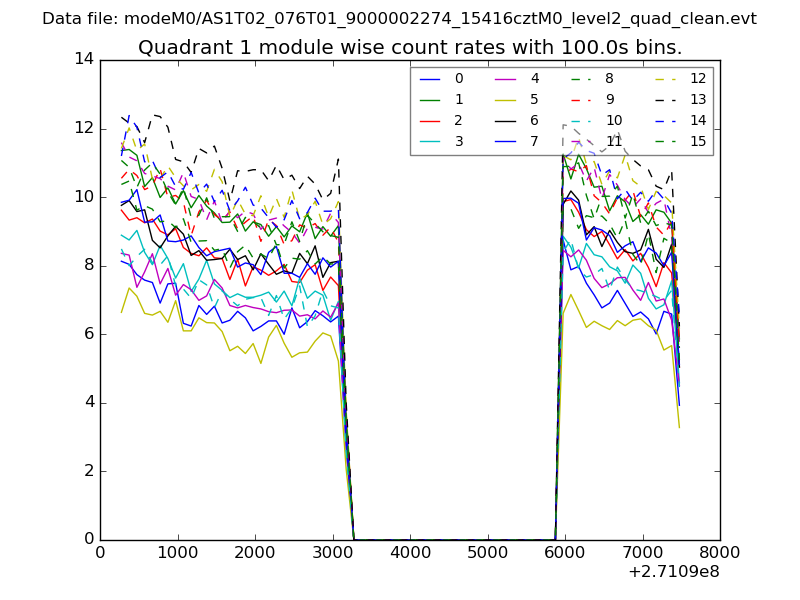
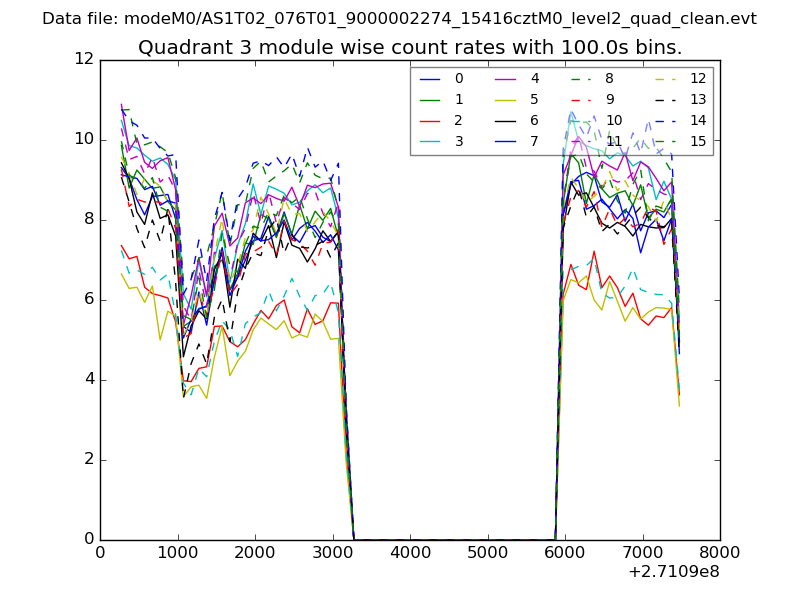
| Module-wise count rates for Quadrant A Data is divided into 100 sec bins |
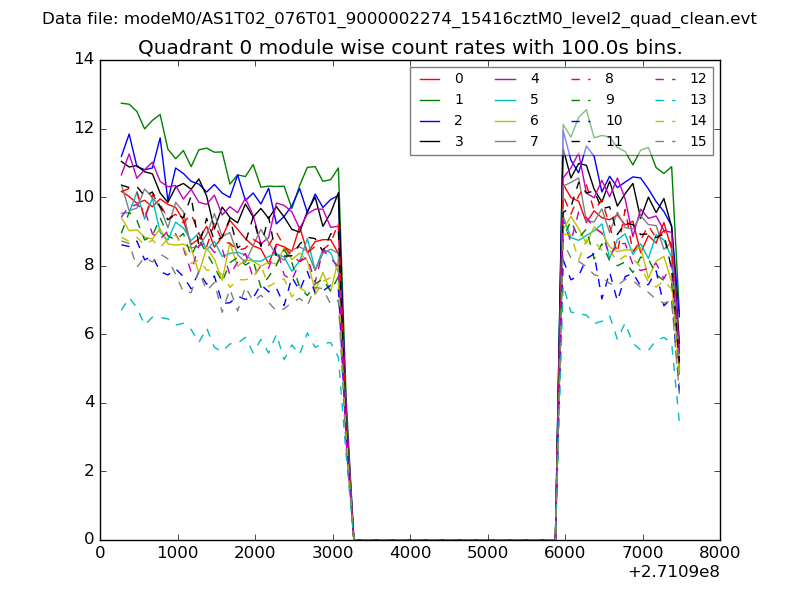 |
 |
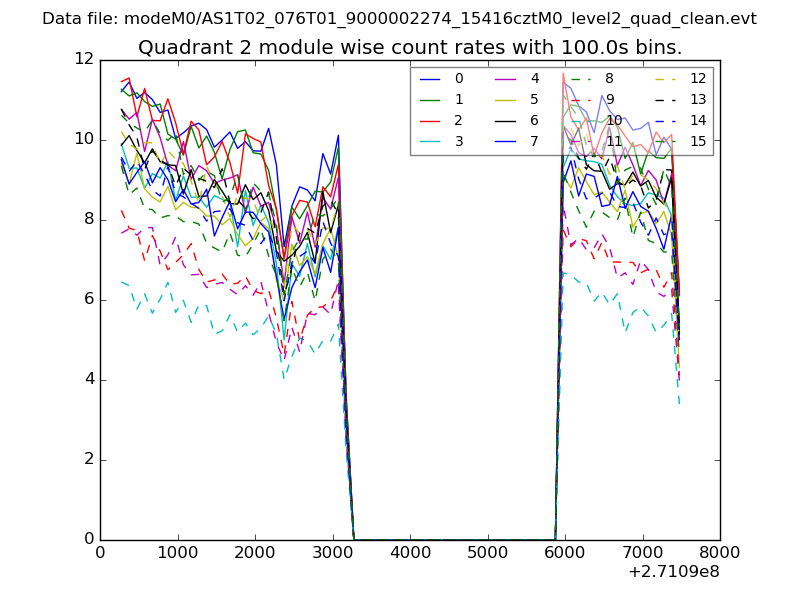
| Module-wise count rates for Quadrant B Data is divided into 100 sec bins |
 |
 |
| Module-wise count rates for Quadrant C Data is divided into 100 sec bins |
 |
 |
| Module-wise count rates for Quadrant D Data is divided into 100 sec bins |
 |
 |
| Parameter | Plot |
|---|---|
| CZT HV Monitor | 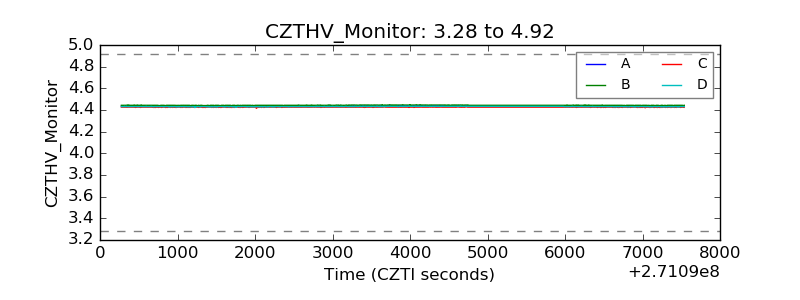 |
| D_VDD | 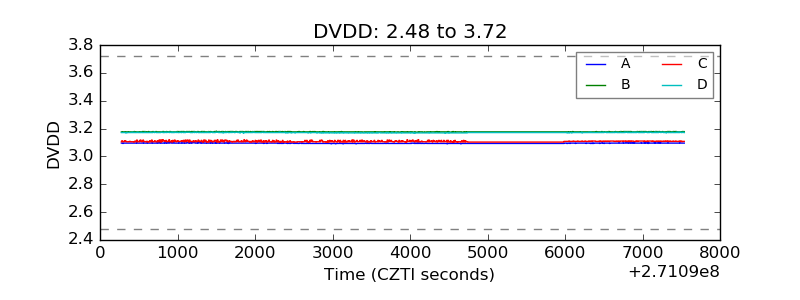 |
| Temperature 1 | 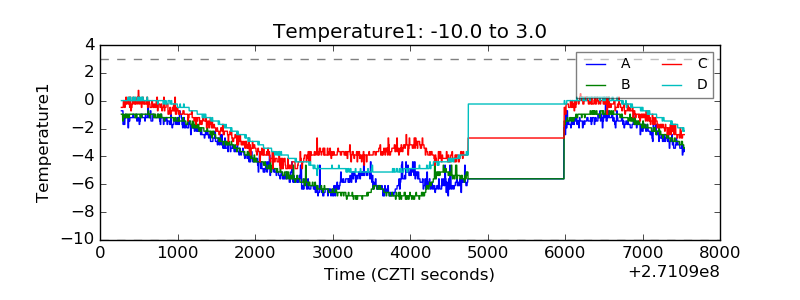 |
| Veto HV Monitor | 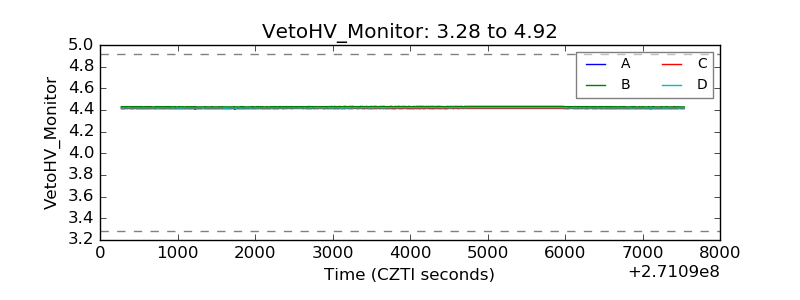 |
| Veto LLD | 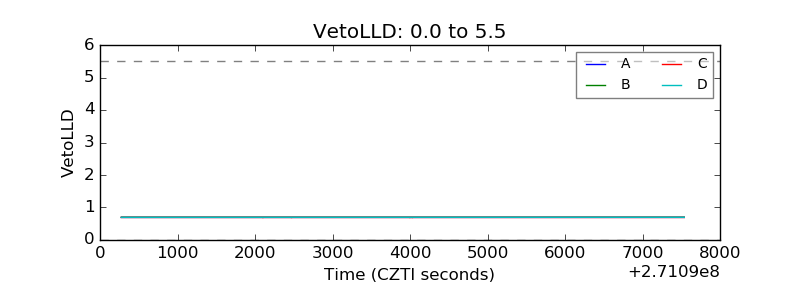 |
| Alpha Counter | 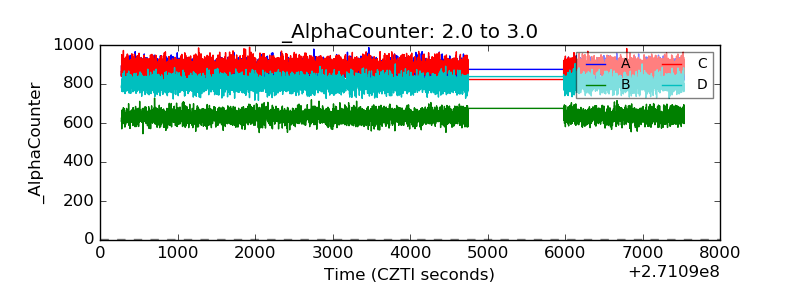 |
| _CPM_Rate | 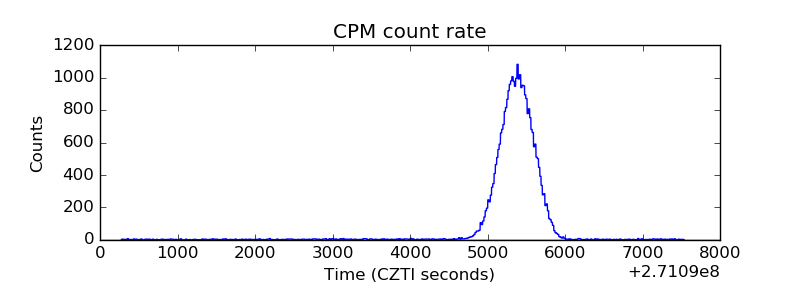 |
| CZT Counter | 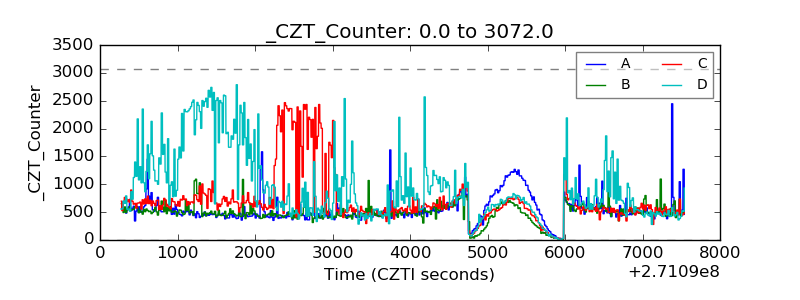 |
| +2.5 Volts monitor |  |
| +5 Volts monitor | 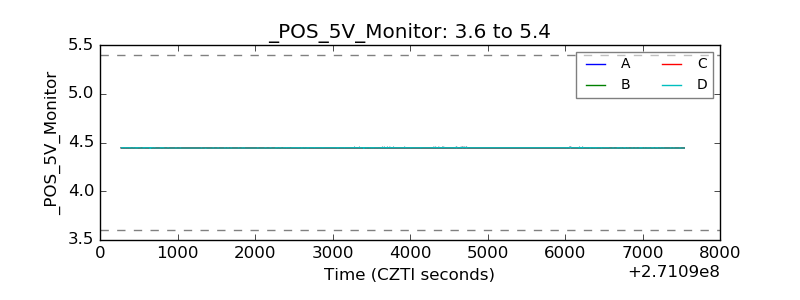 |
| _ROLL_ROT | 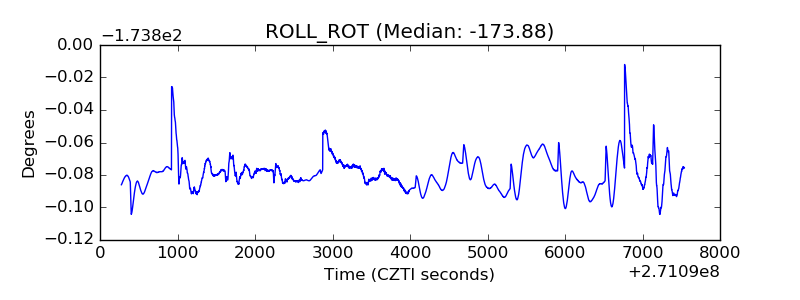 |
| _Roll_DEC | 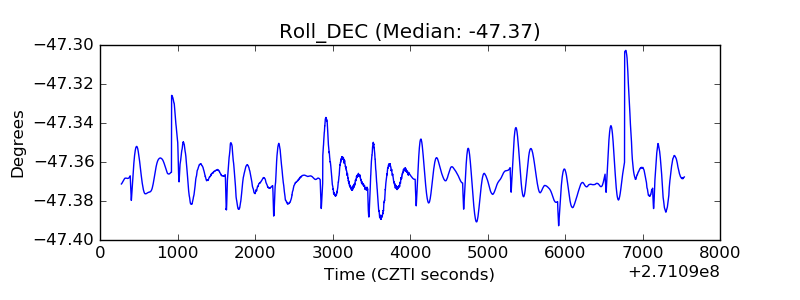 |
| _Roll_RA | 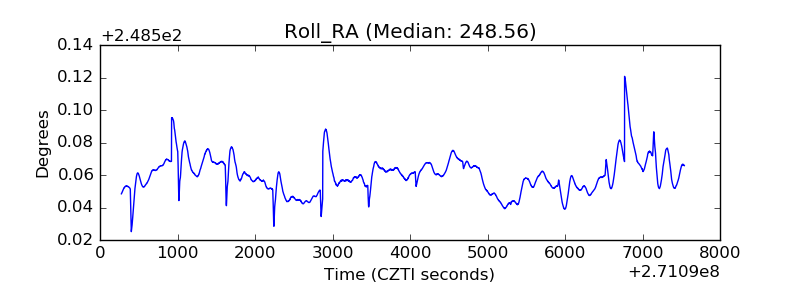 |
| Veto Counter | 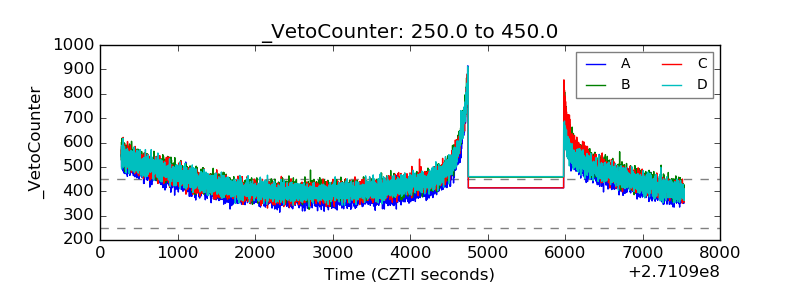 |