| Param | Original file | Final file |
|---|---|---|
| Filename | modeM0/AS1T02_076T01_9000002274_15417cztM0_level2.evt | modeM0/AS1T02_076T01_9000002274_15417cztM0_level2_quad_clean.evt |
| Size (bytes) | 515,923,200 | 100,635,840 |
| Size | 492.0 MB | 96.0 MB |
| Events in quadrant A | 3,669,120 | 655,357 |
| Events in quadrant B | 3,536,456 | 662,230 |
| Events in quadrant C | 3,565,432 | 648,294 |
| Events in quadrant D | 4,400,201 | 615,367 |
| Mode M0 | |||
|---|---|---|---|
| Quadrant | BADHDUFLAG | Total packets | Discarded packets |
| A | 0 | 15309 | 3 |
| B | 0 | 14751 | 2 |
| C | 0 | 14695 | 2 |
| D | 0 | 17866 | 2 |
| Mode SS | |||
|---|---|---|---|
| Quadrant | BADHDUFLAG | Total packets | Discarded packets |
| A | 0 | 136 | 0 |
| B | 0 | 136 | 0 |
| C | 0 | 136 | 0 |
| D | 0 | 136 | 0 |
| Mode M9 | |||
|---|---|---|---|
| Quadrant | BADHDUFLAG | Total packets | Discarded packets |
| A | 0 | 11 | 0 |
| B | 0 | 11 | 0 |
| C | 0 | 11 | 0 |
| D | 0 | 11 | 0 |
| Quadrant | Total seconds | Saturated seconds | Saturation percentage |
|---|---|---|---|
| A | 6687 | 164 | 2.452520% |
| B | 6687 | 64 | 0.957081% |
| C | 6687 | 19 | 0.284133% |
| D | 6688 | 139 | 2.078349% |
Noise dominated data is calculated using 1-second bins in cleaned event files. If a bin has >2000 counts, and if more than 50% of those come from <1% of pixels, then it is considered to be noise-dominated and hence unusable.
| Quadrant | # 1 sec bins | Bins with >0 counts | Bins with >2000 counts | High rate bins dominated by noise | Noise dominated (total time) | Noise dominated (detector-on time) | Marked lightcurve |
|---|---|---|---|---|---|---|---|
| A | 7718 | 6689 | 93 | 93 | 1.20% | 1.39% | 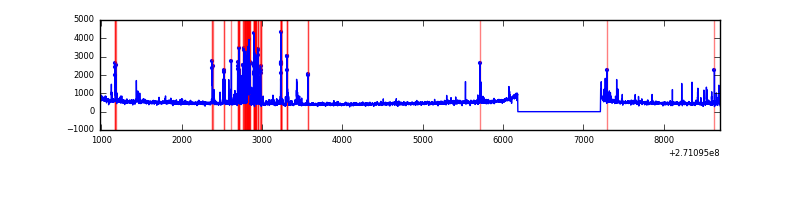 |
| B | 7718 | 6689 | 10 | 10 | 0.13% | 0.15% | 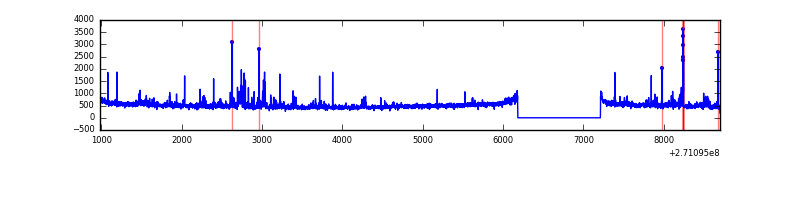 |
| C | 7718 | 6689 | 2 | 2 | 0.03% | 0.03% | 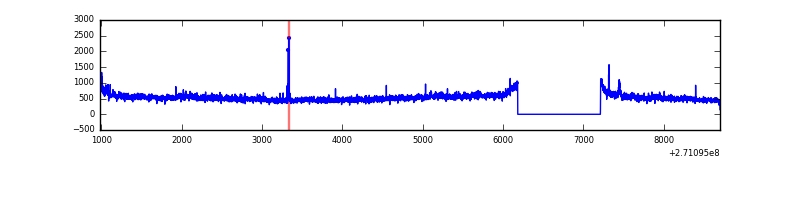 |
| D | 7719 | 6690 | 105 | 105 | 1.36% | 1.57% | 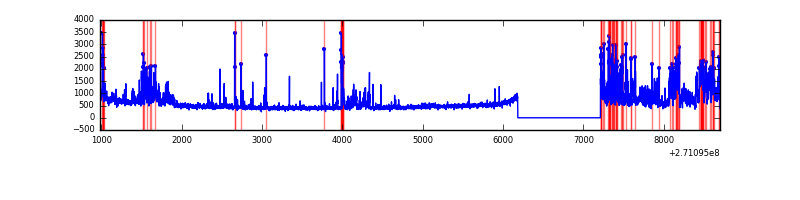 |
Top three noisy pixels from each quadrant. If the there are fewer than three noisy pixels in the level2.evt file, extra rows are filled as -1
| Pixel properties | Quadrant properties | ||||||
|---|---|---|---|---|---|---|---|
| Quadrant | DetID | PixID | Counts | Sigma | Mean | Median | Sigma |
| A | 14 | 238 | 272207 | 1626.78 | 816 | 799 | 166.8 |
| A | 14 | 237 | 142519 | 849.45 | 816 | 799 | 166.8 |
| A | 13 | 248 | 75802 | 449.56 | 816 | 799 | 166.8 |
| B | 0 | 189 | 47242 | 298.4 | 817 | 800 | 155.6 |
| B | 4 | 142 | 41362 | 260.62 | 817 | 800 | 155.6 |
| B | 0 | 197 | 41031 | 258.49 | 817 | 800 | 155.6 |
| C | 3 | 233 | 426477 | 2362.91 | 781 | 786 | 180.2 |
| C | 7 | 247 | 84600 | 465.23 | 781 | 786 | 180.2 |
| C | 13 | 61 | 5676 | 27.14 | 781 | 786 | 180.2 |
| D | 13 | 122 | 897524 | 4688.82 | 781 | 755 | 191.3 |
| D | 2 | 33 | 135925 | 706.75 | 781 | 755 | 191.3 |
| D | 5 | 222 | 129817 | 674.81 | 781 | 755 | 191.3 |
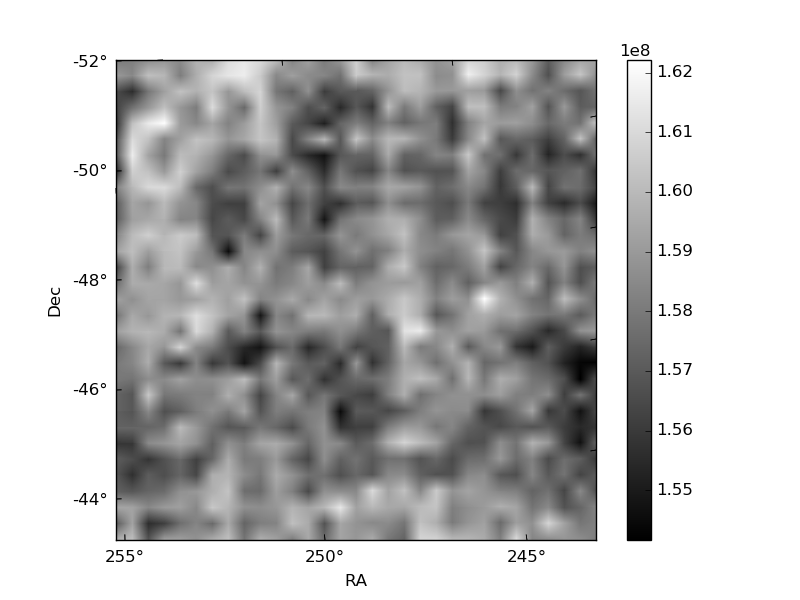
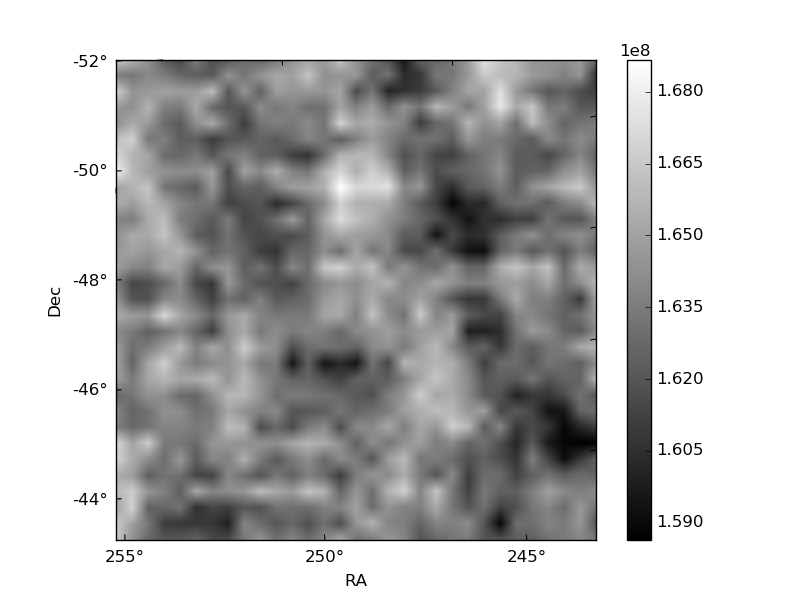
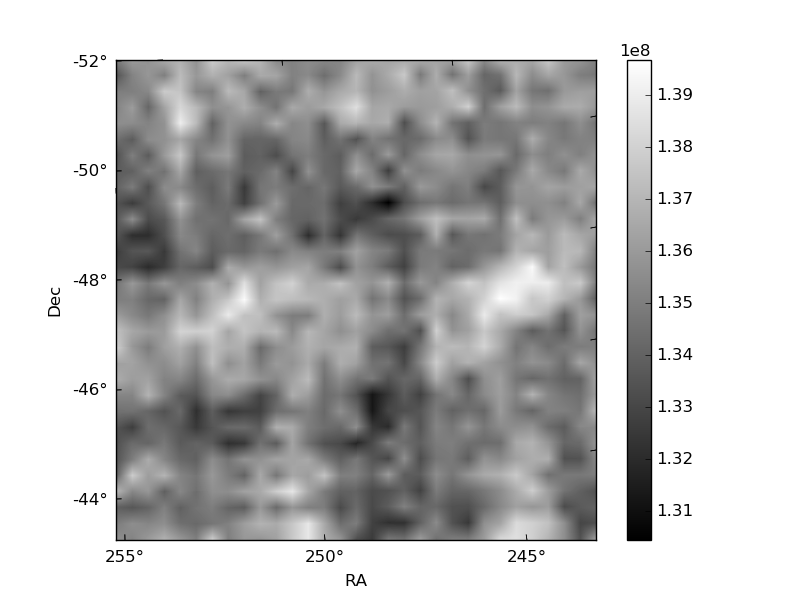
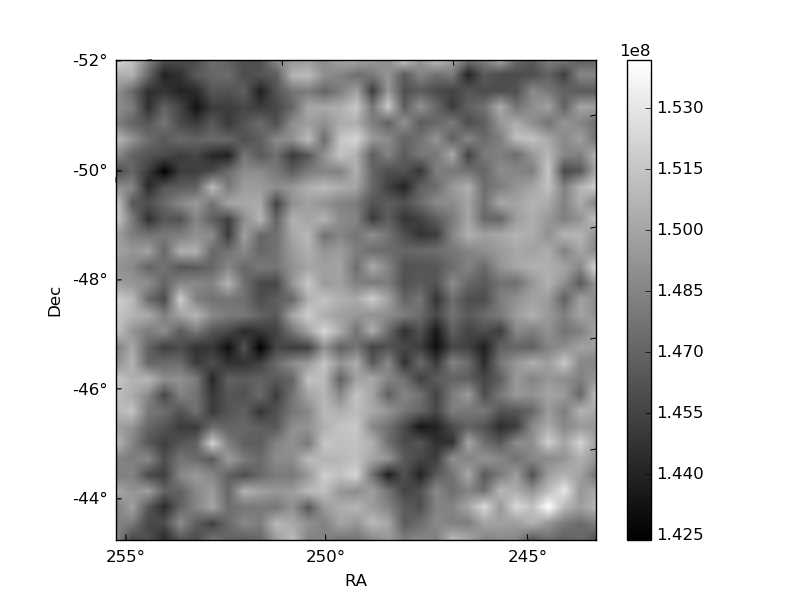
Histogram calculated using DETX and DETY for each event in the final _common_clean file
| Quadrant A | 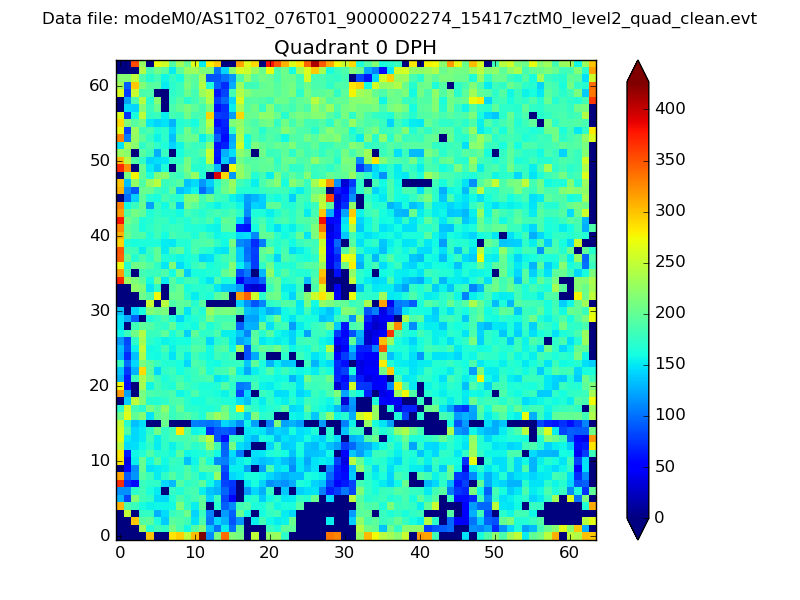 |
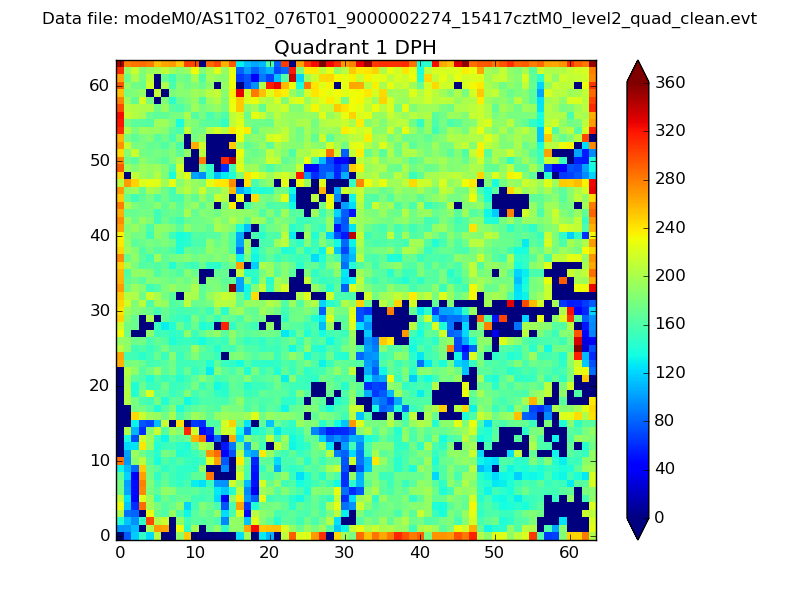 |
Quadrant B |
|---|---|---|---|
| Quadrant D |  |
 |
Quadrant C |
| Plot type | Count rate plots | Images |
|---|---|---|
| Comparison with Poisson distribution Blue bars denote a histogram of data divided into 1 sec bins. Red curve is a Poisson curve with rate = median count rate of data. |
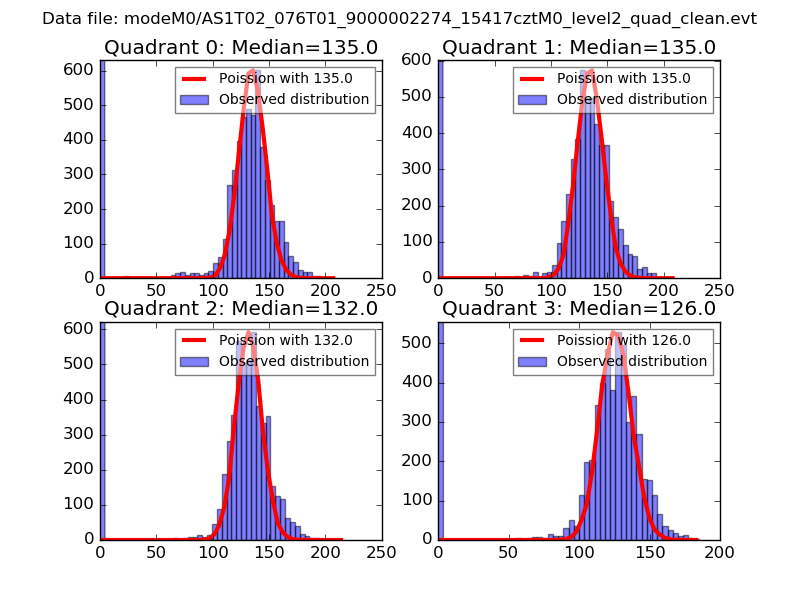 |
 |
| Quadrant-wise count rates Data is divided into 100 sec bins |
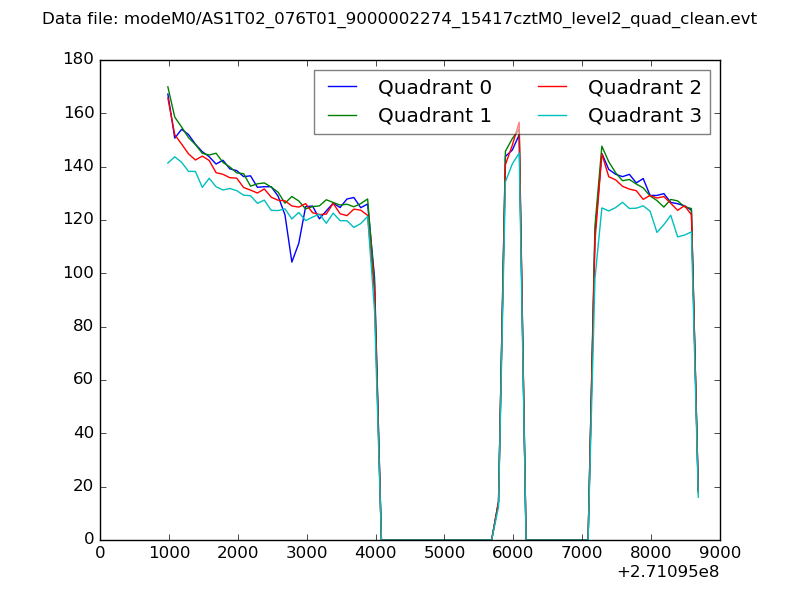 |
|
| Module-wise count rates for Quadrant A Data is divided into 100 sec bins |
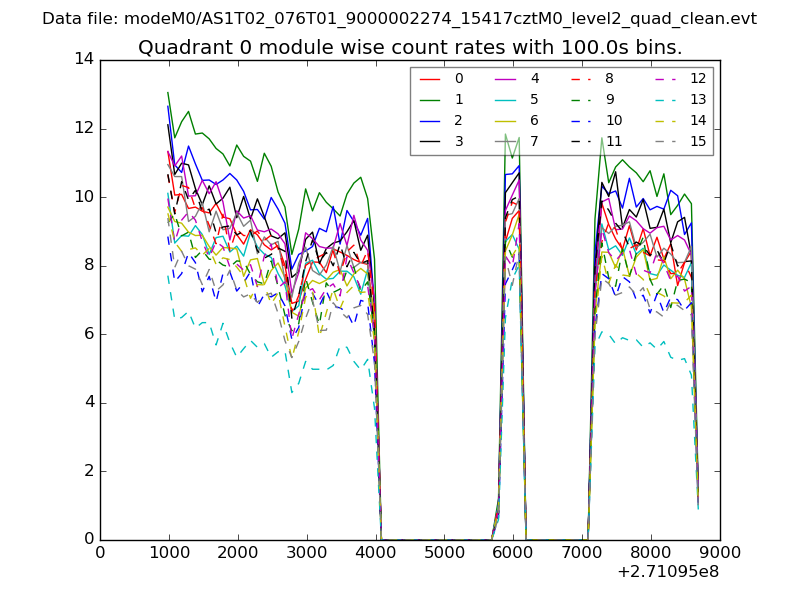 |
 |
| Module-wise count rates for Quadrant B Data is divided into 100 sec bins |
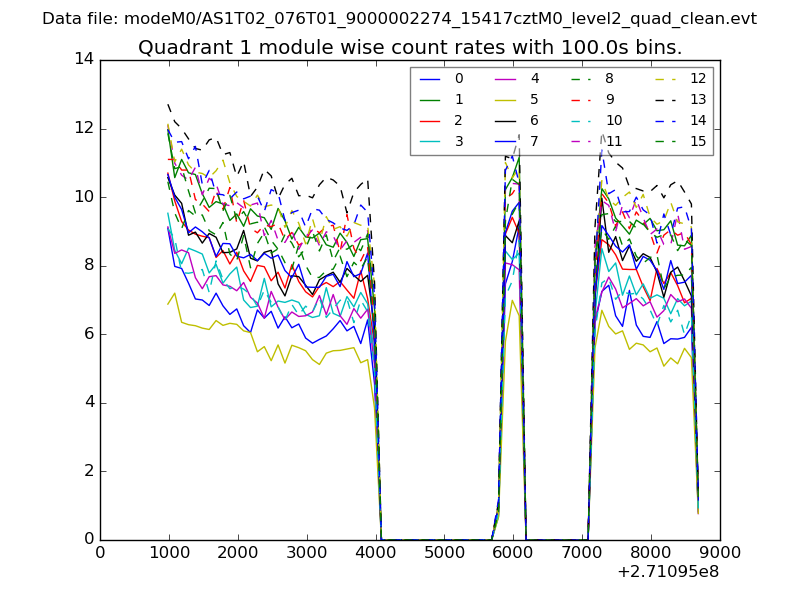 |
 |
| Module-wise count rates for Quadrant C Data is divided into 100 sec bins |
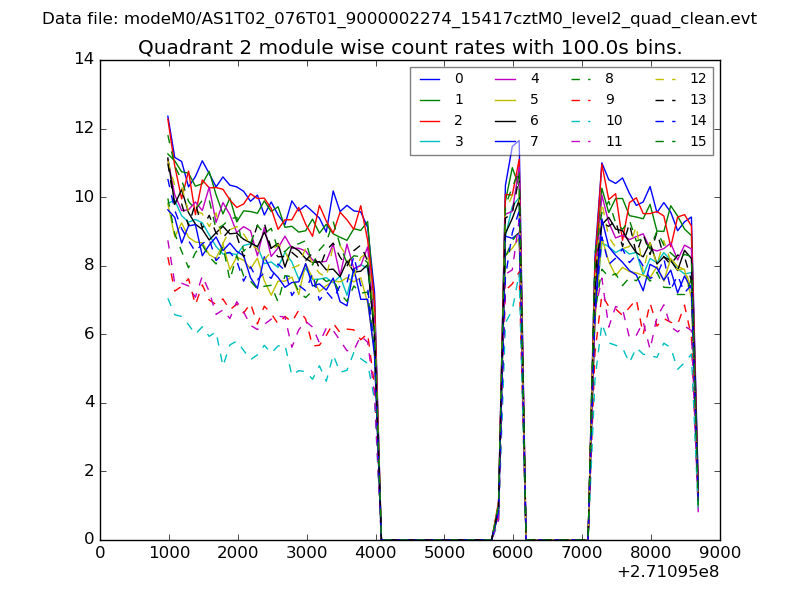 |
 |
| Module-wise count rates for Quadrant D Data is divided into 100 sec bins |
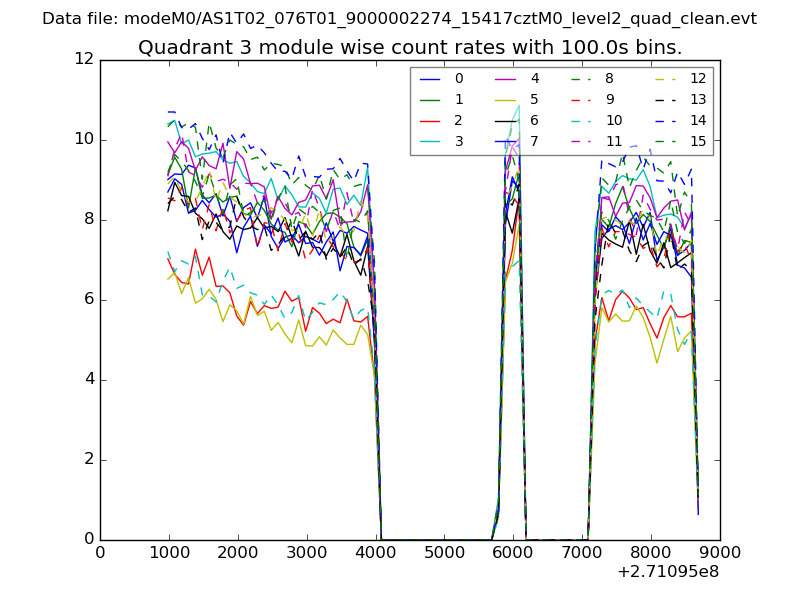 |
 |
| Parameter | Plot |
|---|---|
| CZT HV Monitor | 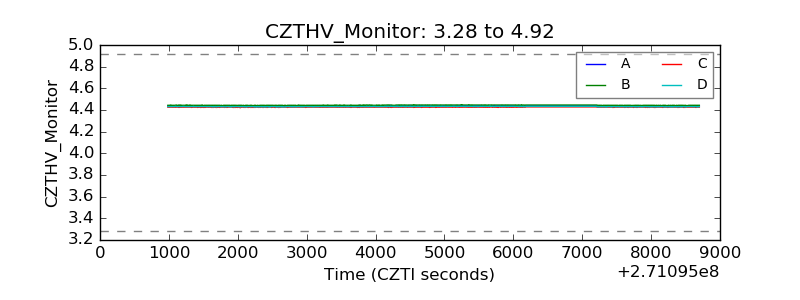 |
| D_VDD | 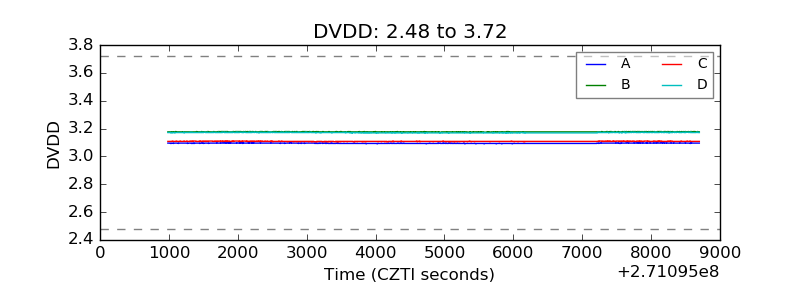 |
| Temperature 1 | 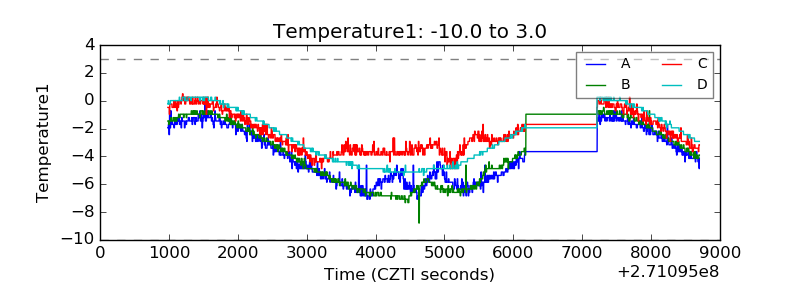 |
| Veto HV Monitor |  |
| Veto LLD | 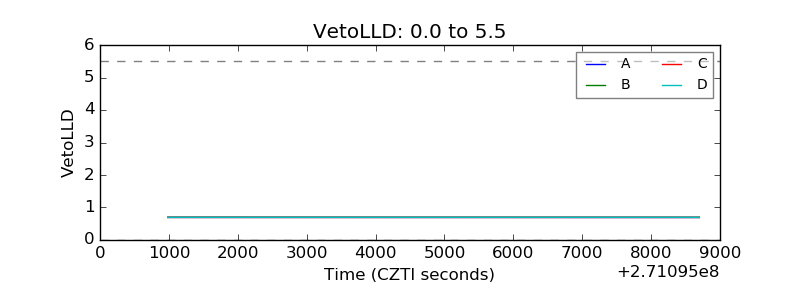 |
| Alpha Counter | 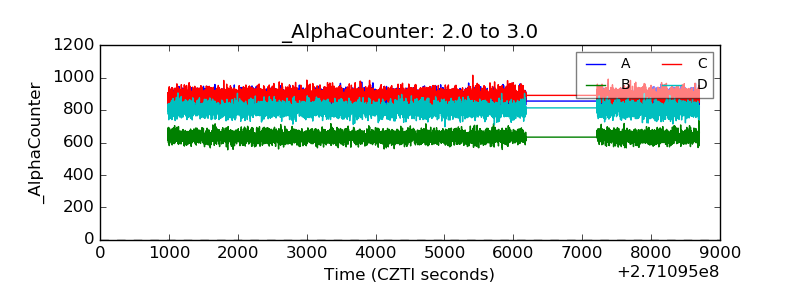 |
| _CPM_Rate | 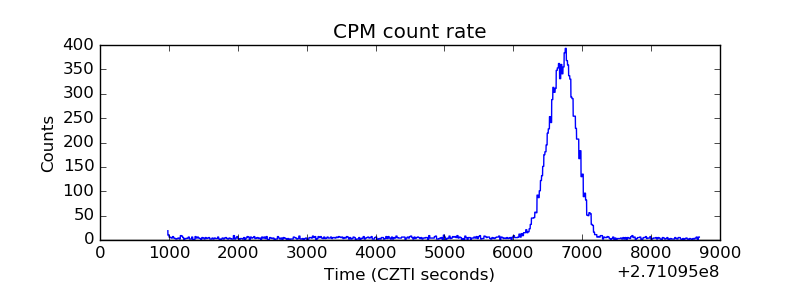 |
| CZT Counter | 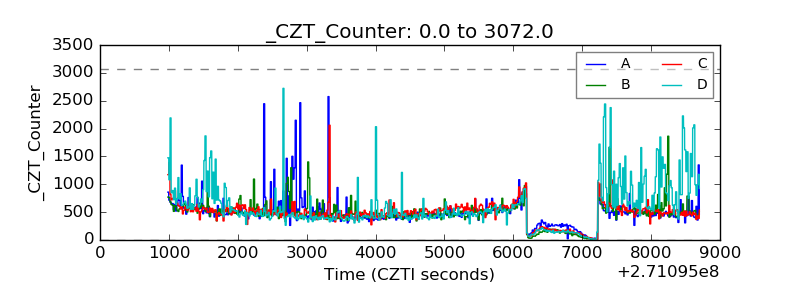 |
| +2.5 Volts monitor |  |
| +5 Volts monitor |  |
| _ROLL_ROT | 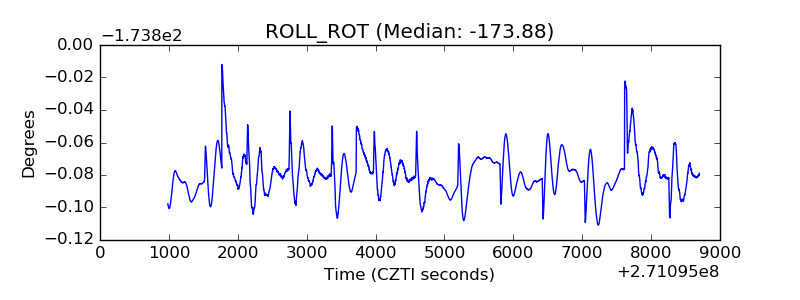 |
| _Roll_DEC | 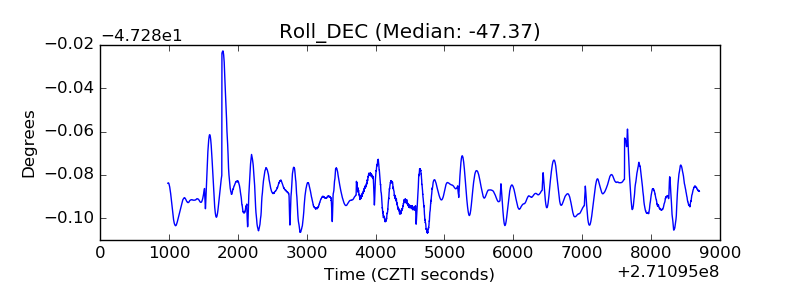 |
| _Roll_RA | 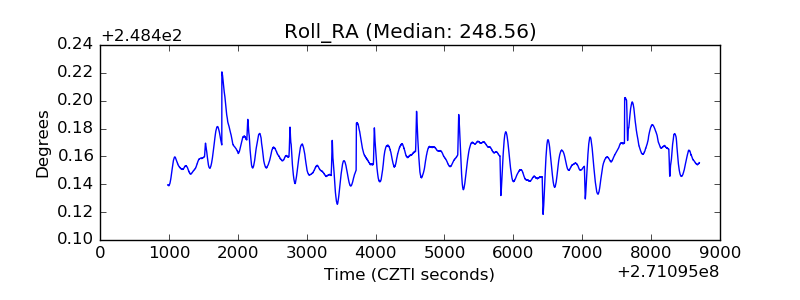 |
| Veto Counter | 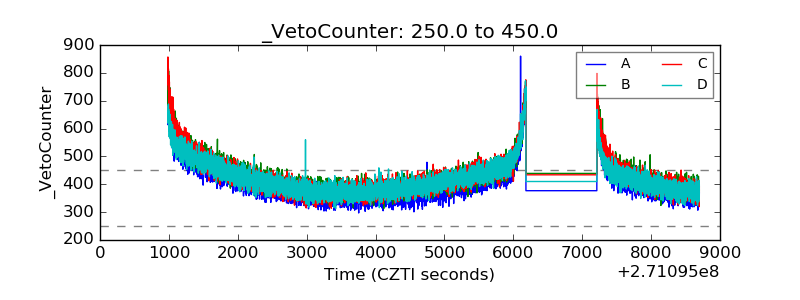 |