| Param | Original file | Final file |
|---|---|---|
| Filename | modeM0/AS1T02_076T01_9000002274_15418cztM0_level2.evt | modeM0/AS1T02_076T01_9000002274_15418cztM0_level2_quad_clean.evt |
| Size (bytes) | 665,665,920 | 101,165,760 |
| Size | 634.8 MB | 96.5 MB |
| Events in quadrant A | 3,752,280 | 659,095 |
| Events in quadrant B | 3,544,707 | 668,939 |
| Events in quadrant C | 3,631,647 | 660,235 |
| Events in quadrant D | 8,759,646 | 589,154 |
| Mode M0 | |||
|---|---|---|---|
| Quadrant | BADHDUFLAG | Total packets | Discarded packets |
| A | 0 | 15844 | 3 |
| B | 0 | 15018 | 2 |
| C | 0 | 15060 | 2 |
| D | 0 | 31003 | 2 |
| Mode SS | |||
|---|---|---|---|
| Quadrant | BADHDUFLAG | Total packets | Discarded packets |
| A | 0 | 142 | 0 |
| B | 0 | 142 | 0 |
| C | 0 | 142 | 0 |
| D | 0 | 142 | 0 |
| Mode M9 | |||
|---|---|---|---|
| Quadrant | BADHDUFLAG | Total packets | Discarded packets |
| A | 0 | 11 | 0 |
| B | 0 | 11 | 0 |
| C | 0 | 11 | 0 |
| D | 0 | 12 | 0 |
| Quadrant | Total seconds | Saturated seconds | Saturation percentage |
|---|---|---|---|
| A | 6976 | 181 | 2.594610% |
| B | 6976 | 53 | 0.759748% |
| C | 6976 | 26 | 0.372706% |
| D | 6976 | 887 | 12.715023% |
Noise dominated data is calculated using 1-second bins in cleaned event files. If a bin has >2000 counts, and if more than 50% of those come from <1% of pixels, then it is considered to be noise-dominated and hence unusable.
| Quadrant | # 1 sec bins | Bins with >0 counts | Bins with >2000 counts | High rate bins dominated by noise | Noise dominated (total time) | Noise dominated (detector-on time) | Marked lightcurve |
|---|---|---|---|---|---|---|---|
| A | 7687 | 6978 | 123 | 123 | 1.60% | 1.76% | 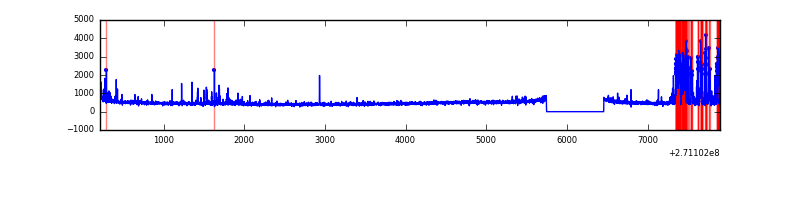 |
| B | 7687 | 6978 | 12 | 12 | 0.16% | 0.17% | 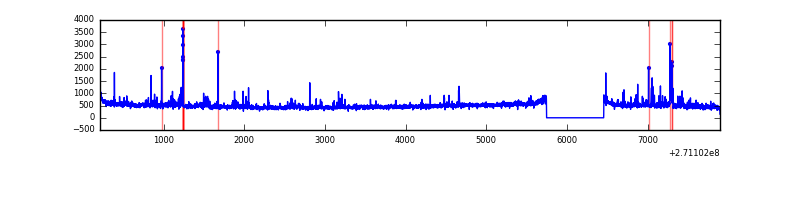 |
| C | 7687 | 6978 | 8 | 8 | 0.10% | 0.11% | 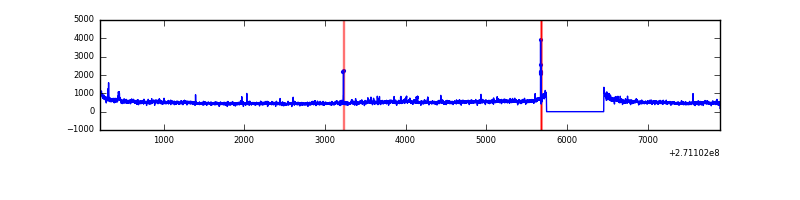 |
| D | 7687 | 6978 | 923 | 923 | 12.01% | 13.23% | 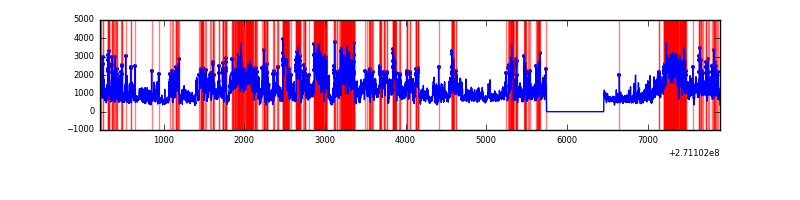 |
Top three noisy pixels from each quadrant. If the there are fewer than three noisy pixels in the level2.evt file, extra rows are filled as -1
| Pixel properties | Quadrant properties | ||||||
|---|---|---|---|---|---|---|---|
| Quadrant | DetID | PixID | Counts | Sigma | Mean | Median | Sigma |
| A | 14 | 238 | 378886 | 2246.69 | 825 | 808 | 168.3 |
| A | 14 | 237 | 123911 | 731.53 | 825 | 808 | 168.3 |
| A | 9 | 143 | 29749 | 171.98 | 825 | 808 | 168.3 |
| B | 0 | 229 | 37528 | 231.57 | 828 | 806 | 158.6 |
| B | 0 | 219 | 33809 | 208.12 | 828 | 806 | 158.6 |
| B | 3 | 209 | 33703 | 207.45 | 828 | 806 | 158.6 |
| C | 3 | 233 | 508666 | 2779.02 | 794 | 800 | 182.7 |
| C | 7 | 247 | 18966 | 99.4 | 794 | 800 | 182.7 |
| C | 13 | 61 | 5707 | 26.85 | 794 | 800 | 182.7 |
| D | 1 | 20 | 2808996 | 14950.0 | 765 | 744 | 187.8 |
| D | 13 | 122 | 2398770 | 12766.12 | 765 | 744 | 187.8 |
| D | 2 | 33 | 313843 | 1666.81 | 765 | 744 | 187.8 |
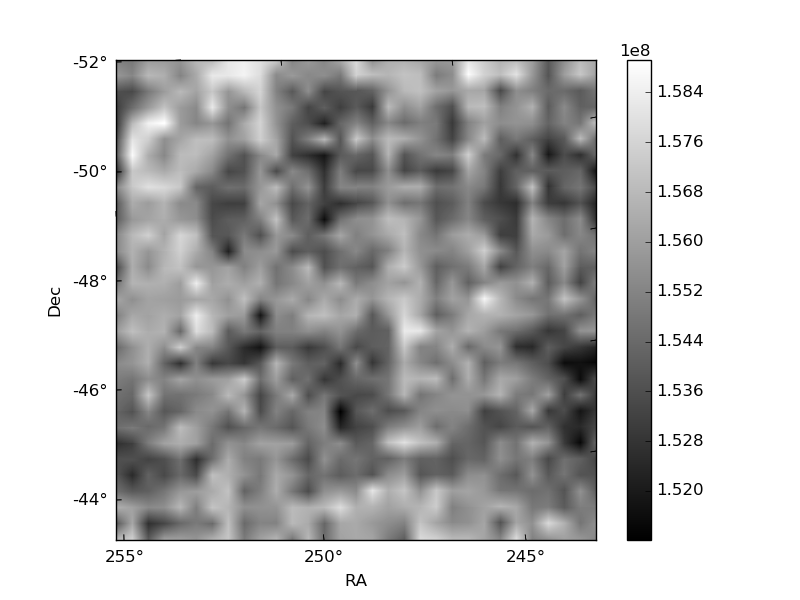
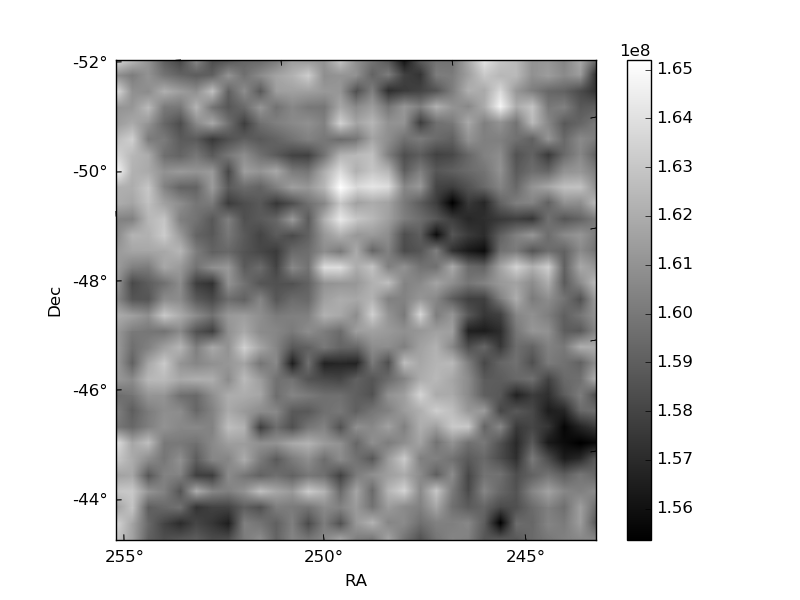
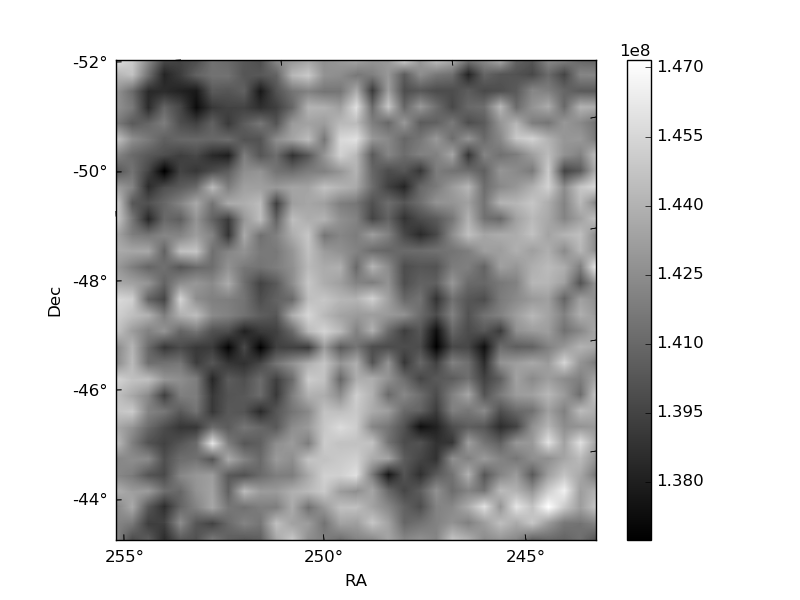
Histogram calculated using DETX and DETY for each event in the final _common_clean file
| Quadrant A | 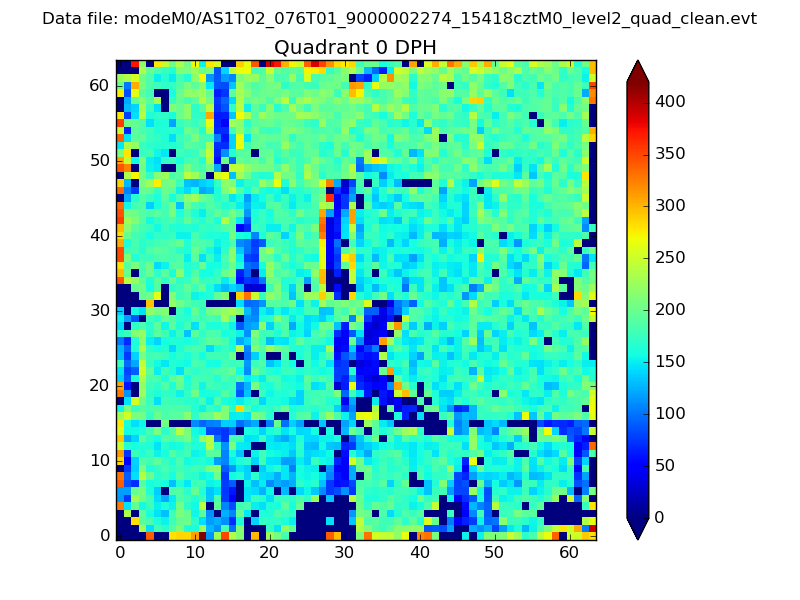 |
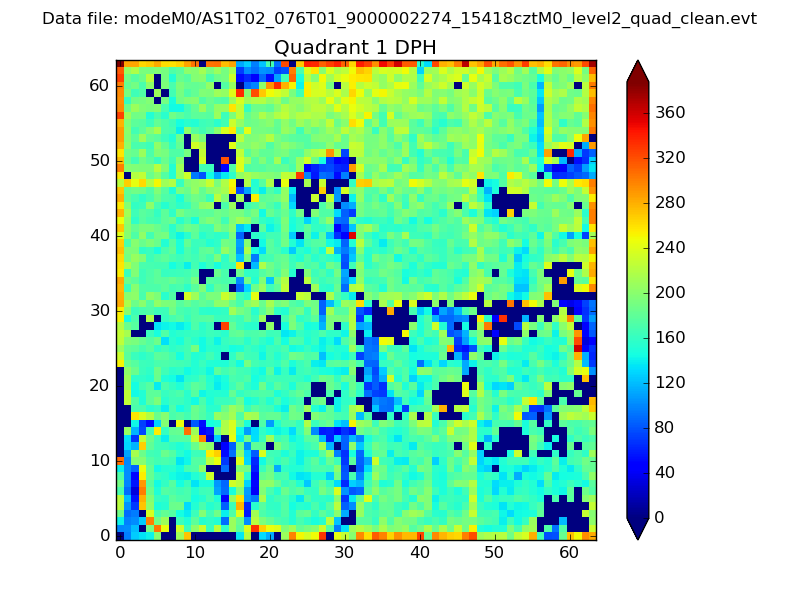 |
Quadrant B |
|---|---|---|---|
| Quadrant D | 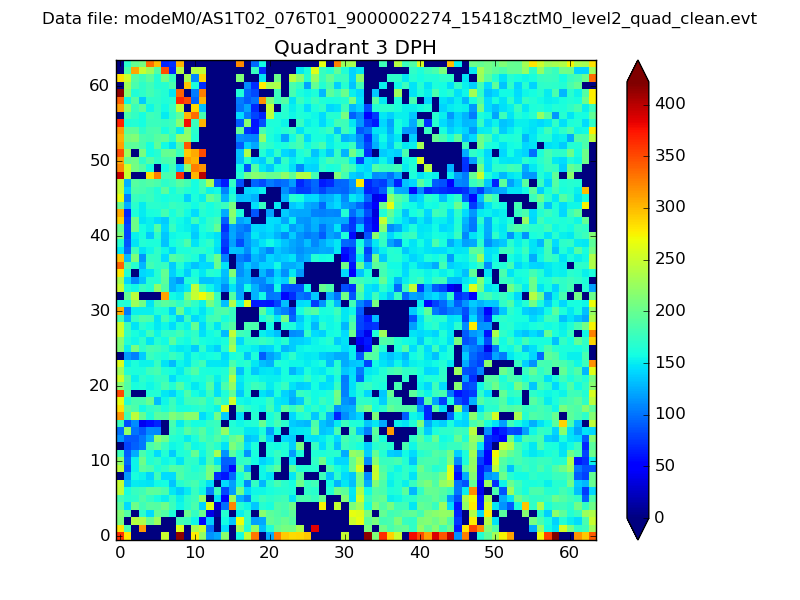 |
 |
Quadrant C |
| Plot type | Count rate plots | Images |
|---|---|---|
| Comparison with Poisson distribution Blue bars denote a histogram of data divided into 1 sec bins. Red curve is a Poisson curve with rate = median count rate of data. |
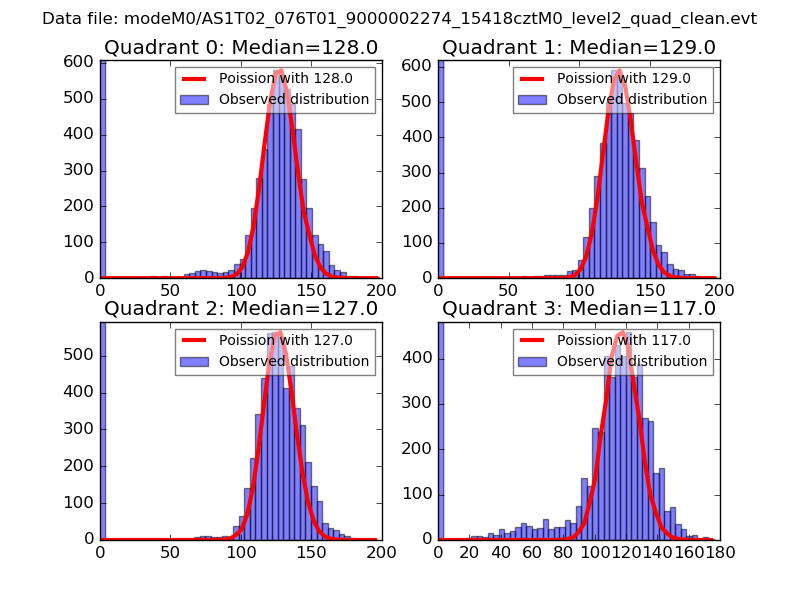 |
 |
| Quadrant-wise count rates Data is divided into 100 sec bins |
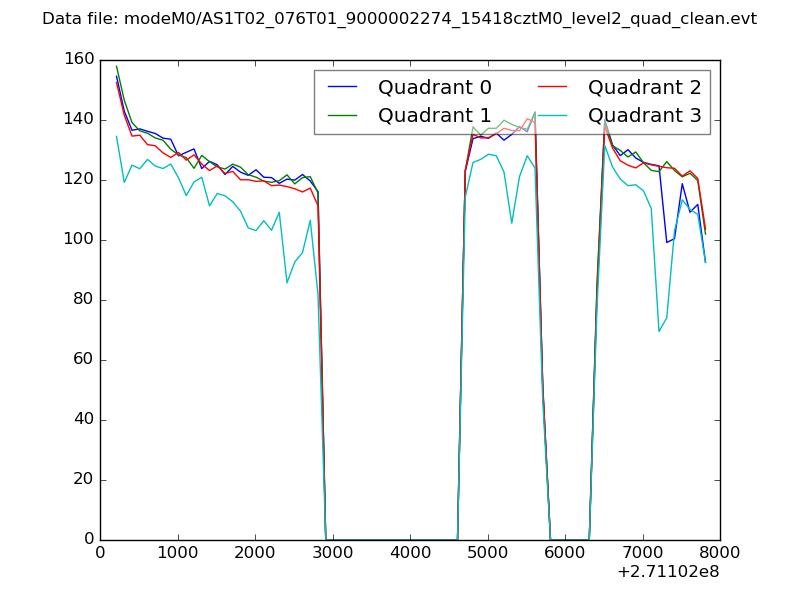 |
|
| Module-wise count rates for Quadrant A Data is divided into 100 sec bins |
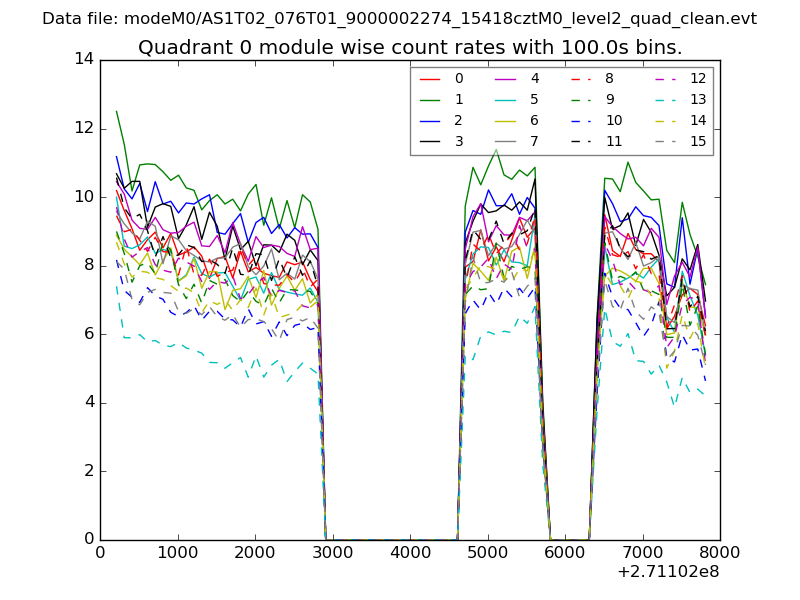 |
 |
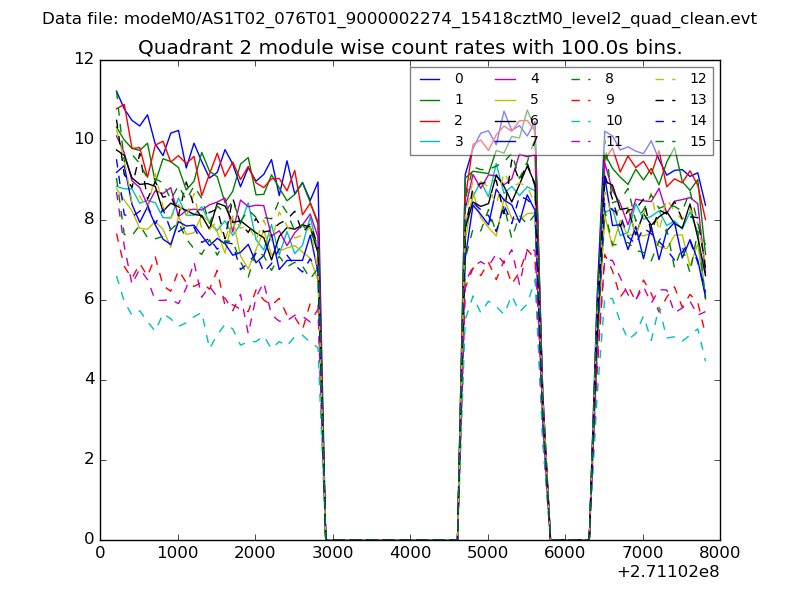
| Module-wise count rates for Quadrant B Data is divided into 100 sec bins |
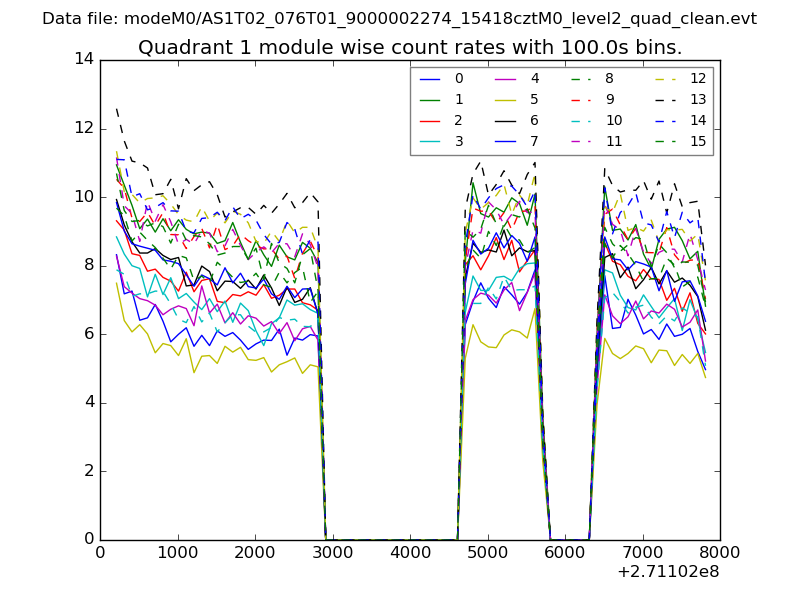 |
 |
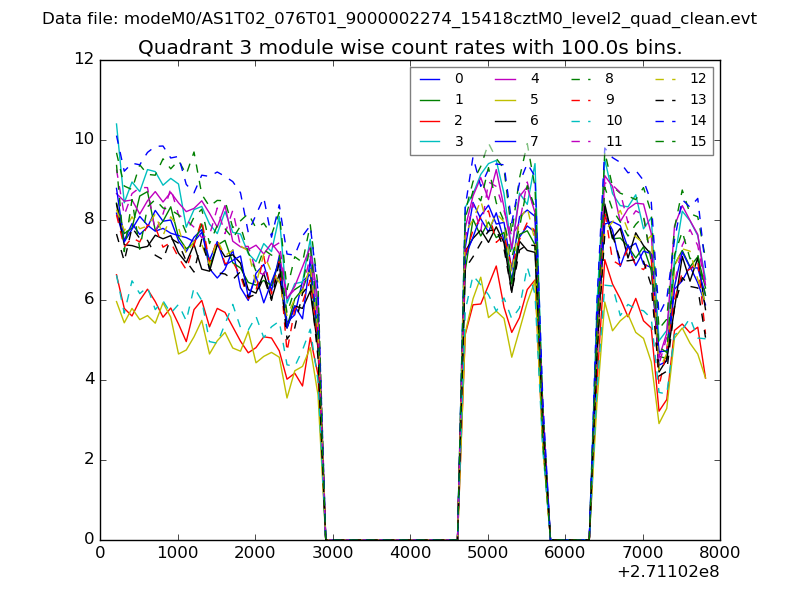
| Module-wise count rates for Quadrant C Data is divided into 100 sec bins |
 |
 |
| Module-wise count rates for Quadrant D Data is divided into 100 sec bins |
 |
 |
| Parameter | Plot |
|---|---|
| CZT HV Monitor | 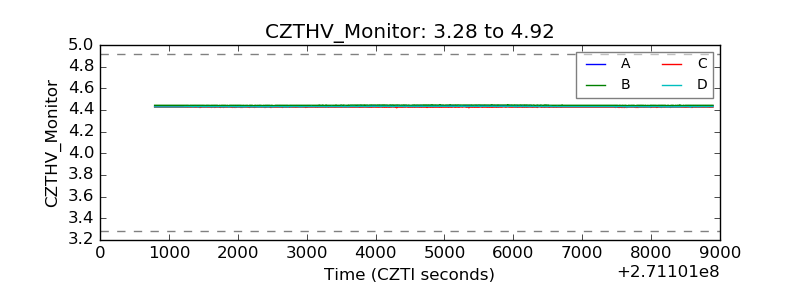 |
| D_VDD | 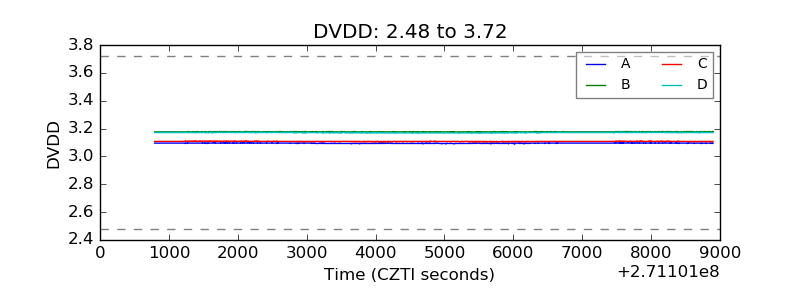 |
| Temperature 1 |  |
| Veto HV Monitor | 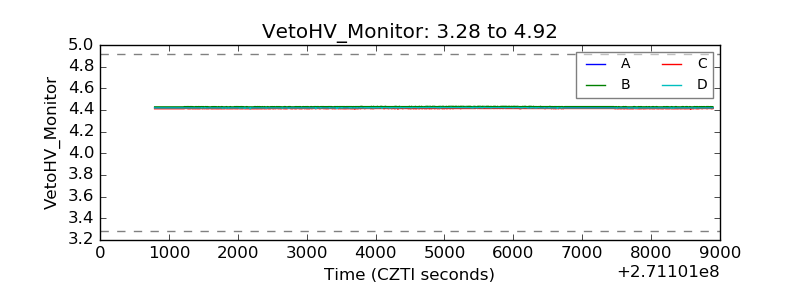 |
| Veto LLD | 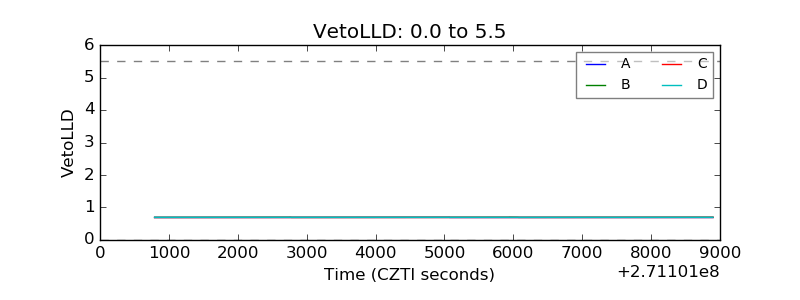 |
| Alpha Counter | 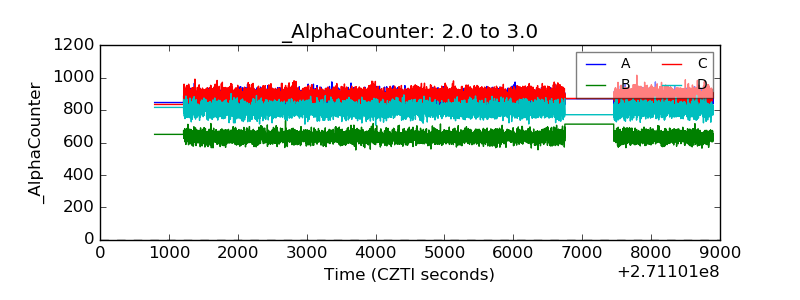 |
| _CPM_Rate | 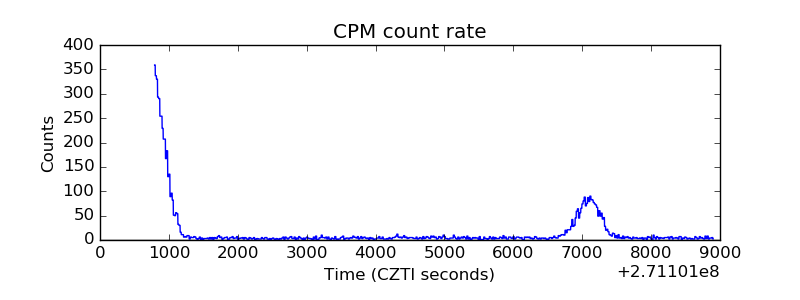 |
| CZT Counter | 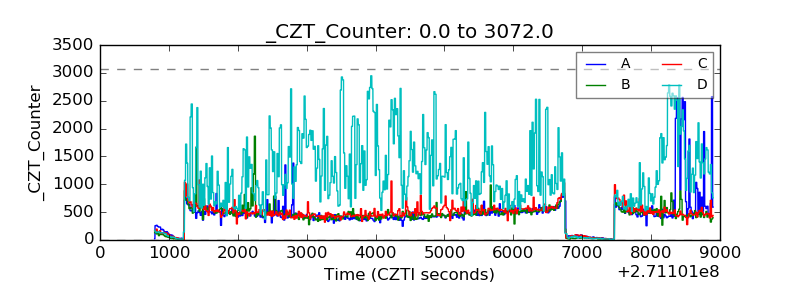 |
| +2.5 Volts monitor |  |
| +5 Volts monitor |  |
| _ROLL_ROT | 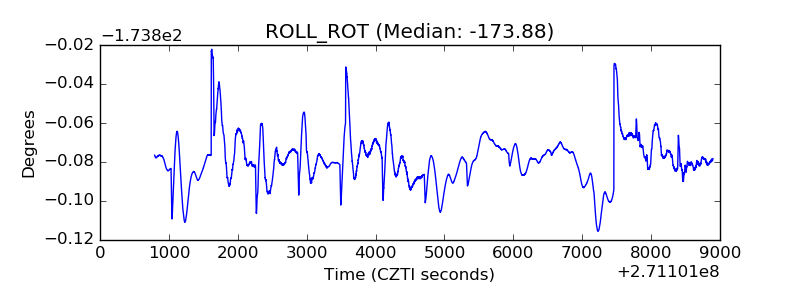 |
| _Roll_DEC | 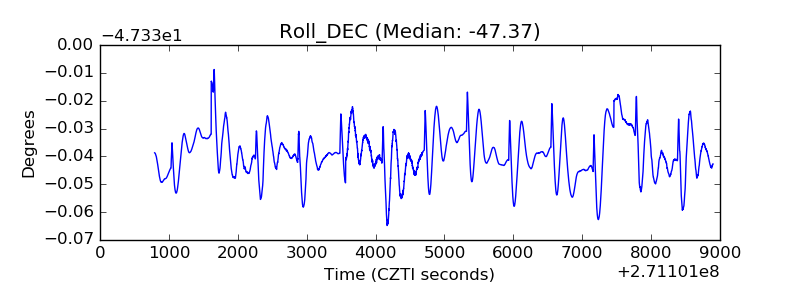 |
| _Roll_RA | 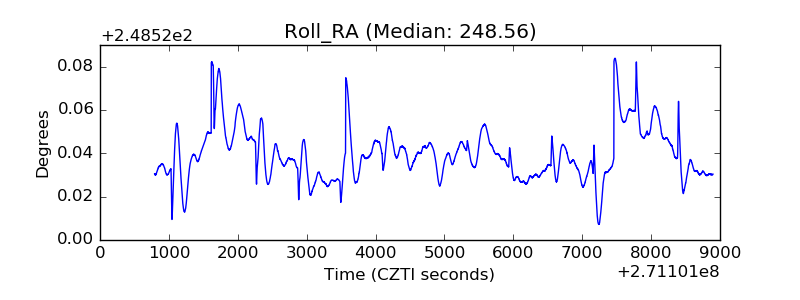 |
| Veto Counter | 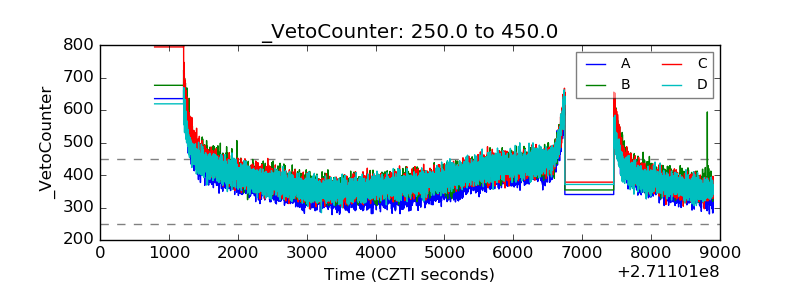 |