| Param | Original file | Final file |
|---|---|---|
| Filename | modeM0/AS1T02_076T01_9000002274_15419cztM0_level2.evt | modeM0/AS1T02_076T01_9000002274_15419cztM0_level2_quad_clean.evt |
| Size (bytes) | 627,099,840 | 107,156,160 |
| Size | 598.0 MB | 102.2 MB |
| Events in quadrant A | 4,248,153 | 689,595 |
| Events in quadrant B | 3,740,575 | 704,251 |
| Events in quadrant C | 3,783,000 | 695,608 |
| Events in quadrant D | 6,722,550 | 643,773 |
| Mode M0 | |||
|---|---|---|---|
| Quadrant | BADHDUFLAG | Total packets | Discarded packets |
| A | 0 | 17503 | 3 |
| B | 0 | 15899 | 2 |
| C | 0 | 15716 | 2 |
| D | 0 | 25218 | 2 |
| Mode SS | |||
|---|---|---|---|
| Quadrant | BADHDUFLAG | Total packets | Discarded packets |
| A | 0 | 150 | 0 |
| B | 0 | 150 | 0 |
| C | 0 | 150 | 0 |
| D | 0 | 150 | 0 |
| Mode M9 | |||
|---|---|---|---|
| Quadrant | BADHDUFLAG | Total packets | Discarded packets |
| A | 0 | 5 | 0 |
| B | 0 | 5 | 0 |
| C | 0 | 5 | 0 |
| D | 0 | 6 | 0 |
| Quadrant | Total seconds | Saturated seconds | Saturation percentage |
|---|---|---|---|
| A | 7351 | 231 | 3.142430% |
| B | 7351 | 83 | 1.129098% |
| C | 7351 | 33 | 0.448919% |
| D | 7351 | 362 | 4.924500% |
Noise dominated data is calculated using 1-second bins in cleaned event files. If a bin has >2000 counts, and if more than 50% of those come from <1% of pixels, then it is considered to be noise-dominated and hence unusable.
| Quadrant | # 1 sec bins | Bins with >0 counts | Bins with >2000 counts | High rate bins dominated by noise | Noise dominated (total time) | Noise dominated (detector-on time) | Marked lightcurve |
|---|---|---|---|---|---|---|---|
| A | 7697 | 7353 | 171 | 171 | 2.22% | 2.33% | 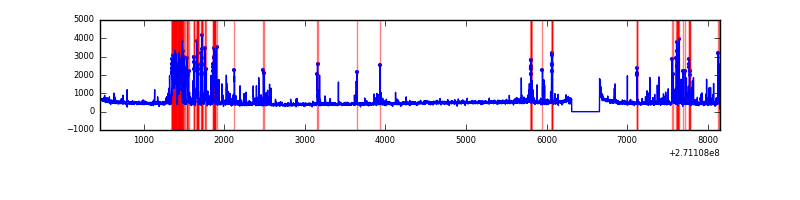 |
| B | 7697 | 7353 | 27 | 27 | 0.35% | 0.37% | 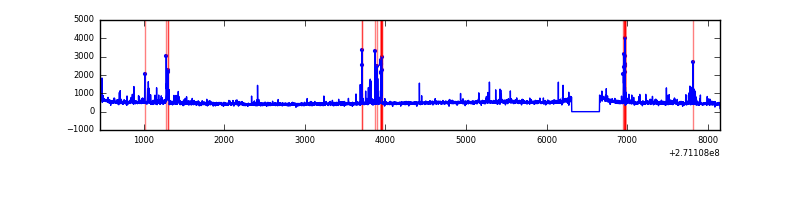 |
| C | 7697 | 7353 | 3 | 3 | 0.04% | 0.04% | 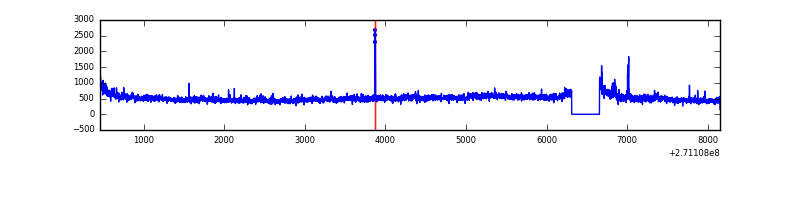 |
| D | 7697 | 7353 | 296 | 296 | 3.85% | 4.03% | 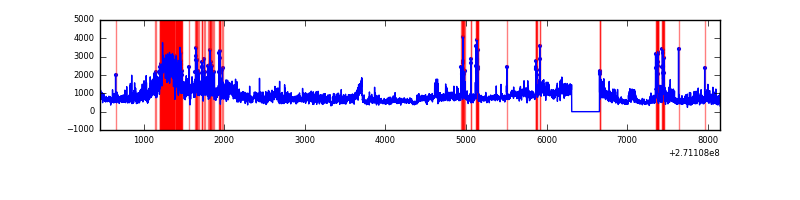 |
Top three noisy pixels from each quadrant. If the there are fewer than three noisy pixels in the level2.evt file, extra rows are filled as -1
| Pixel properties | Quadrant properties | ||||||
|---|---|---|---|---|---|---|---|
| Quadrant | DetID | PixID | Counts | Sigma | Mean | Median | Sigma |
| A | 14 | 238 | 605972 | 3463.01 | 856 | 839 | 174.7 |
| A | 14 | 237 | 220835 | 1258.98 | 856 | 839 | 174.7 |
| A | 13 | 248 | 76222 | 431.4 | 856 | 839 | 174.7 |
| B | 10 | 245 | 154692 | 931.58 | 862 | 840 | 165.2 |
| B | 0 | 219 | 35145 | 207.71 | 862 | 840 | 165.2 |
| B | 0 | 189 | 32926 | 194.28 | 862 | 840 | 165.2 |
| C | 3 | 233 | 529402 | 2769.7 | 828 | 833 | 190.8 |
| C | 10 | 22 | 9114 | 43.39 | 828 | 833 | 190.8 |
| C | 7 | 247 | 8804 | 41.77 | 828 | 833 | 190.8 |
| D | 13 | 122 | 2602537 | 12776.75 | 819 | 792 | 203.6 |
| D | 1 | 20 | 545698 | 2675.95 | 819 | 792 | 203.6 |
| D | 5 | 222 | 177701 | 868.77 | 819 | 792 | 203.6 |
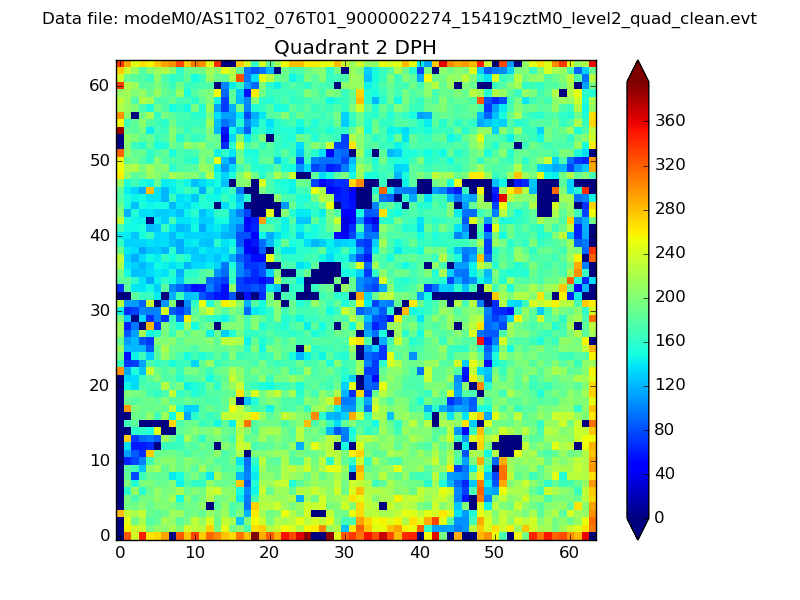
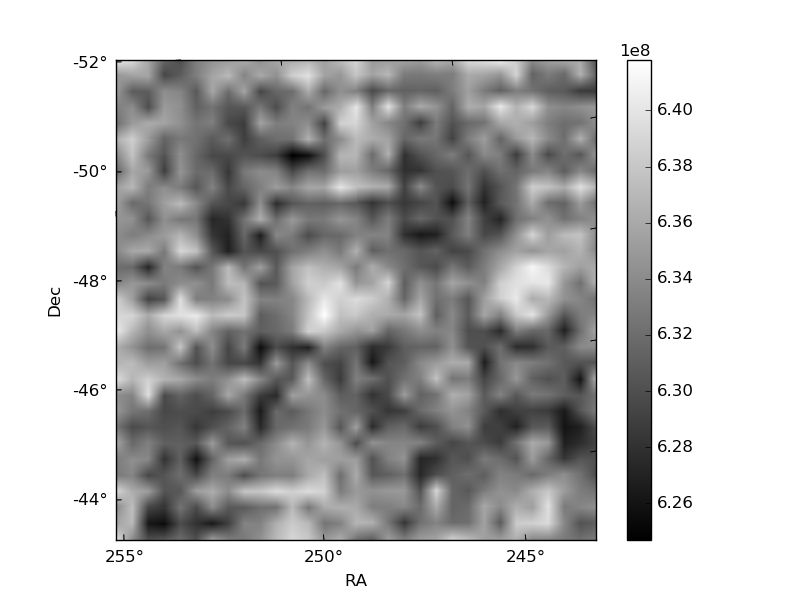
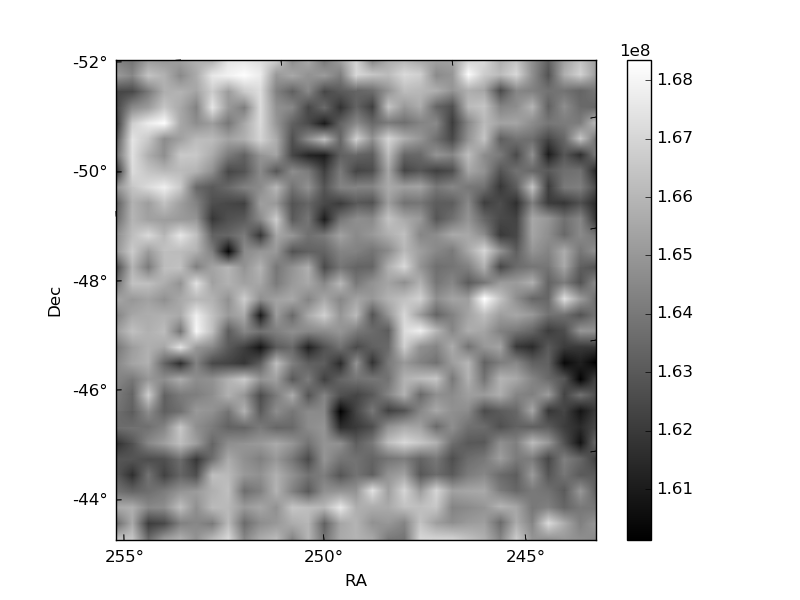
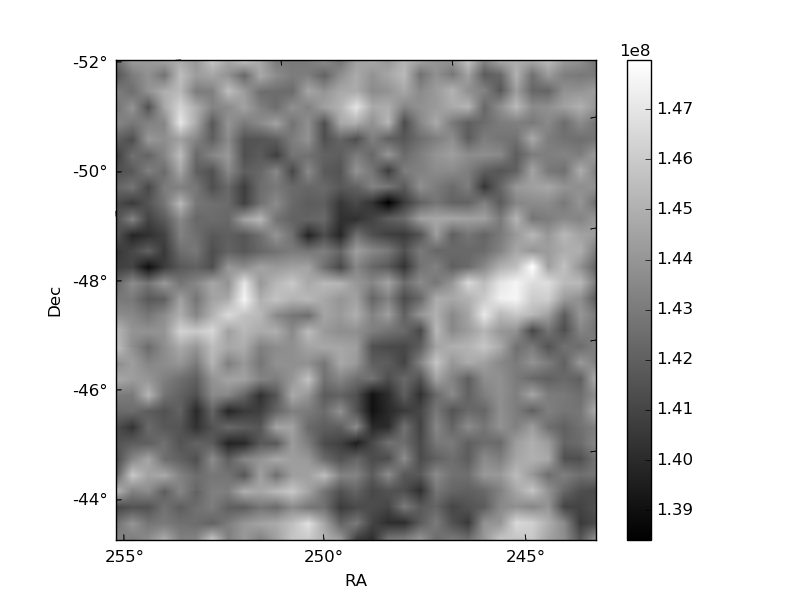
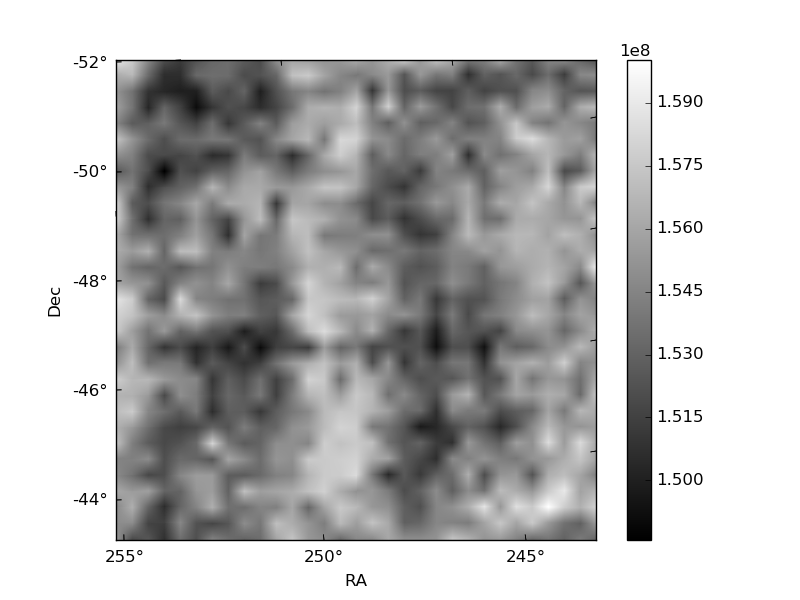
Histogram calculated using DETX and DETY for each event in the final _common_clean file
| Quadrant A | 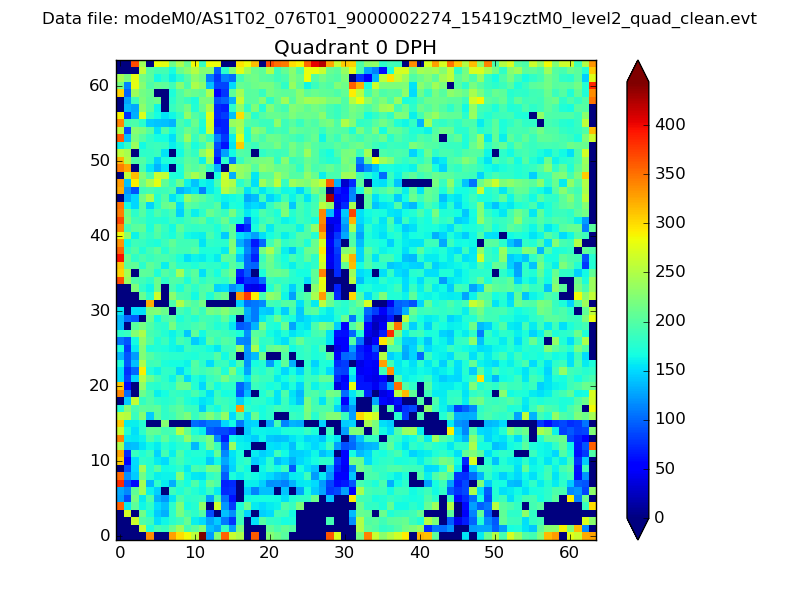 |
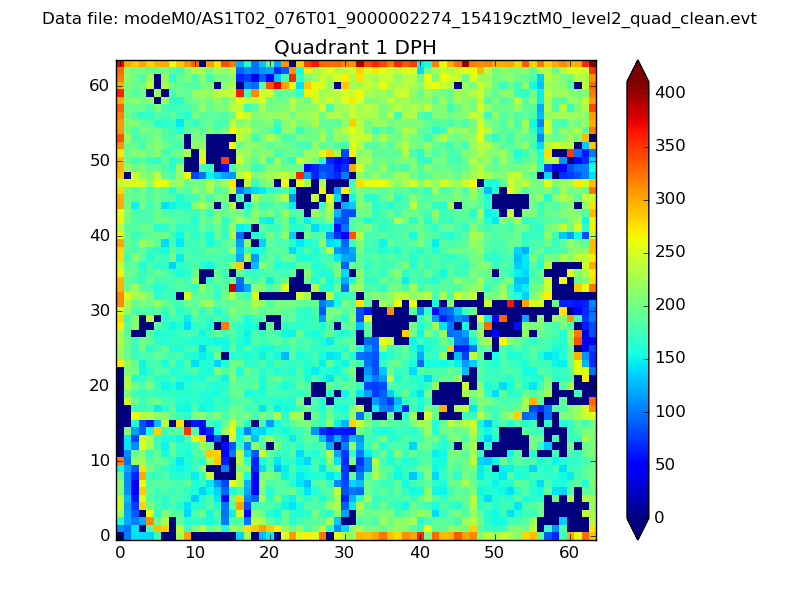 |
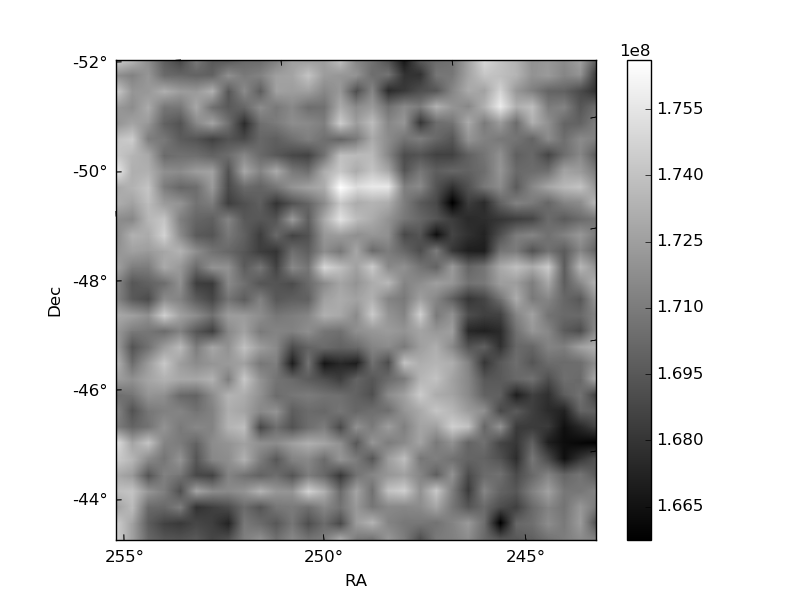
Quadrant B |
|---|---|---|---|
| Quadrant D | 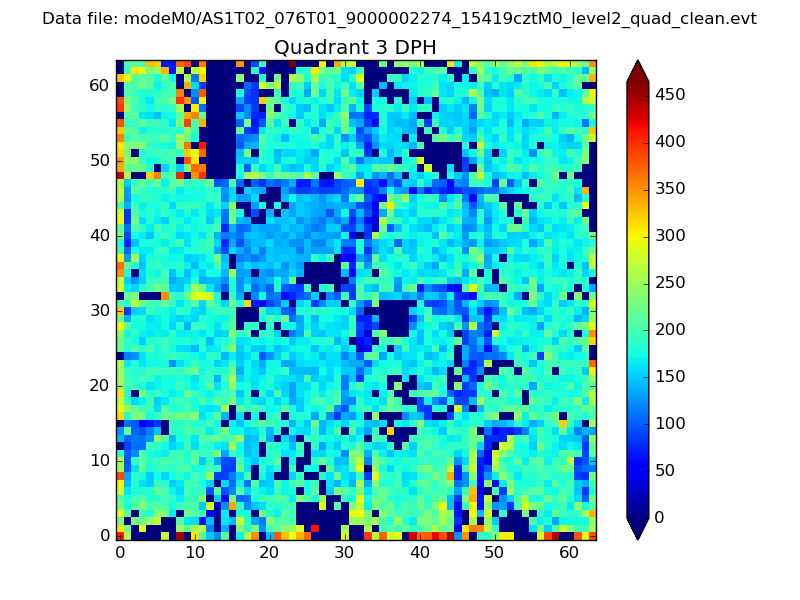 |
 |
Quadrant C |
| Plot type | Count rate plots | Images |
|---|---|---|
| Comparison with Poisson distribution Blue bars denote a histogram of data divided into 1 sec bins. Red curve is a Poisson curve with rate = median count rate of data. |
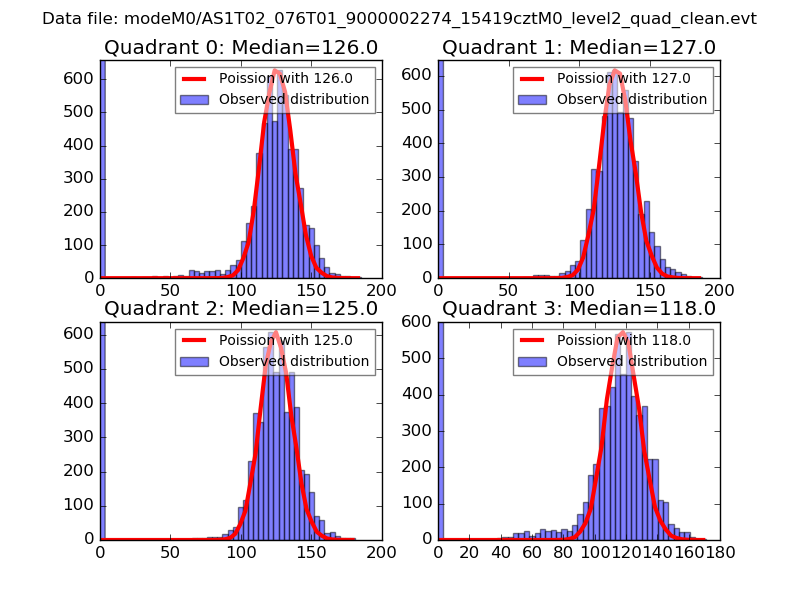 |
 |
| Quadrant-wise count rates Data is divided into 100 sec bins |
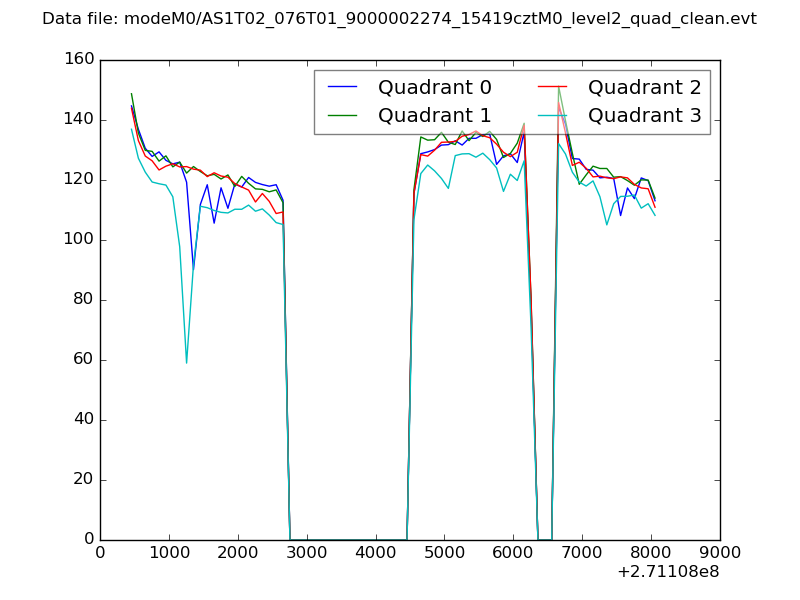 |
|
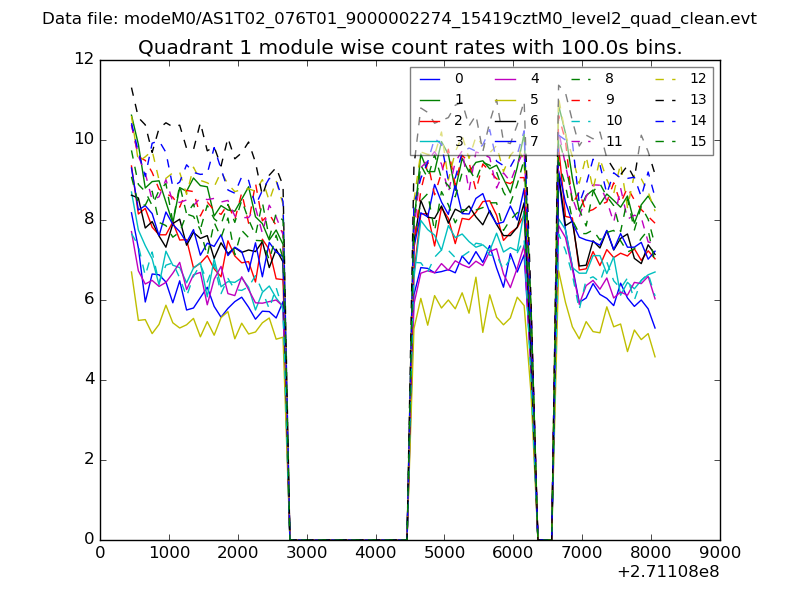
| Module-wise count rates for Quadrant A Data is divided into 100 sec bins |
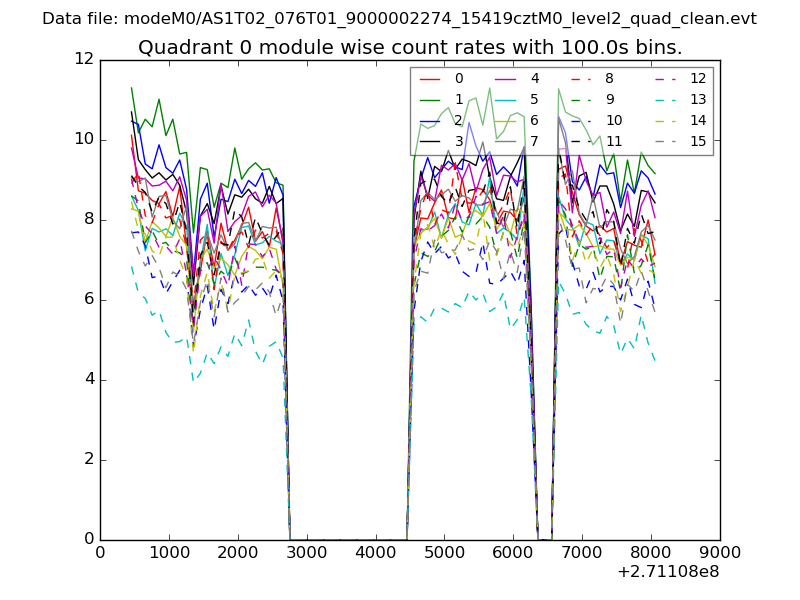 |
 |
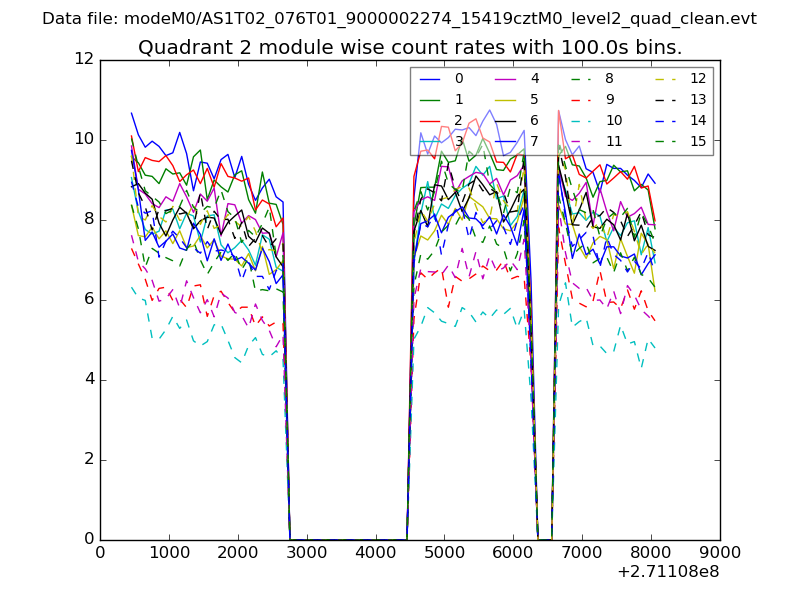
| Module-wise count rates for Quadrant B Data is divided into 100 sec bins |
 |
 |
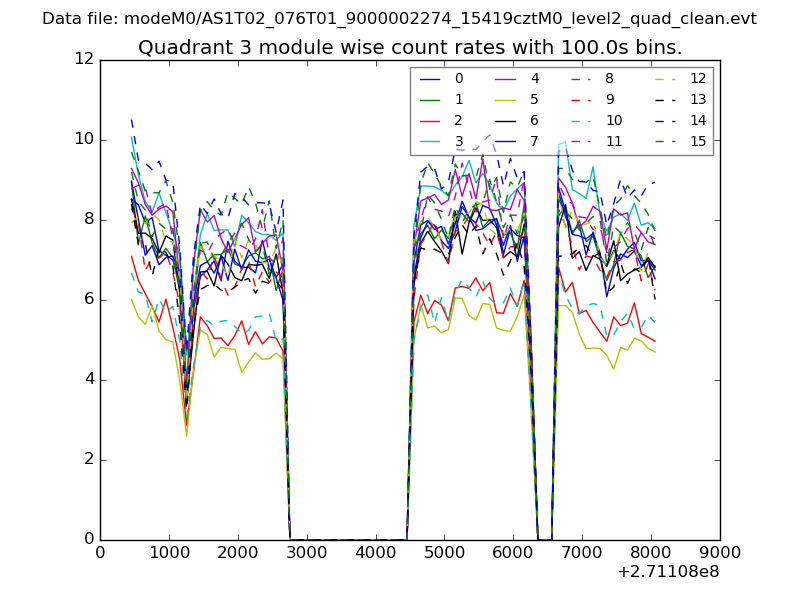
| Module-wise count rates for Quadrant C Data is divided into 100 sec bins |
 |
 |
| Module-wise count rates for Quadrant D Data is divided into 100 sec bins |
 |
 |
| Parameter | Plot |
|---|---|
| CZT HV Monitor | 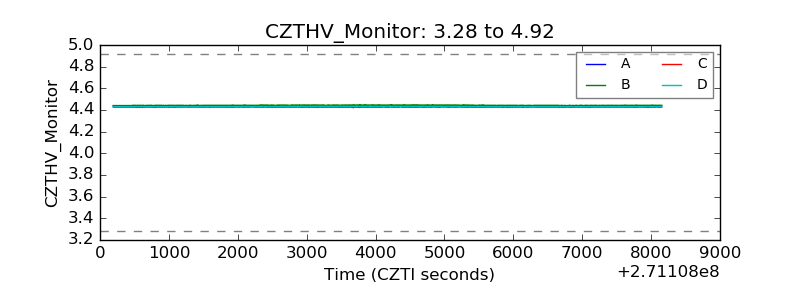 |
| D_VDD | 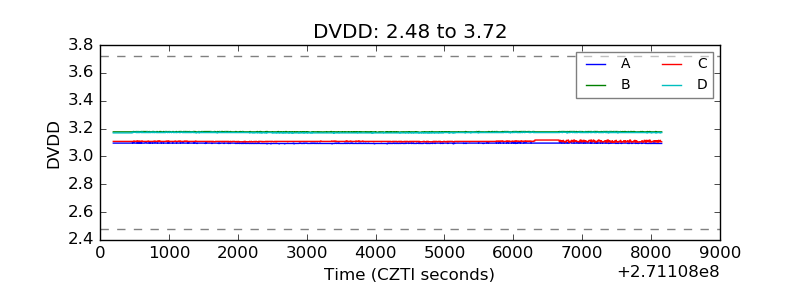 |
| Temperature 1 | 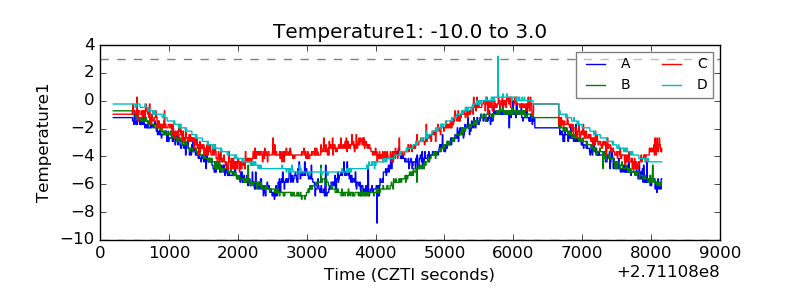 |
| Veto HV Monitor | 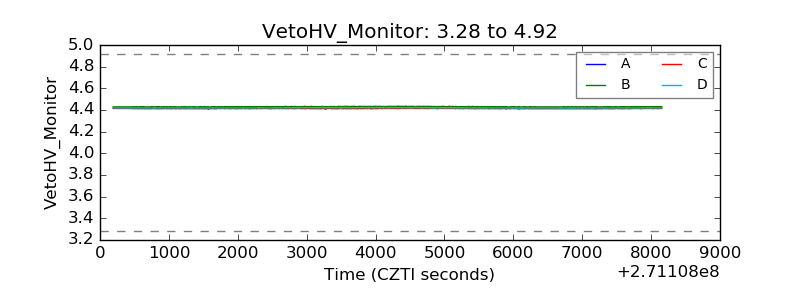 |
| Veto LLD | 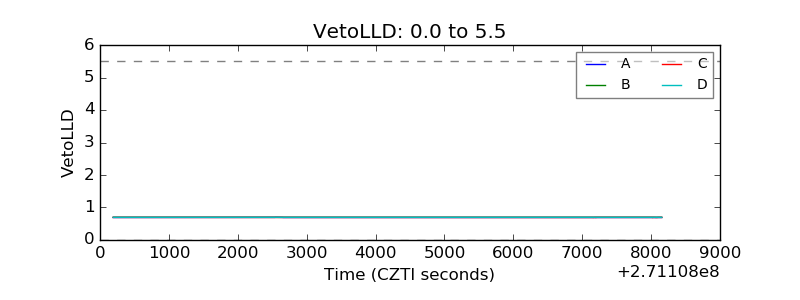 |
| Alpha Counter | 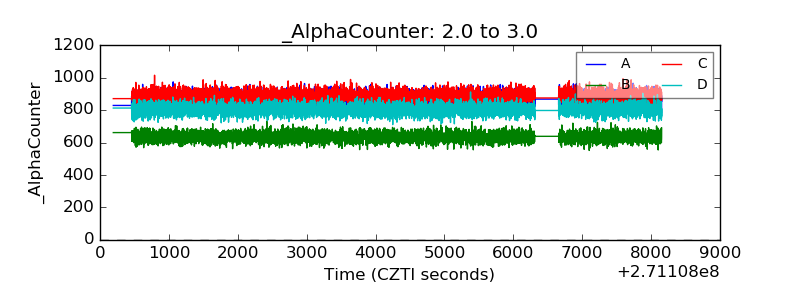 |
| _CPM_Rate | 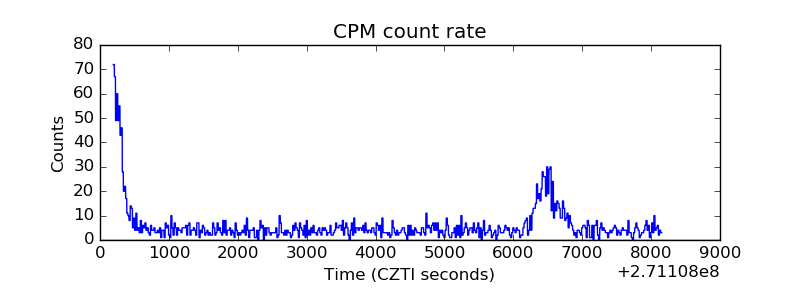 |
| CZT Counter |  |
| +2.5 Volts monitor |  |
| +5 Volts monitor |  |
| _ROLL_ROT | 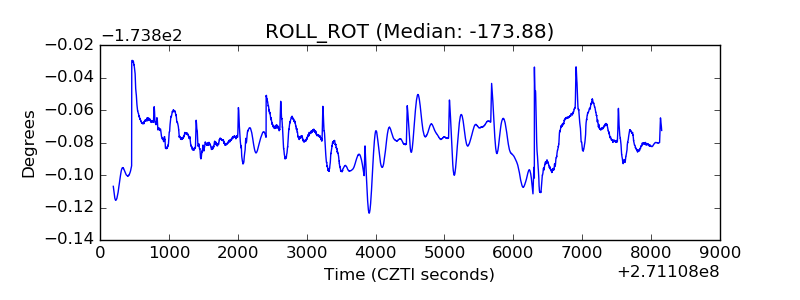 |
| _Roll_DEC | 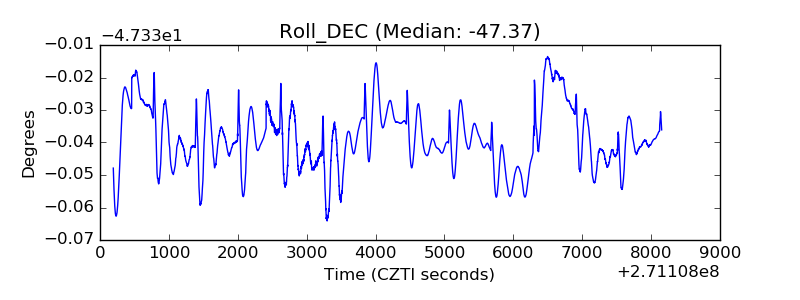 |
| _Roll_RA | 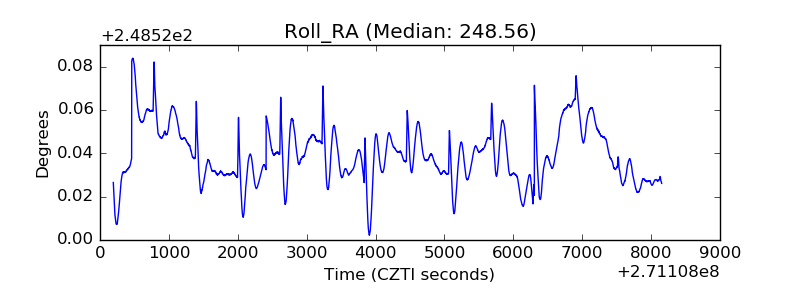 |
| Veto Counter | 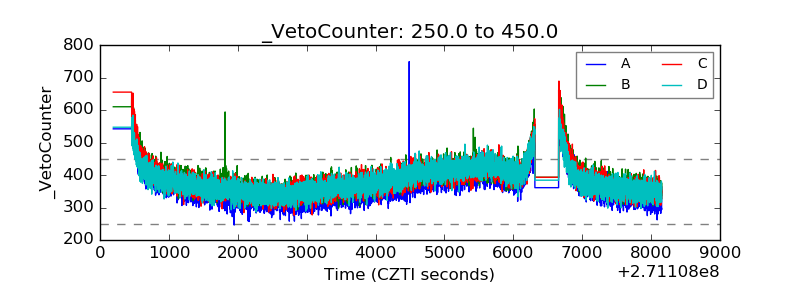 |