| Param | Original file | Final file |
|---|---|---|
| Filename | modeM0/AS1T02_076T01_9000002274_15420cztM0_level2.evt | modeM0/AS1T02_076T01_9000002274_15420cztM0_level2_quad_clean.evt |
| Size (bytes) | 672,736,320 | 118,987,200 |
| Size | 641.6 MB | 113.5 MB |
| Events in quadrant A | 4,337,853 | 773,922 |
| Events in quadrant B | 3,974,781 | 784,696 |
| Events in quadrant C | 4,878,250 | 761,656 |
| Events in quadrant D | 6,641,653 | 727,058 |
| Mode M0 | |||
|---|---|---|---|
| Quadrant | BADHDUFLAG | Total packets | Discarded packets |
| A | 0 | 18213 | 3 |
| B | 0 | 17053 | 2 |
| C | 0 | 20003 | 2 |
| D | 0 | 25293 | 2 |
| Mode SS | |||
|---|---|---|---|
| Quadrant | BADHDUFLAG | Total packets | Discarded packets |
| A | 0 | 166 | 0 |
| B | 0 | 166 | 0 |
| C | 0 | 166 | 0 |
| D | 0 | 166 | 0 |
| Mode M9 | |||
|---|---|---|---|
| Quadrant | BADHDUFLAG | Total packets | Discarded packets |
| A | 0 | 6 | 0 |
| B | 0 | 6 | 0 |
| C | 0 | 6 | 0 |
| D | 0 | 6 | 0 |
| Quadrant | Total seconds | Saturated seconds | Saturation percentage |
|---|---|---|---|
| A | 7994 | 151 | 1.888917% |
| B | 7994 | 83 | 1.038279% |
| C | 7994 | 216 | 2.702027% |
| D | 7994 | 356 | 4.453340% |
Noise dominated data is calculated using 1-second bins in cleaned event files. If a bin has >2000 counts, and if more than 50% of those come from <1% of pixels, then it is considered to be noise-dominated and hence unusable.
| Quadrant | # 1 sec bins | Bins with >0 counts | Bins with >2000 counts | High rate bins dominated by noise | Noise dominated (total time) | Noise dominated (detector-on time) | Marked lightcurve |
|---|---|---|---|---|---|---|---|
| A | 8675 | 7997 | 78 | 78 | 0.90% | 0.98% | 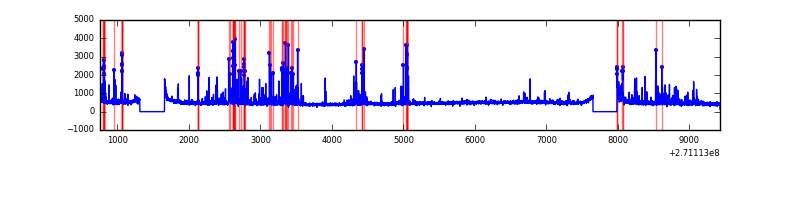 |
| B | 8675 | 7997 | 14 | 14 | 0.16% | 0.18% | 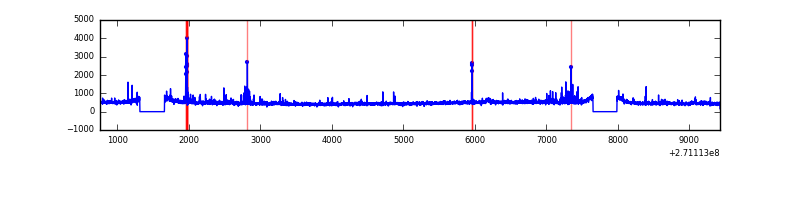 |
| C | 8675 | 7997 | 135 | 135 | 1.56% | 1.69% | 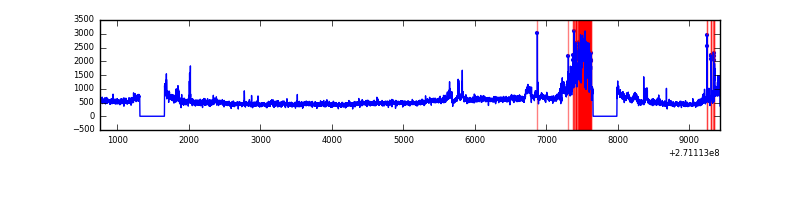 |
| D | 8675 | 7997 | 169 | 169 | 1.95% | 2.11% | 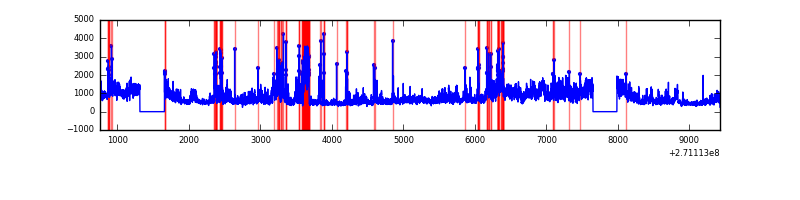 |
Top three noisy pixels from each quadrant. If the there are fewer than three noisy pixels in the level2.evt file, extra rows are filled as -1
| Pixel properties | Quadrant properties | ||||||
|---|---|---|---|---|---|---|---|
| Quadrant | DetID | PixID | Counts | Sigma | Mean | Median | Sigma |
| A | 14 | 238 | 364039 | 1896.19 | 943 | 921 | 191.5 |
| A | 14 | 237 | 226191 | 1176.36 | 943 | 921 | 191.5 |
| A | 13 | 248 | 73462 | 378.81 | 943 | 921 | 191.5 |
| B | 10 | 245 | 50820 | 276.29 | 947 | 923 | 180.6 |
| B | 7 | 220 | 40745 | 220.5 | 947 | 923 | 180.6 |
| B | 0 | 219 | 38074 | 205.71 | 947 | 923 | 180.6 |
| C | 3 | 233 | 1327510 | 6375.02 | 901 | 904 | 208.1 |
| C | 10 | 22 | 10367 | 45.47 | 901 | 904 | 208.1 |
| C | 8 | 128 | 10278 | 45.05 | 901 | 904 | 208.1 |
| D | 13 | 122 | 2301106 | 10381.67 | 903 | 874 | 221.6 |
| D | 5 | 222 | 602643 | 2715.97 | 903 | 874 | 221.6 |
| D | 2 | 33 | 209942 | 943.59 | 903 | 874 | 221.6 |
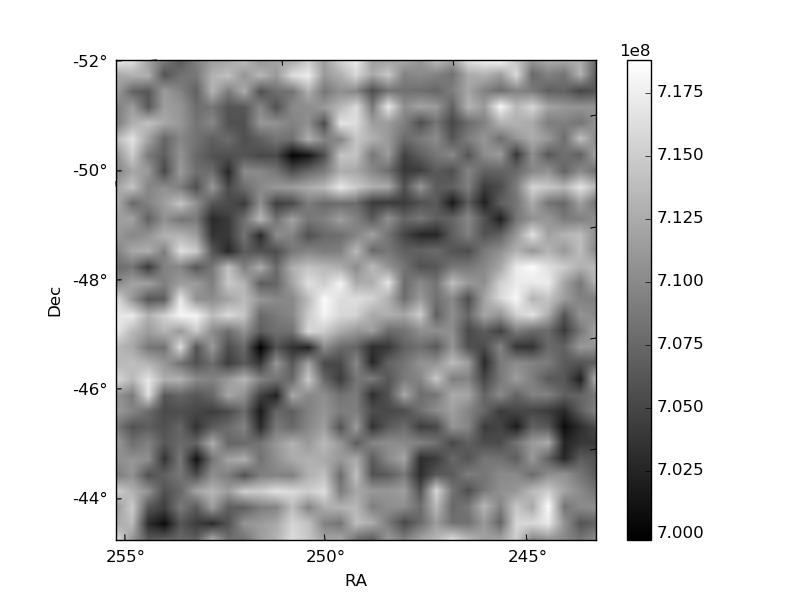
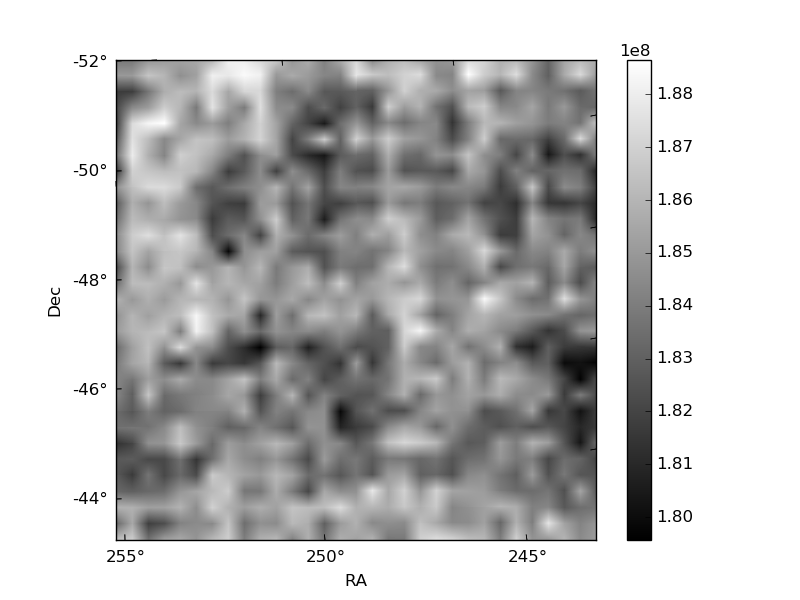
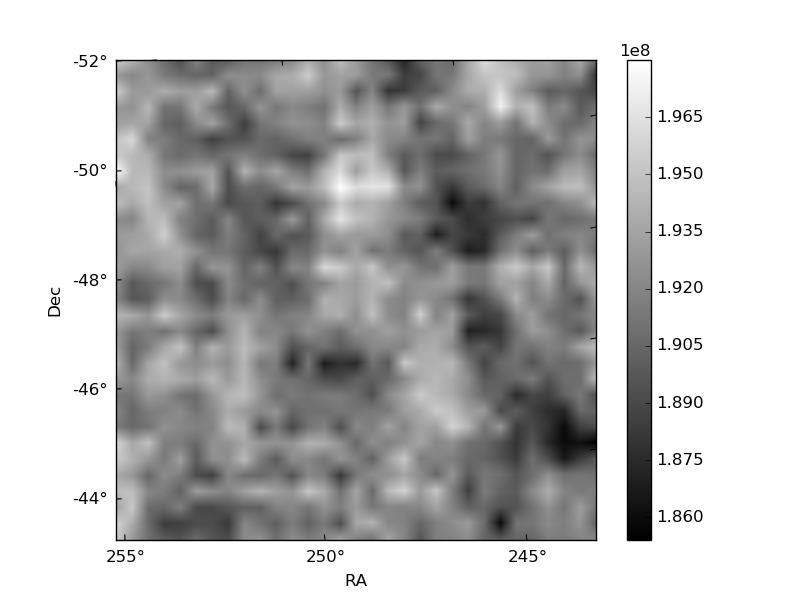
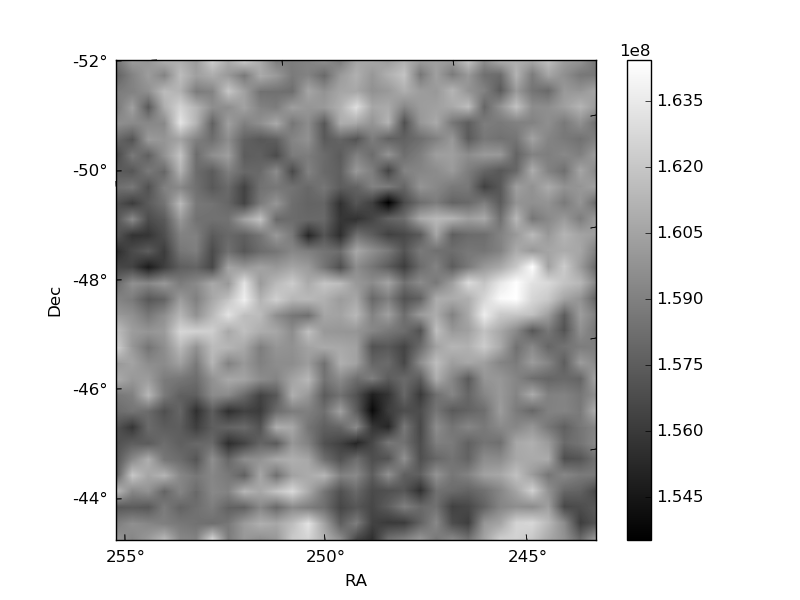
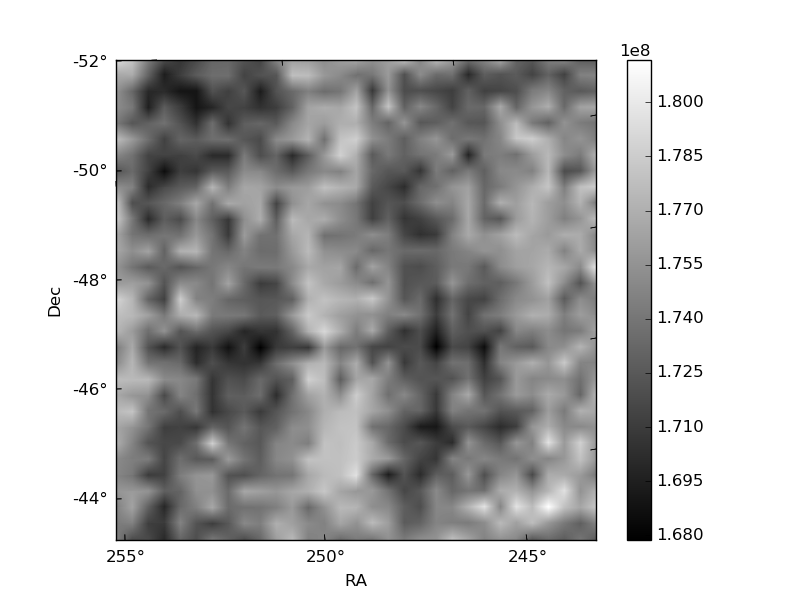
Histogram calculated using DETX and DETY for each event in the final _common_clean file
| Quadrant A | 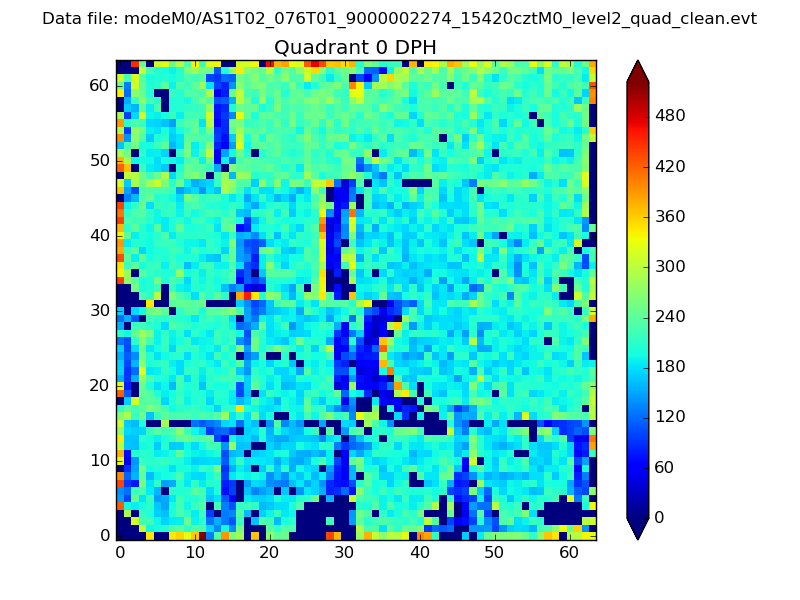 |
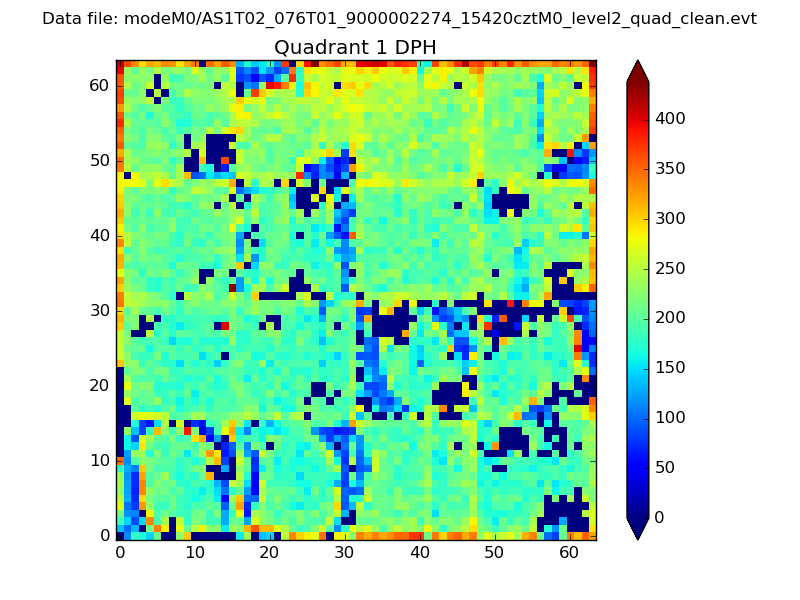 |
Quadrant B |
|---|---|---|---|
| Quadrant D | 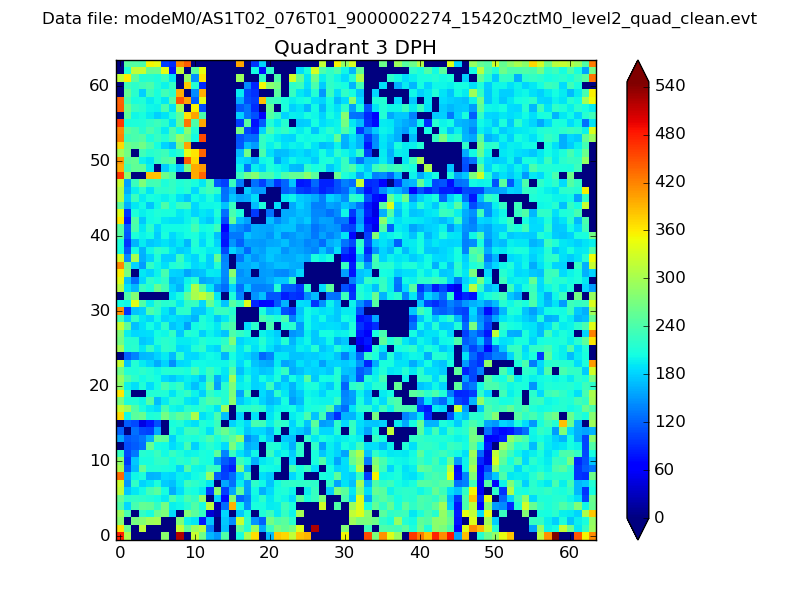 |
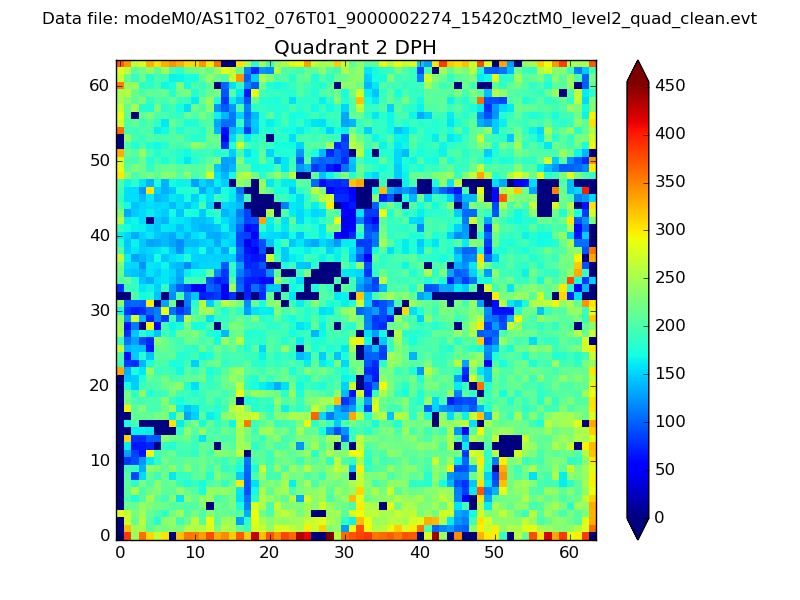 |
Quadrant C |
| Plot type | Count rate plots | Images |
|---|---|---|
| Comparison with Poisson distribution Blue bars denote a histogram of data divided into 1 sec bins. Red curve is a Poisson curve with rate = median count rate of data. |
 |
 |
| Quadrant-wise count rates Data is divided into 100 sec bins |
 |
|
| Module-wise count rates for Quadrant A Data is divided into 100 sec bins |
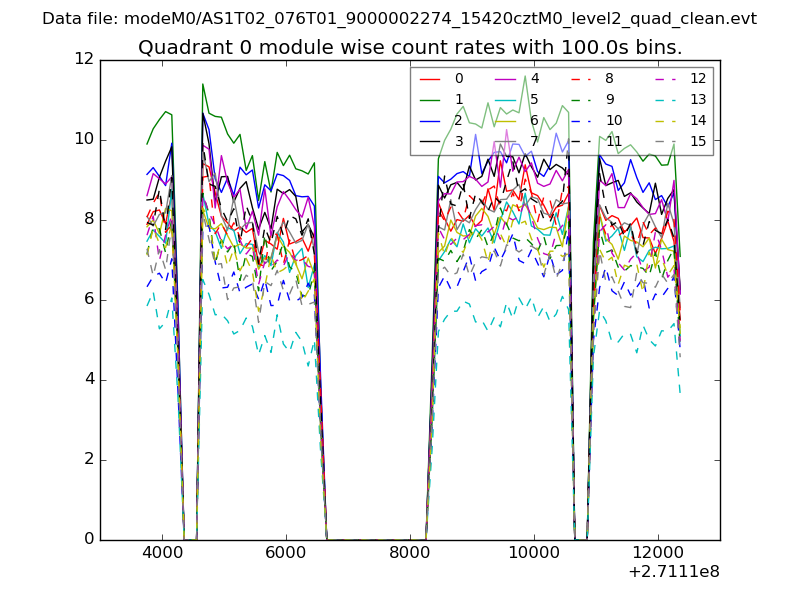 |
 |
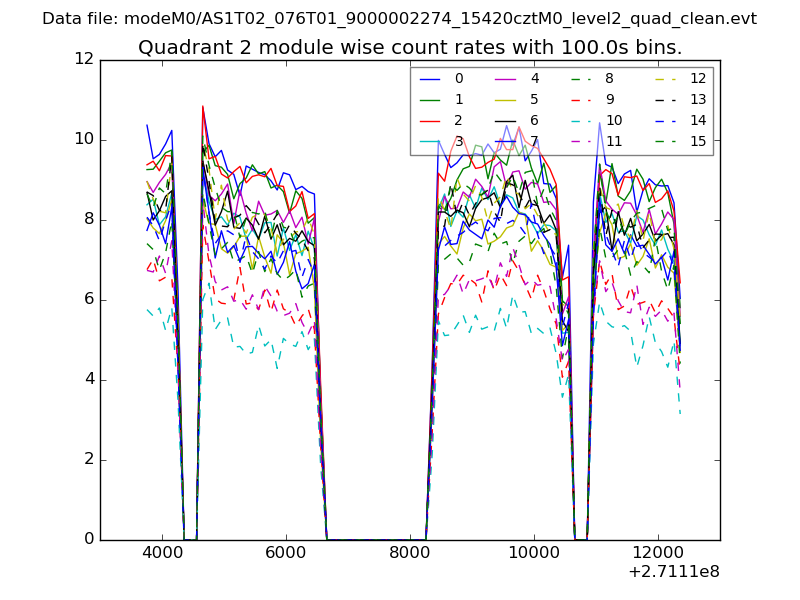
| Module-wise count rates for Quadrant B Data is divided into 100 sec bins |
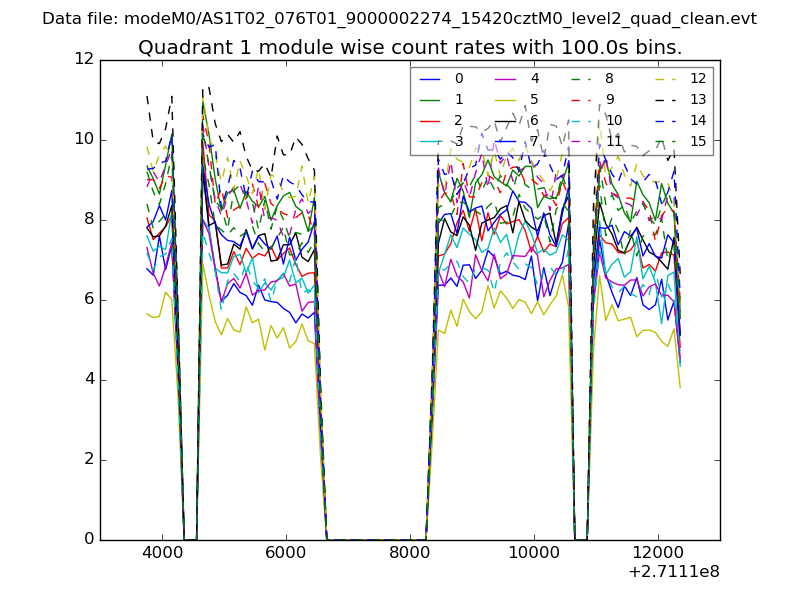 |
 |
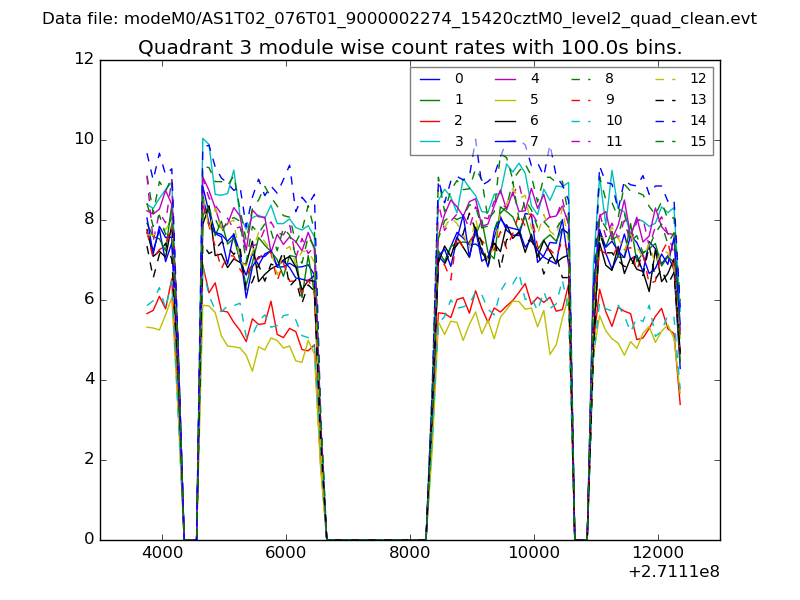
| Module-wise count rates for Quadrant C Data is divided into 100 sec bins |
 |
 |
| Module-wise count rates for Quadrant D Data is divided into 100 sec bins |
 |
 |
| Parameter | Plot |
|---|---|
| CZT HV Monitor | 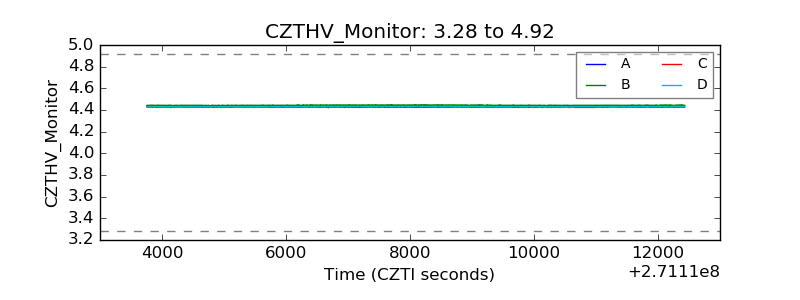 |
| D_VDD | 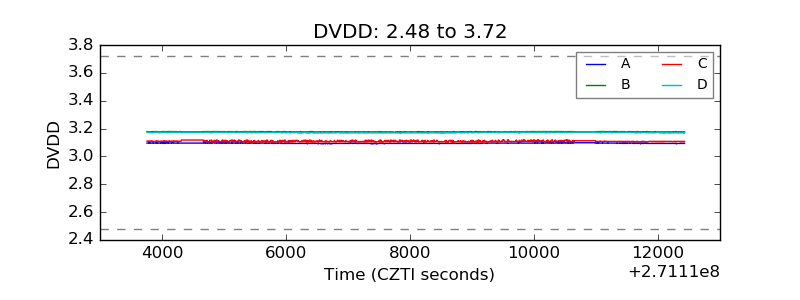 |
| Temperature 1 | 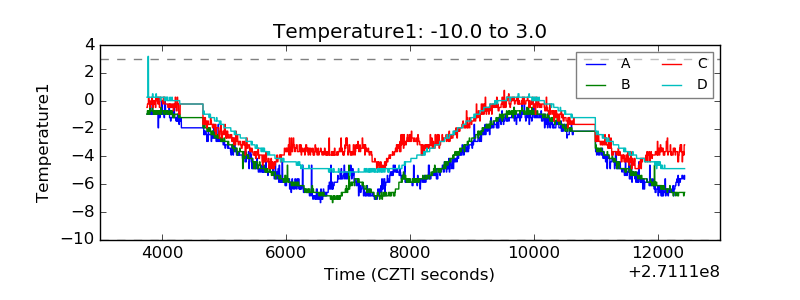 |
| Veto HV Monitor | 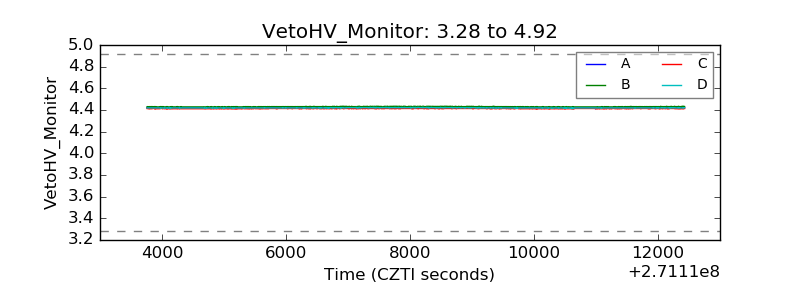 |
| Veto LLD | 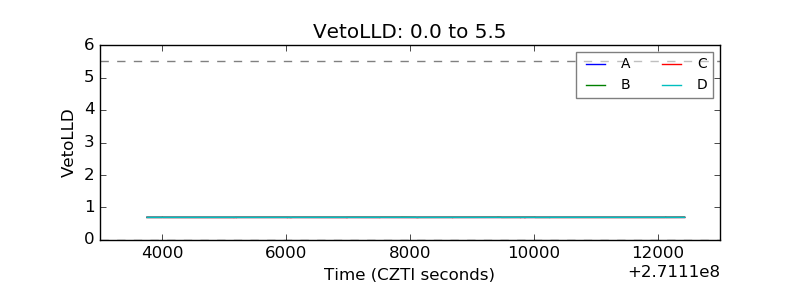 |
| Alpha Counter | 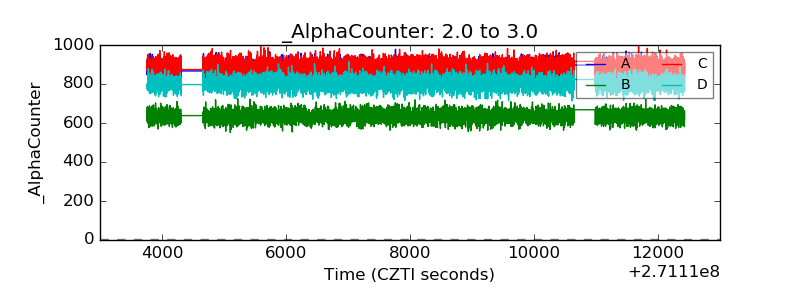 |
| _CPM_Rate |  |
| CZT Counter | 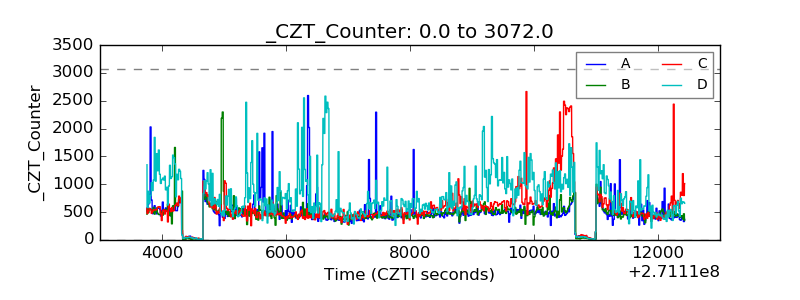 |
| +2.5 Volts monitor |  |
| +5 Volts monitor |  |
| _ROLL_ROT | 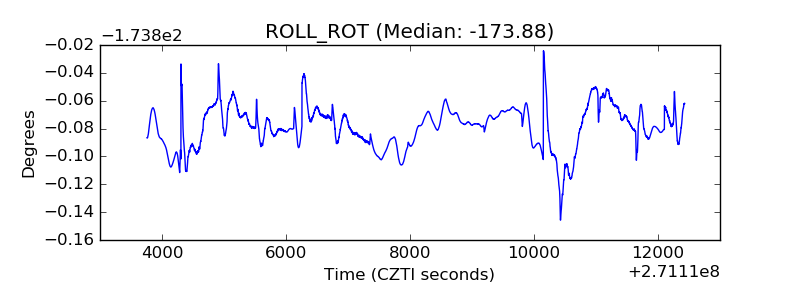 |
| _Roll_DEC | 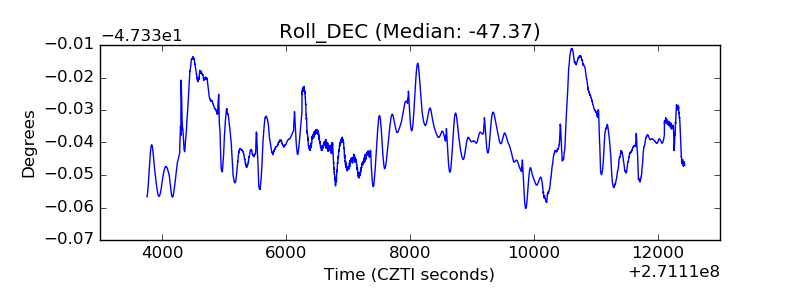 |
| _Roll_RA | 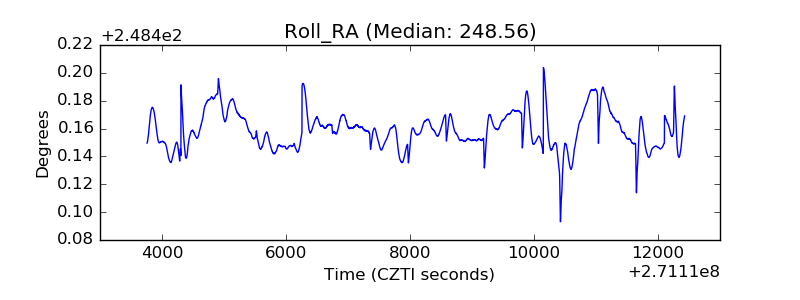 |
| Veto Counter | 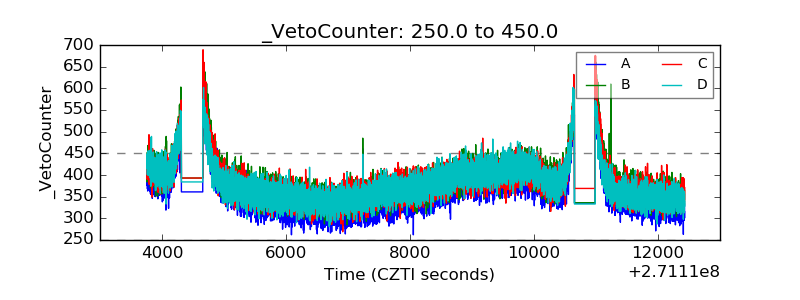 |