| Param | Original file | Final file |
|---|---|---|
| Filename | modeM0/AS1T02_076T01_9000002274_15423cztM0_level2.evt | modeM0/AS1T02_076T01_9000002274_15423cztM0_level2_quad_clean.evt |
| Size (bytes) | 1,445,993,280 | 240,768,000 |
| Size | 1.3 GB | 229.6 MB |
| Events in quadrant A | 9,977,964 | 1,509,739 |
| Events in quadrant B | 9,312,960 | 1,537,616 |
| Events in quadrant C | 11,976,770 | 1,499,049 |
| Events in quadrant D | 11,250,330 | 1,445,073 |
| Mode M0 | |||
|---|---|---|---|
| Quadrant | BADHDUFLAG | Total packets | Discarded packets |
| A | 0 | 42414 | 5 |
| B | 0 | 39863 | 4 |
| C | 0 | 47100 | 4 |
| D | 0 | 46447 | 4 |
| Mode SS | |||
|---|---|---|---|
| Quadrant | BADHDUFLAG | Total packets | Discarded packets |
| A | 0 | 384 | 0 |
| B | 0 | 384 | 0 |
| C | 0 | 384 | 0 |
| D | 0 | 384 | 0 |
| Mode M9 | |||
|---|---|---|---|
| Quadrant | BADHDUFLAG | Total packets | Discarded packets |
| A | 0 | 23 | 0 |
| B | 0 | 23 | 0 |
| C | 0 | 23 | 0 |
| D | 0 | 23 | 0 |
| Quadrant | Total seconds | Saturated seconds | Saturation percentage |
|---|---|---|---|
| A | 18878 | 403 | 2.134760% |
| B | 18878 | 165 | 0.874033% |
| C | 18878 | 769 | 4.073525% |
| D | 18878 | 282 | 1.493802% |
Noise dominated data is calculated using 1-second bins in cleaned event files. If a bin has >2000 counts, and if more than 50% of those come from <1% of pixels, then it is considered to be noise-dominated and hence unusable.
| Quadrant | # 1 sec bins | Bins with >0 counts | Bins with >2000 counts | High rate bins dominated by noise | Noise dominated (total time) | Noise dominated (detector-on time) | Marked lightcurve |
|---|---|---|---|---|---|---|---|
| A | 21139 | 18883 | 179 | 179 | 0.85% | 0.95% | 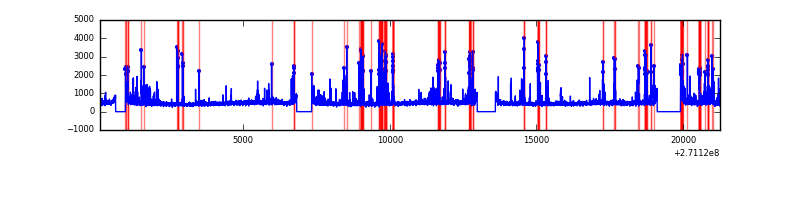 |
| B | 21139 | 18883 | 7 | 7 | 0.03% | 0.04% | 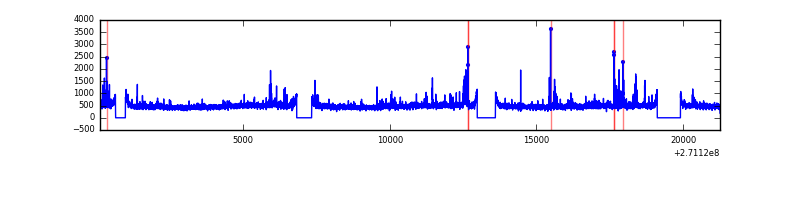 |
| C | 21139 | 18883 | 482 | 482 | 2.28% | 2.55% | 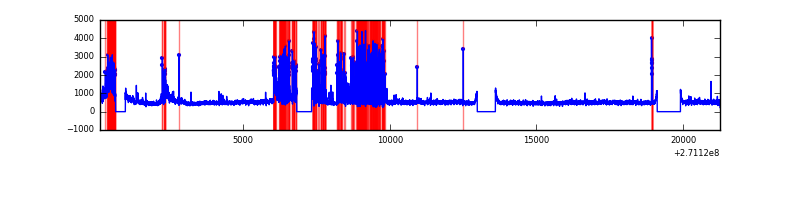 |
| D | 21139 | 18883 | 91 | 91 | 0.43% | 0.48% | 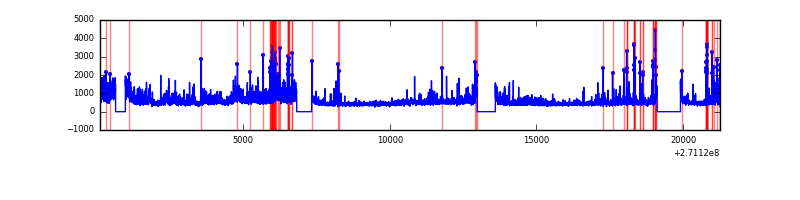 |
Top three noisy pixels from each quadrant. If the there are fewer than three noisy pixels in the level2.evt file, extra rows are filled as -1
| Pixel properties | Quadrant properties | ||||||
|---|---|---|---|---|---|---|---|
| Quadrant | DetID | PixID | Counts | Sigma | Mean | Median | Sigma |
| A | 14 | 238 | 1044213 | 2366.93 | 2200 | 2150 | 440.3 |
| A | 14 | 237 | 315840 | 712.51 | 2200 | 2150 | 440.3 |
| A | 9 | 143 | 74046 | 163.3 | 2200 | 2150 | 440.3 |
| B | 3 | 209 | 115152 | 268.18 | 2223 | 2170 | 421.3 |
| B | 4 | 142 | 99820 | 231.79 | 2223 | 2170 | 421.3 |
| B | 0 | 189 | 90511 | 209.69 | 2223 | 2170 | 421.3 |
| C | 3 | 233 | 3606226 | 7395.03 | 2117 | 2127 | 487.4 |
| C | 3 | 9 | 49341 | 96.88 | 2117 | 2127 | 487.4 |
| C | 7 | 247 | 34946 | 67.34 | 2117 | 2127 | 487.4 |
| D | 13 | 122 | 2082904 | 3955.25 | 2142 | 2074 | 526.1 |
| D | 5 | 222 | 651440 | 1234.32 | 2142 | 2074 | 526.1 |
| D | 2 | 33 | 134661 | 252.02 | 2142 | 2074 | 526.1 |
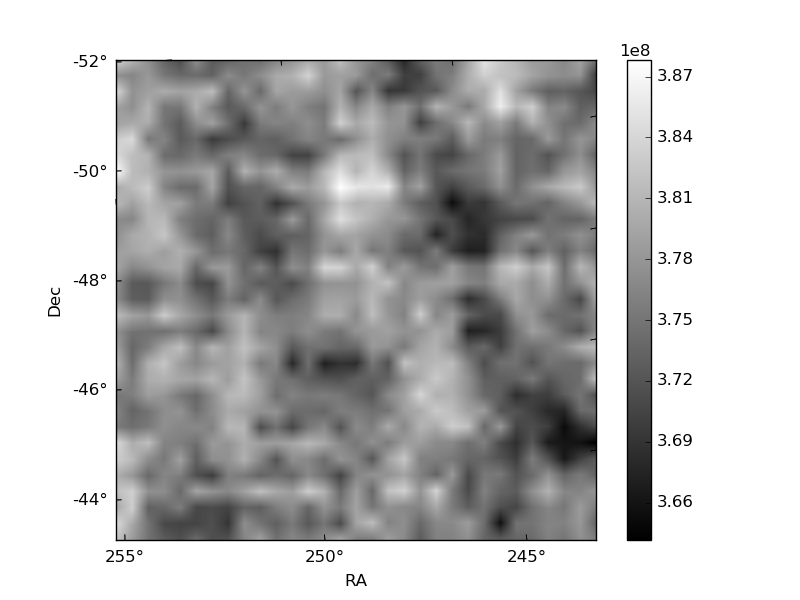
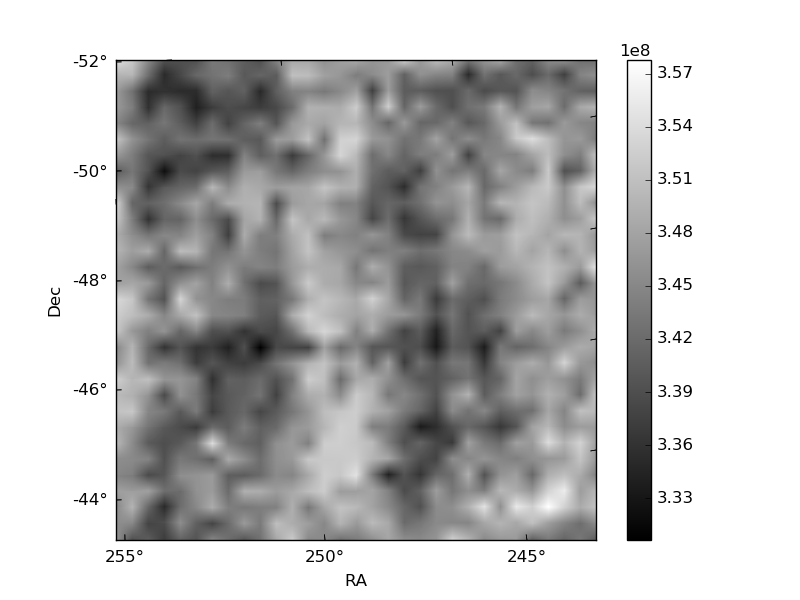
Histogram calculated using DETX and DETY for each event in the final _common_clean file
| Quadrant A | 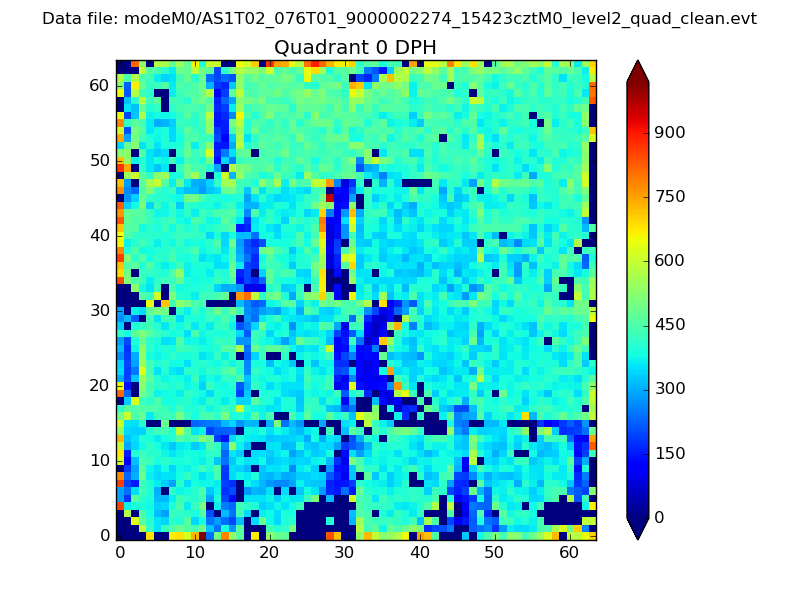 |
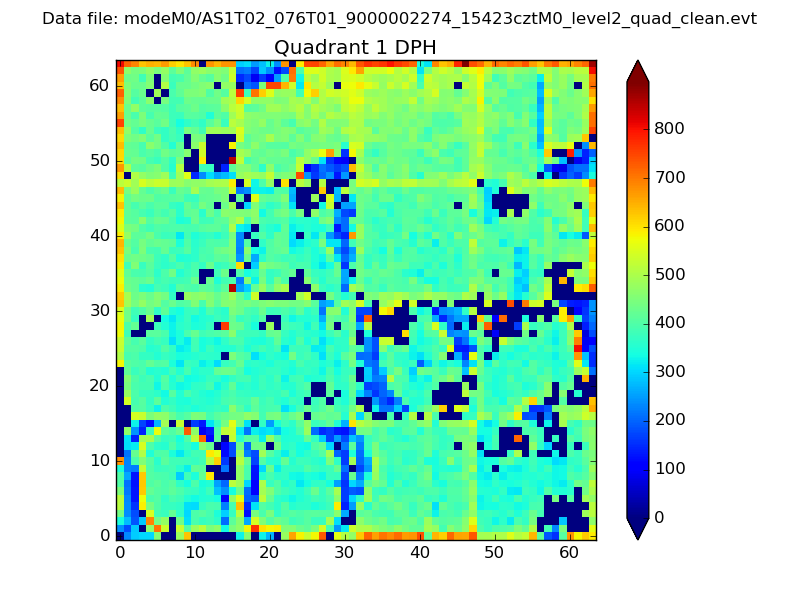 |
Quadrant B |
|---|---|---|---|
| Quadrant D | 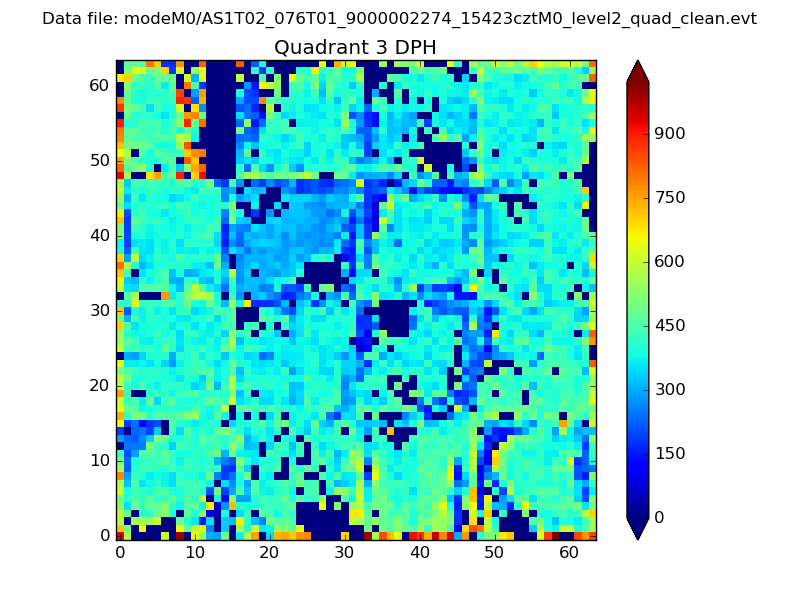 |
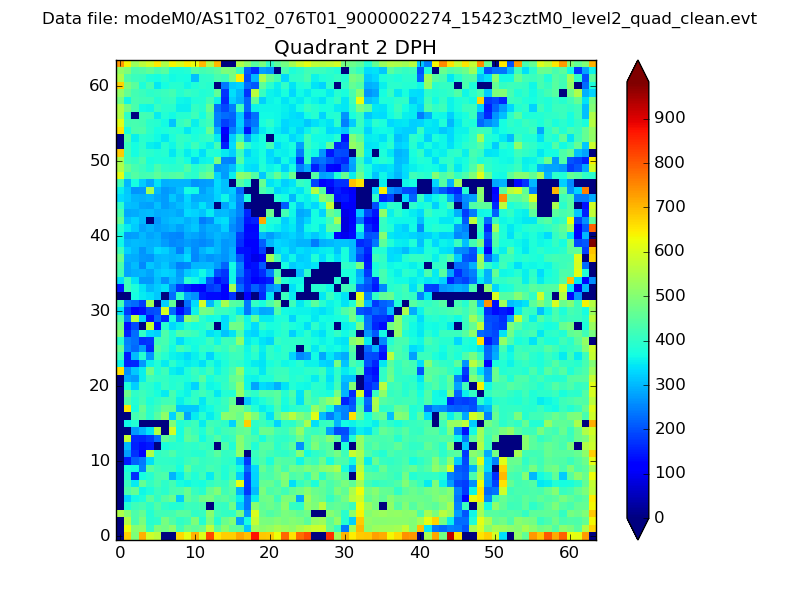 |
Quadrant C |
| Plot type | Count rate plots | Images |
|---|---|---|
| Comparison with Poisson distribution Blue bars denote a histogram of data divided into 1 sec bins. Red curve is a Poisson curve with rate = median count rate of data. |
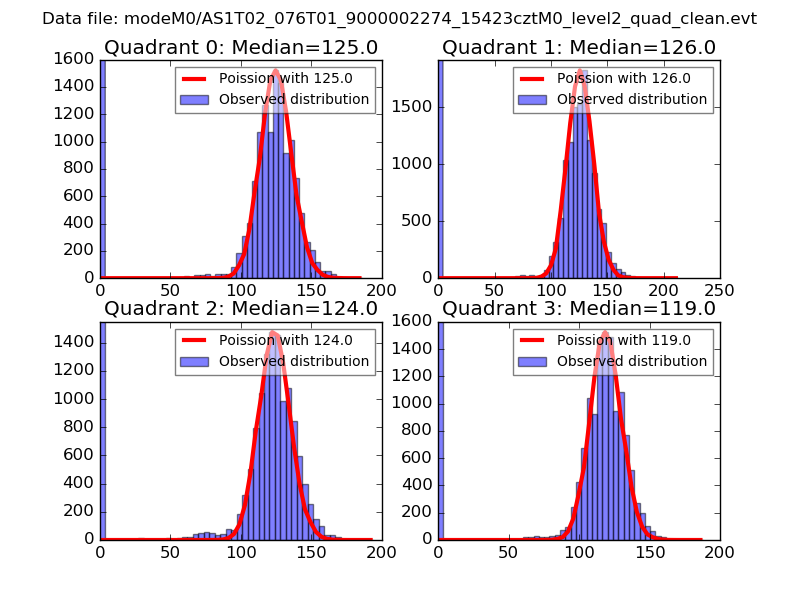 |
 |
| Quadrant-wise count rates Data is divided into 100 sec bins |
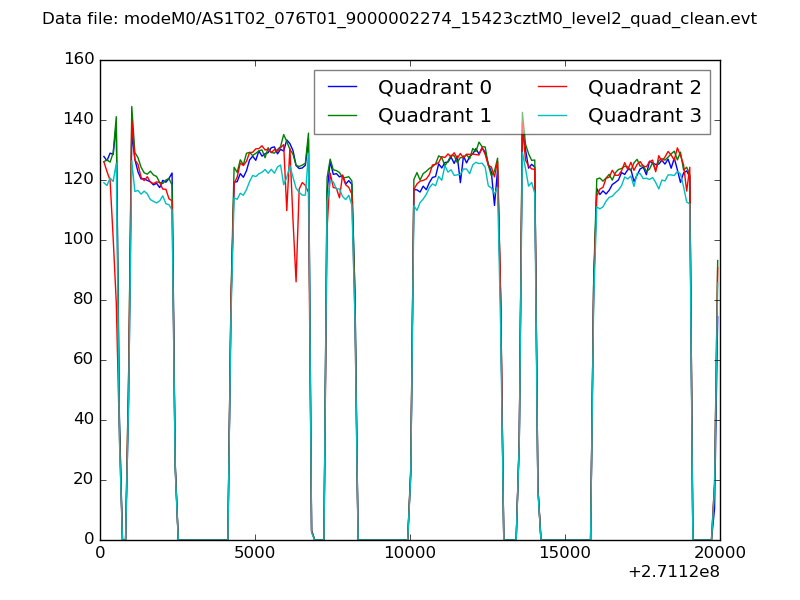 |
|
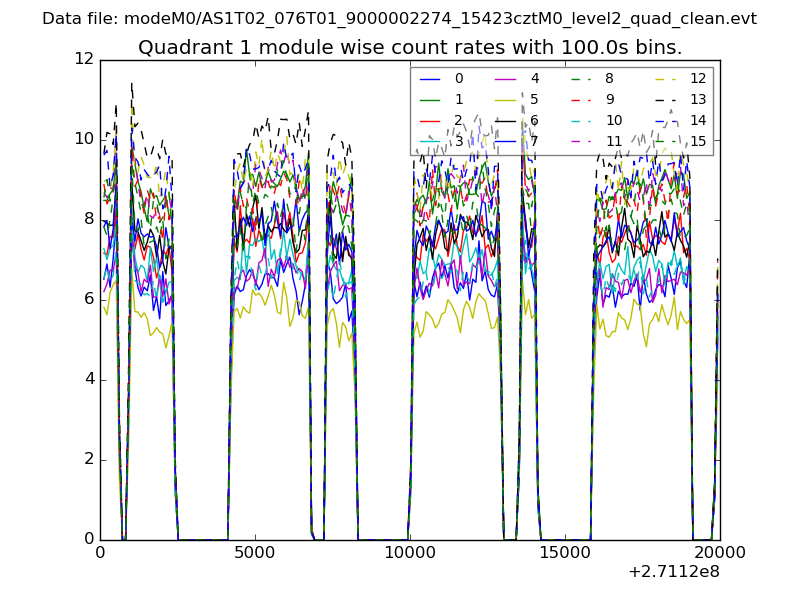
| Module-wise count rates for Quadrant A Data is divided into 100 sec bins |
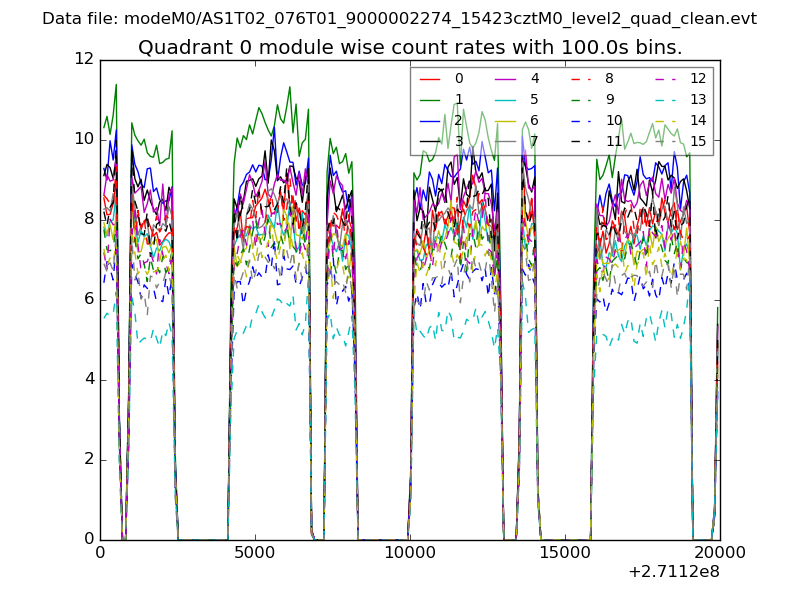 |
 |
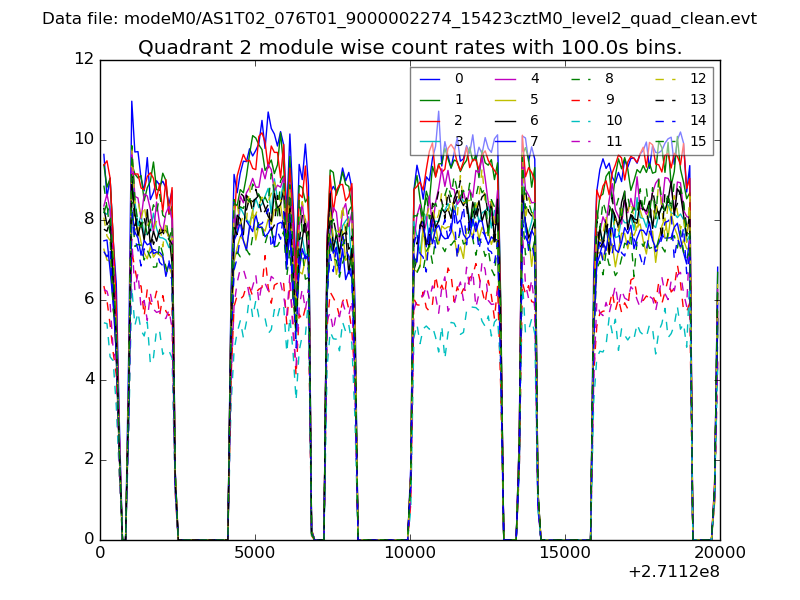
| Module-wise count rates for Quadrant B Data is divided into 100 sec bins |
 |
 |
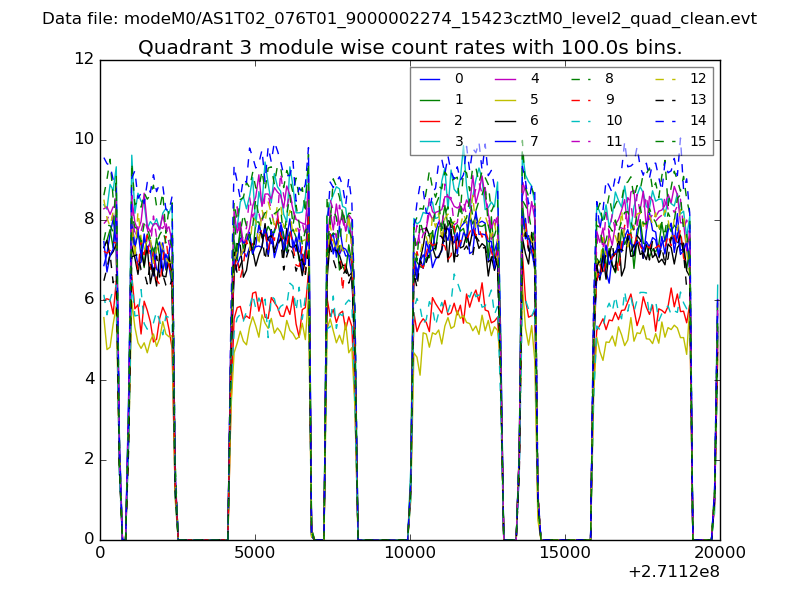
| Module-wise count rates for Quadrant C Data is divided into 100 sec bins |
 |
 |
| Module-wise count rates for Quadrant D Data is divided into 100 sec bins |
 |
 |
| Parameter | Plot |
|---|---|
| CZT HV Monitor | 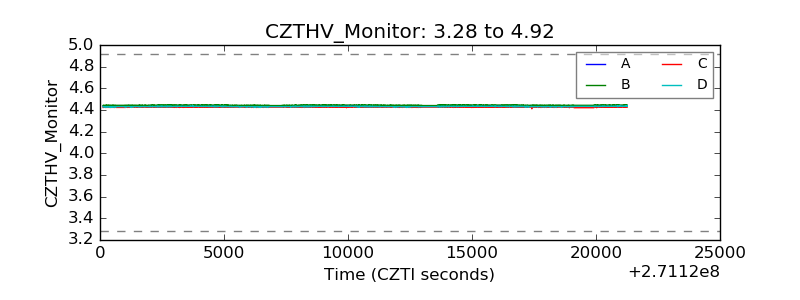 |
| D_VDD | 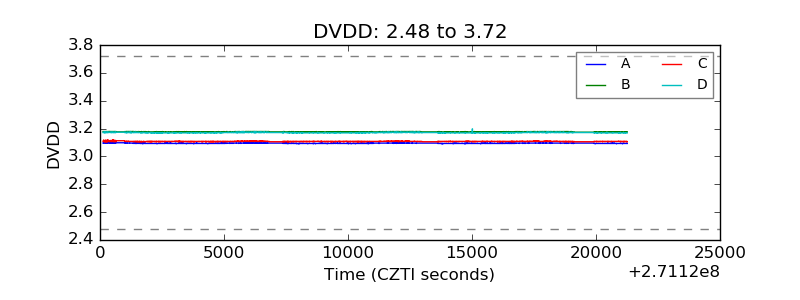 |
| Temperature 1 |  |
| Veto HV Monitor | 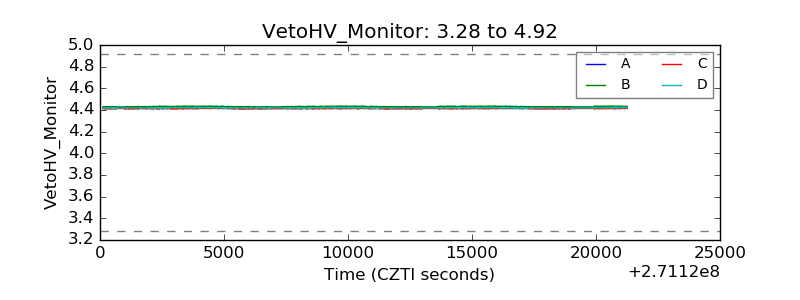 |
| Veto LLD | 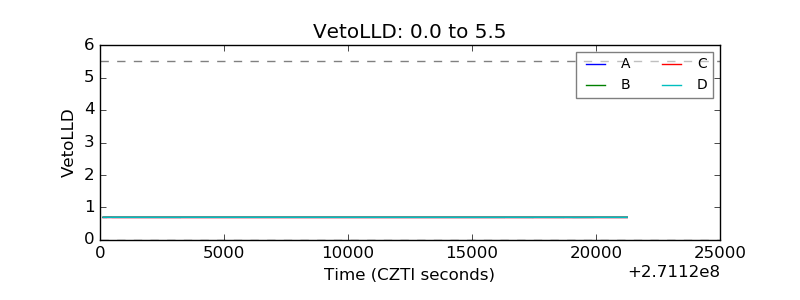 |
| Alpha Counter | 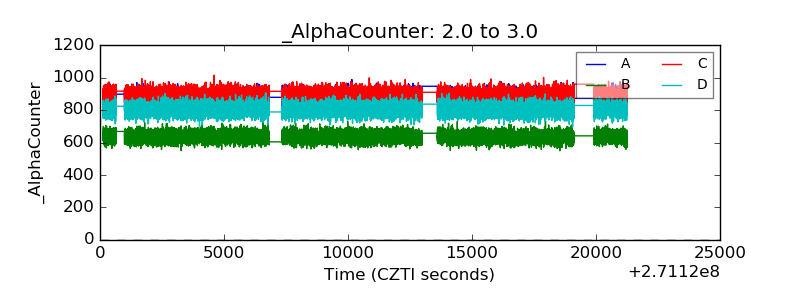 |
| _CPM_Rate | 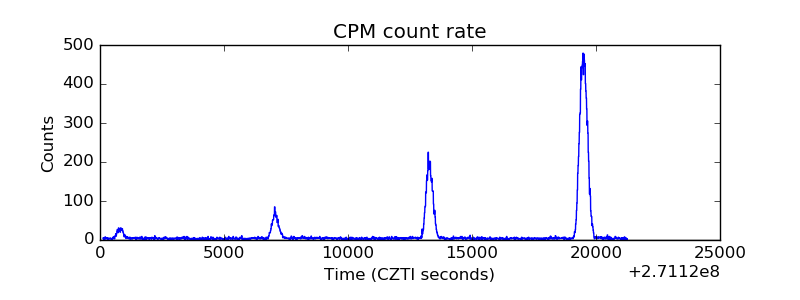 |
| CZT Counter | 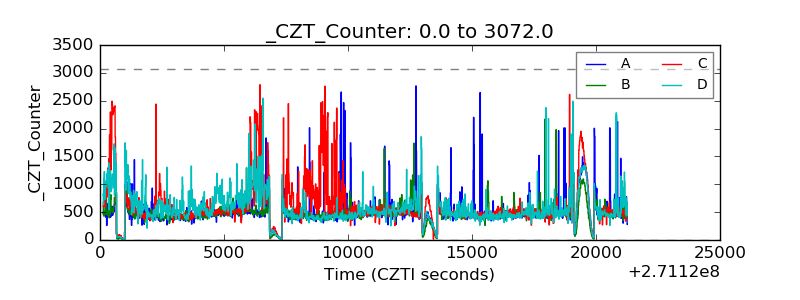 |
| +2.5 Volts monitor |  |
| +5 Volts monitor |  |
| _ROLL_ROT | 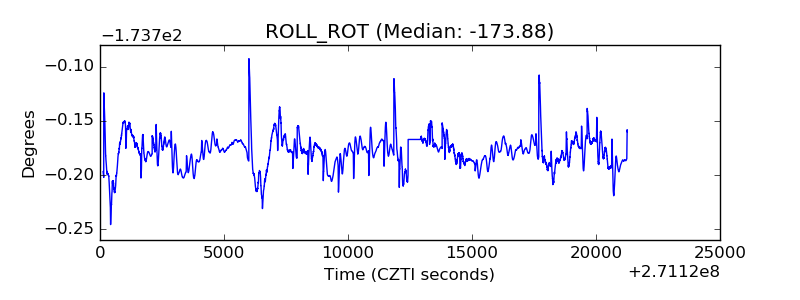 |
| _Roll_DEC | 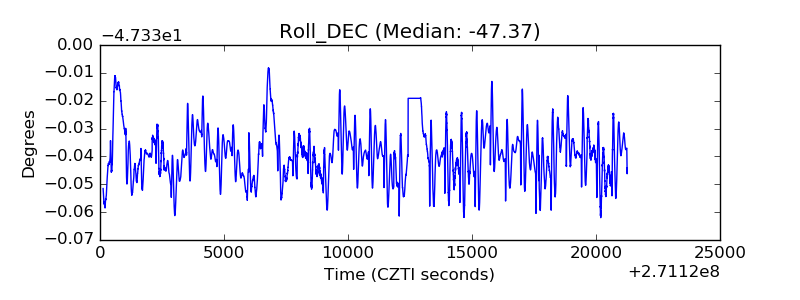 |
| _Roll_RA | 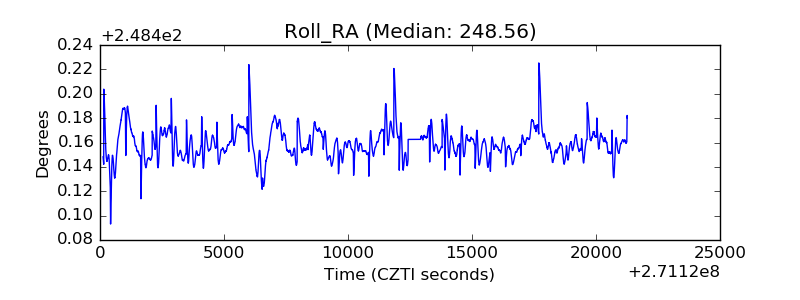 |
| Veto Counter | 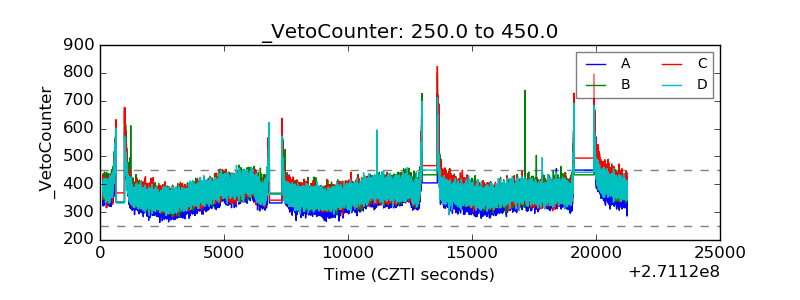 |