| Param | Original file | Final file |
|---|---|---|
| Filename | modeM0/AS1T02_076T01_9000002274_15424cztM0_level2.evt | modeM0/AS1T02_076T01_9000002274_15424cztM0_level2_quad_clean.evt |
| Size (bytes) | 620,182,080 | 85,262,400 |
| Size | 591.5 MB | 81.3 MB |
| Events in quadrant A | 4,435,430 | 517,178 |
| Events in quadrant B | 4,413,608 | 520,818 |
| Events in quadrant C | 3,900,361 | 530,901 |
| Events in quadrant D | 5,527,892 | 494,028 |
| Mode M0 | |||
|---|---|---|---|
| Quadrant | BADHDUFLAG | Total packets | Discarded packets |
| A | 0 | 18058 | 3 |
| B | 0 | 17918 | 2 |
| C | 0 | 15978 | 2 |
| D | 0 | 21461 | 2 |
| Mode SS | |||
|---|---|---|---|
| Quadrant | BADHDUFLAG | Total packets | Discarded packets |
| A | 0 | 152 | 0 |
| B | 0 | 152 | 0 |
| C | 0 | 152 | 0 |
| D | 0 | 152 | 0 |
| Mode M9 | |||
|---|---|---|---|
| Quadrant | BADHDUFLAG | Total packets | Discarded packets |
| A | 0 | 18 | 0 |
| B | 0 | 18 | 0 |
| C | 0 | 18 | 0 |
| D | 0 | 18 | 0 |
| Quadrant | Total seconds | Saturated seconds | Saturation percentage |
|---|---|---|---|
| A | 7458 | 323 | 4.330920% |
| B | 7458 | 321 | 4.304103% |
| C | 7458 | 78 | 1.045857% |
| D | 7458 | 463 | 6.208099% |
Noise dominated data is calculated using 1-second bins in cleaned event files. If a bin has >2000 counts, and if more than 50% of those come from <1% of pixels, then it is considered to be noise-dominated and hence unusable.
| Quadrant | # 1 sec bins | Bins with >0 counts | Bins with >2000 counts | High rate bins dominated by noise | Noise dominated (total time) | Noise dominated (detector-on time) | Marked lightcurve |
|---|---|---|---|---|---|---|---|
| A | 9199 | 7460 | 162 | 162 | 1.76% | 2.17% | 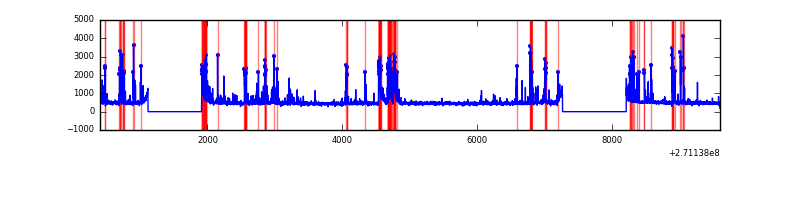 |
| B | 9199 | 7460 | 164 | 164 | 1.78% | 2.20% | 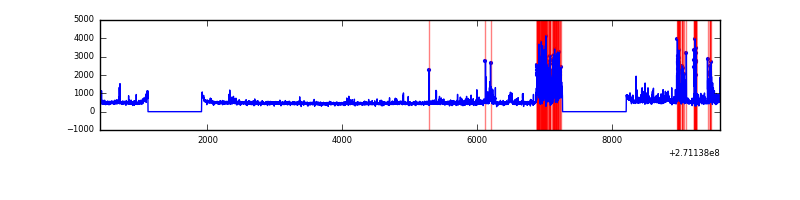 |
| C | 9199 | 7460 | 12 | 12 | 0.13% | 0.16% | 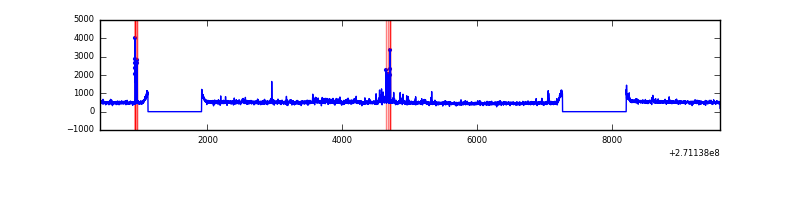 |
| D | 9199 | 7460 | 335 | 335 | 3.64% | 4.49% | 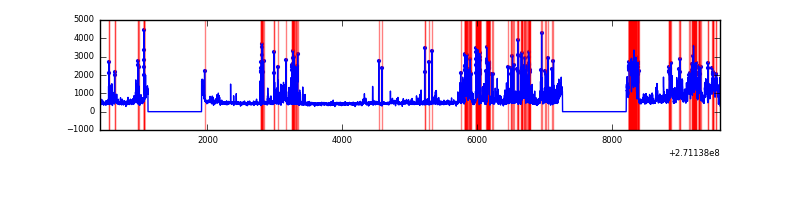 |
Top three noisy pixels from each quadrant. If the there are fewer than three noisy pixels in the level2.evt file, extra rows are filled as -1
| Pixel properties | Quadrant properties | ||||||
|---|---|---|---|---|---|---|---|
| Quadrant | DetID | PixID | Counts | Sigma | Mean | Median | Sigma |
| A | 14 | 238 | 792908 | 4383.02 | 886 | 865 | 180.7 |
| A | 14 | 237 | 187714 | 1033.99 | 886 | 865 | 180.7 |
| A | 12 | 96 | 17245 | 90.64 | 886 | 865 | 180.7 |
| B | 10 | 245 | 790230 | 4658.73 | 889 | 865 | 169.4 |
| B | 0 | 190 | 28653 | 164.0 | 889 | 865 | 169.4 |
| B | 4 | 142 | 26593 | 151.84 | 889 | 865 | 169.4 |
| C | 3 | 233 | 428167 | 2115.04 | 877 | 881 | 202.0 |
| C | 7 | 247 | 35593 | 171.82 | 877 | 881 | 202.0 |
| C | 10 | 22 | 7122 | 30.89 | 877 | 881 | 202.0 |
| D | 13 | 122 | 1244147 | 5956.85 | 856 | 831 | 208.7 |
| D | 5 | 222 | 668773 | 3200.18 | 856 | 831 | 208.7 |
| D | 7 | 38 | 166651 | 794.46 | 856 | 831 | 208.7 |
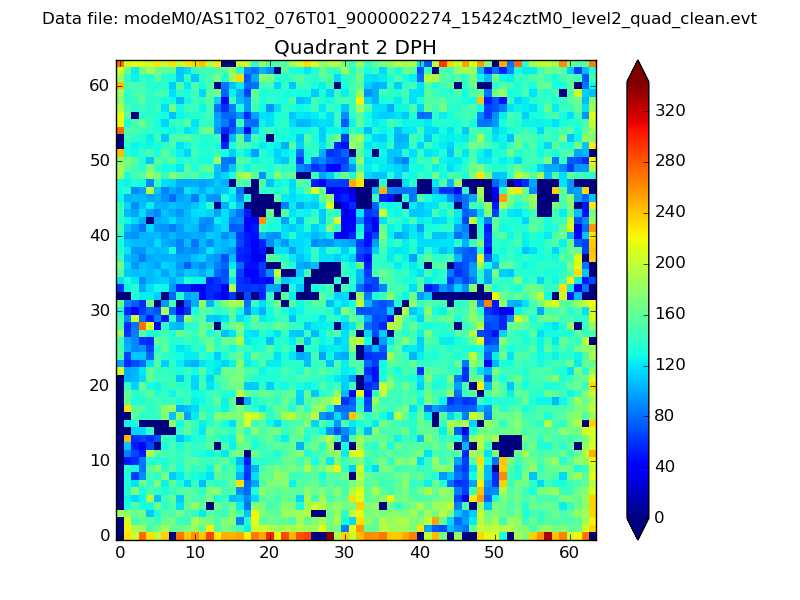
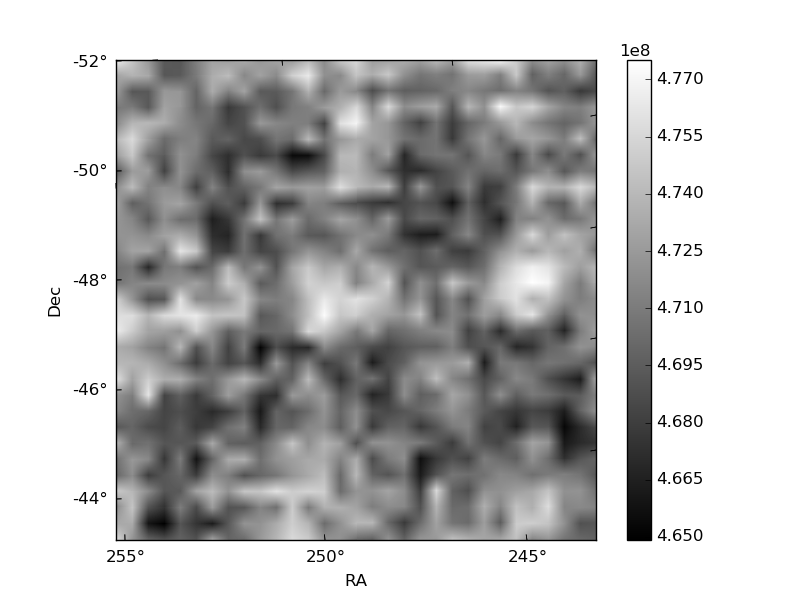
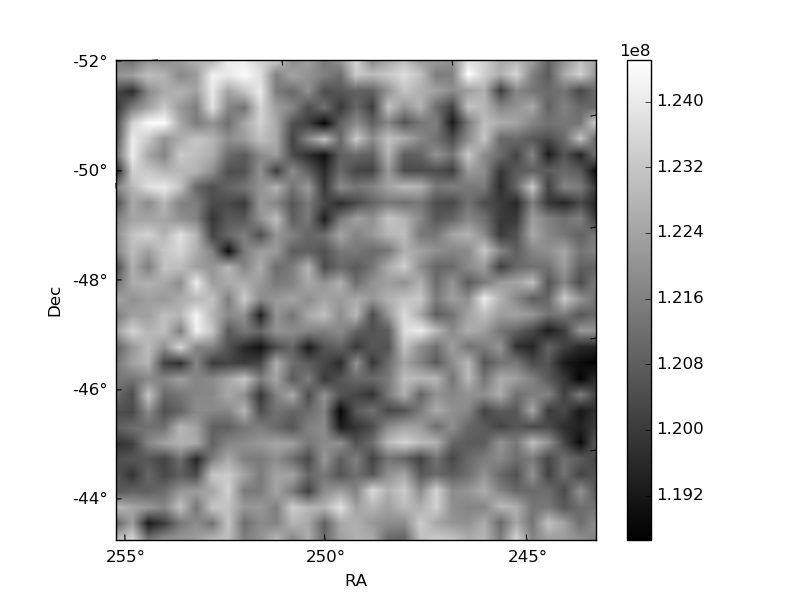
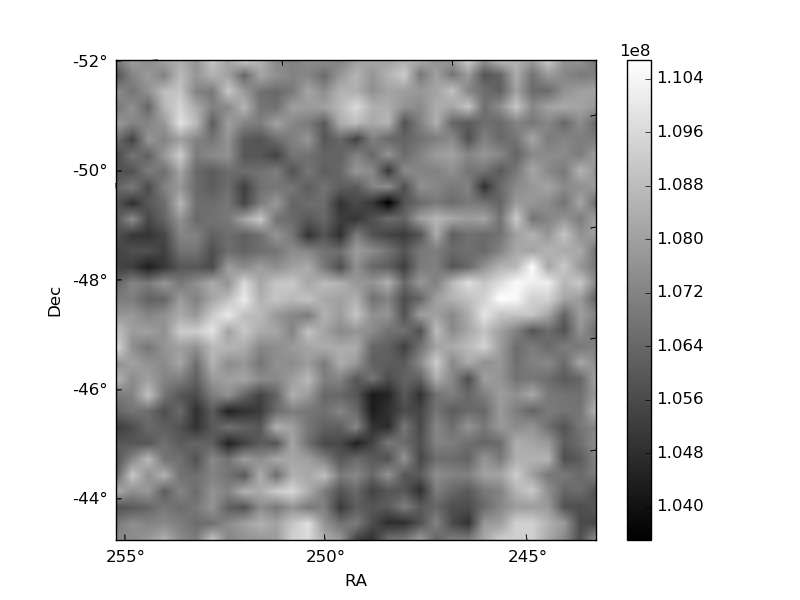
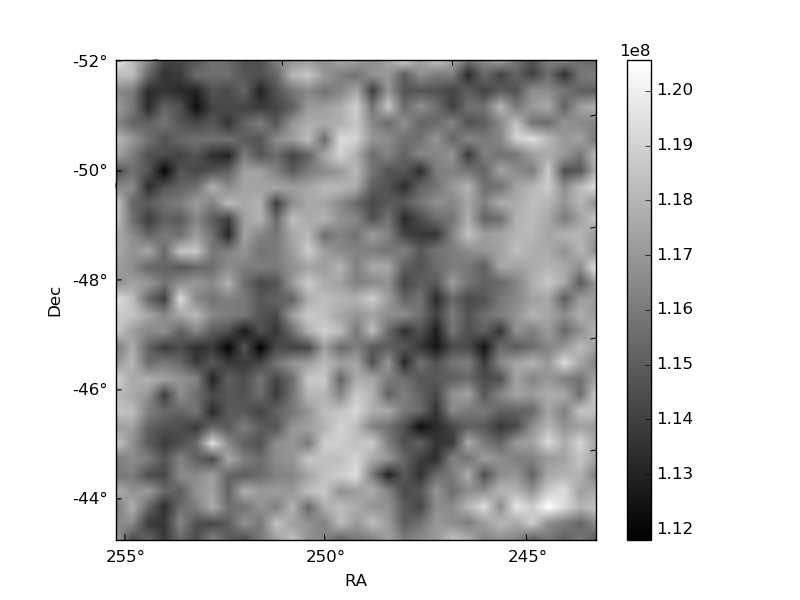
Histogram calculated using DETX and DETY for each event in the final _common_clean file
| Quadrant A | 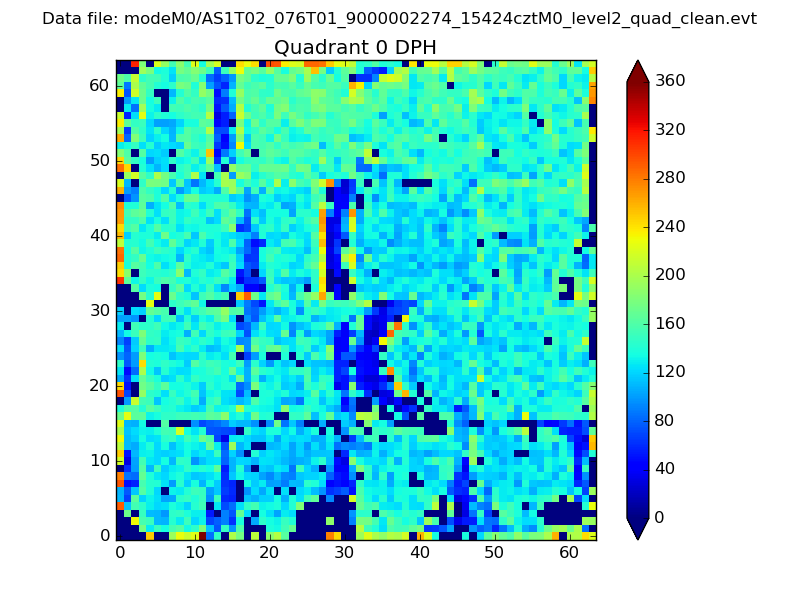 |
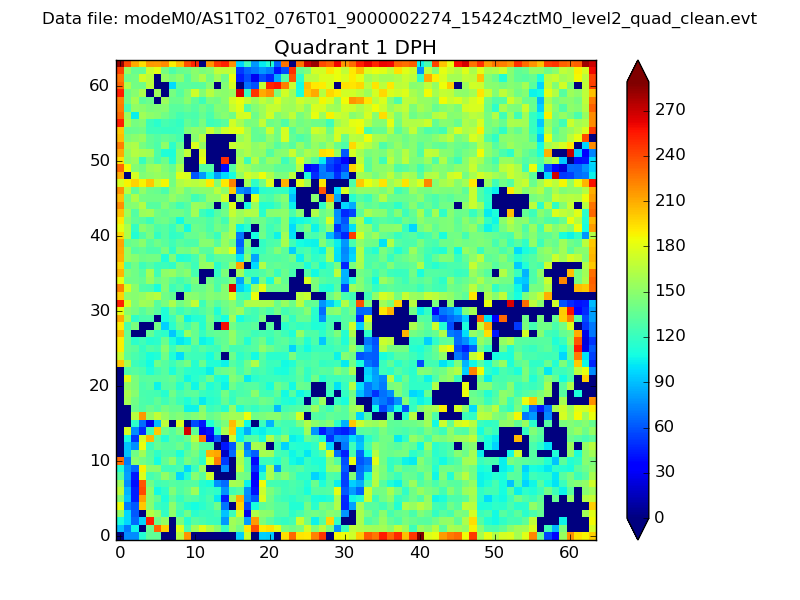 |
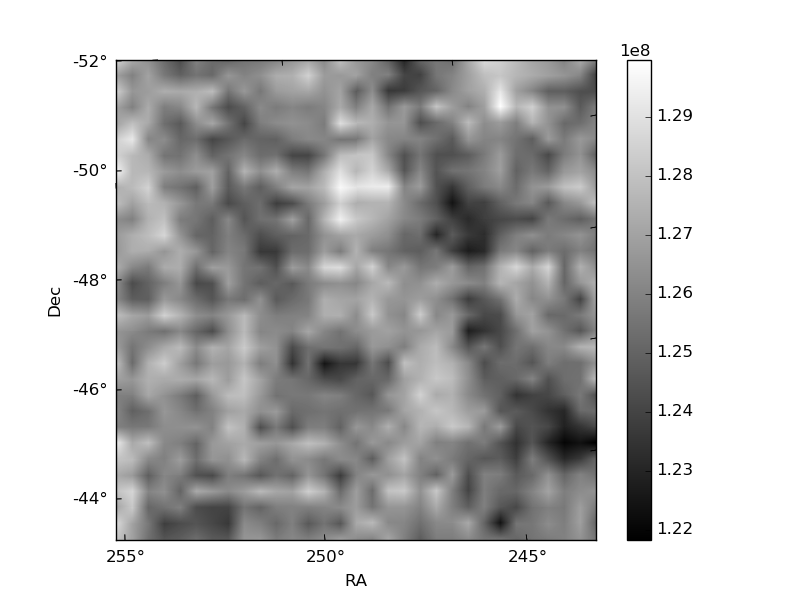
Quadrant B |
|---|---|---|---|
| Quadrant D | 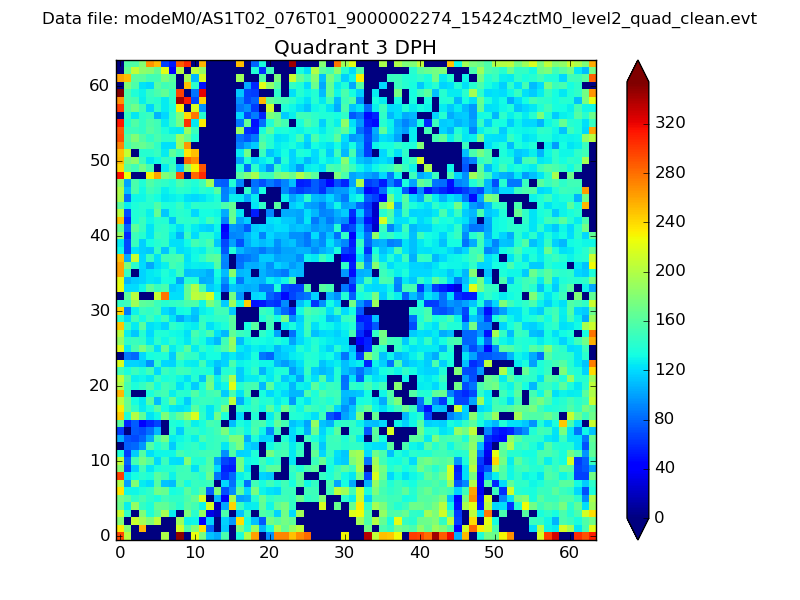 |
 |
Quadrant C |
| Plot type | Count rate plots | Images |
|---|---|---|
| Comparison with Poisson distribution Blue bars denote a histogram of data divided into 1 sec bins. Red curve is a Poisson curve with rate = median count rate of data. |
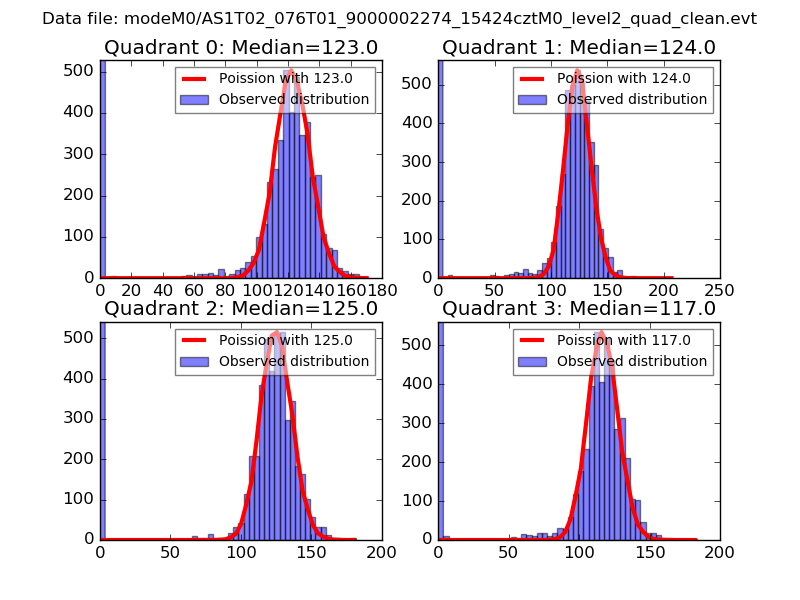 |
 |
| Quadrant-wise count rates Data is divided into 100 sec bins |
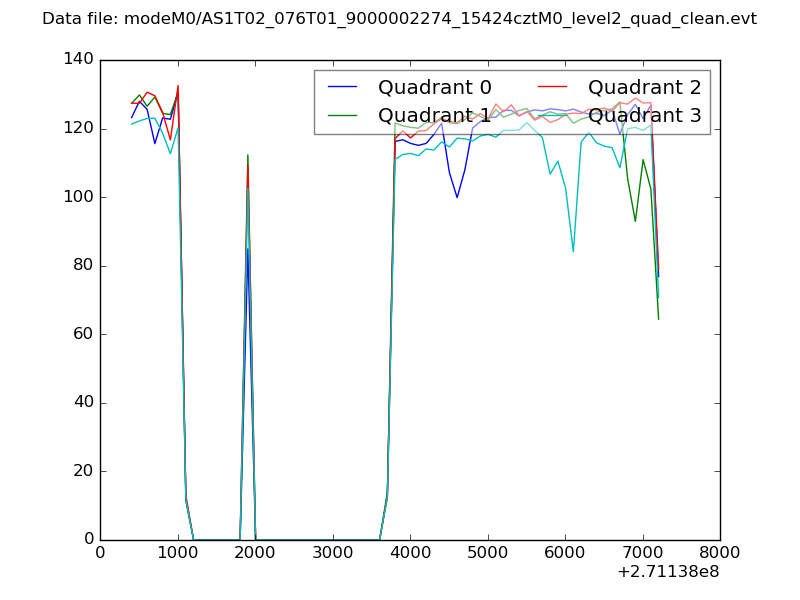 |
|
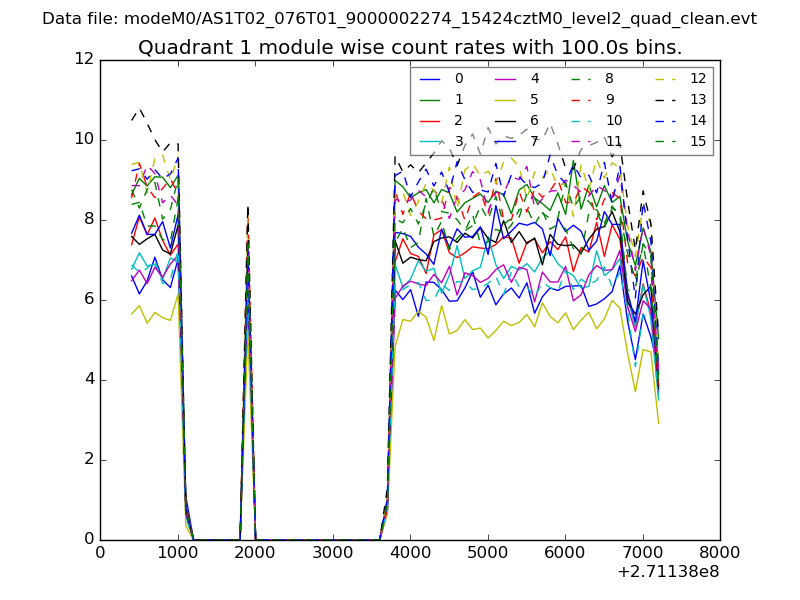
| Module-wise count rates for Quadrant A Data is divided into 100 sec bins |
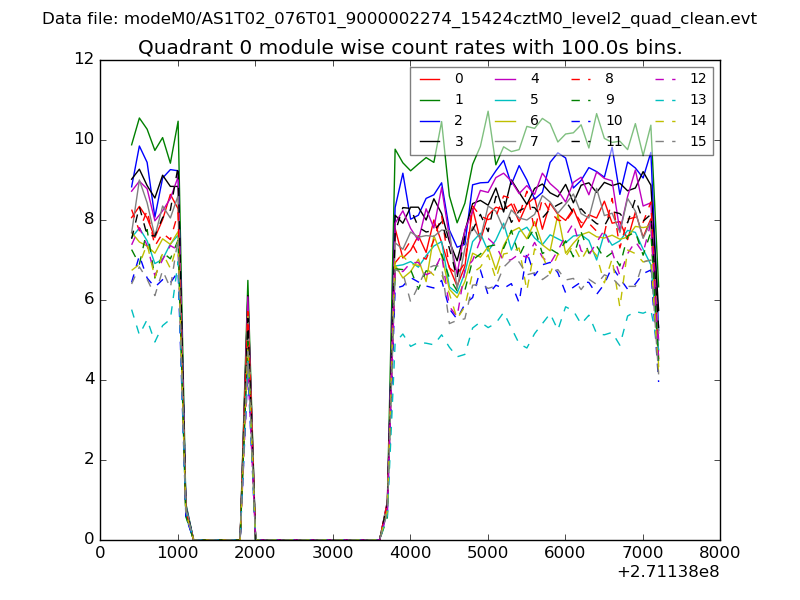 |
 |
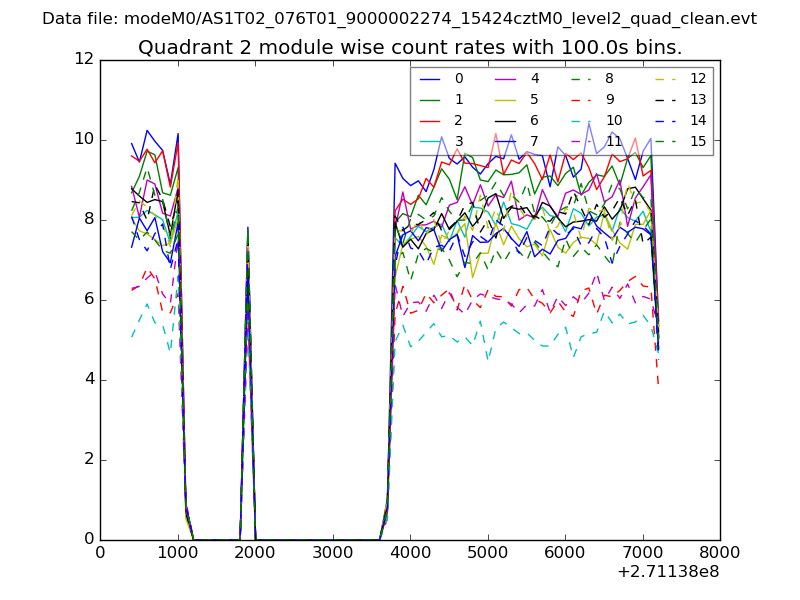
| Module-wise count rates for Quadrant B Data is divided into 100 sec bins |
 |
 |
| Module-wise count rates for Quadrant C Data is divided into 100 sec bins |
 |
 |
| Module-wise count rates for Quadrant D Data is divided into 100 sec bins |
 |
 |
| Parameter | Plot |
|---|---|
| CZT HV Monitor | 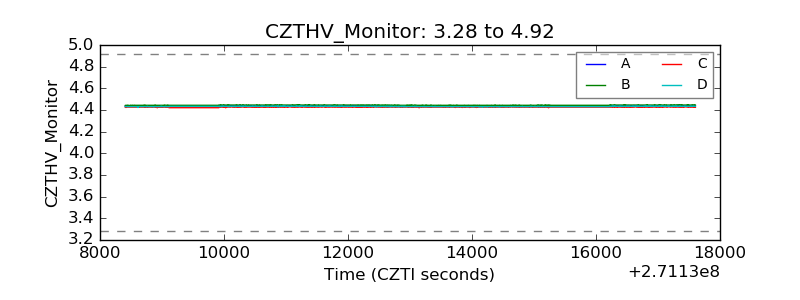 |
| D_VDD | 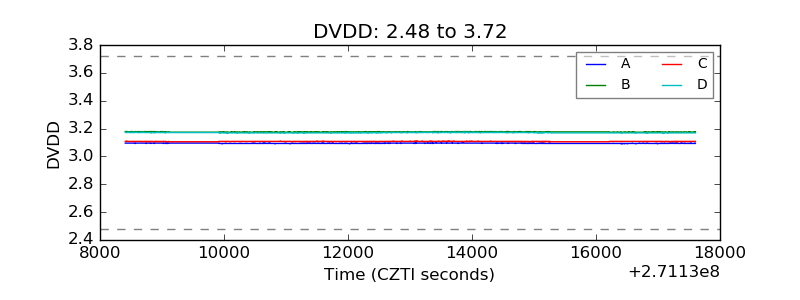 |
| Temperature 1 | 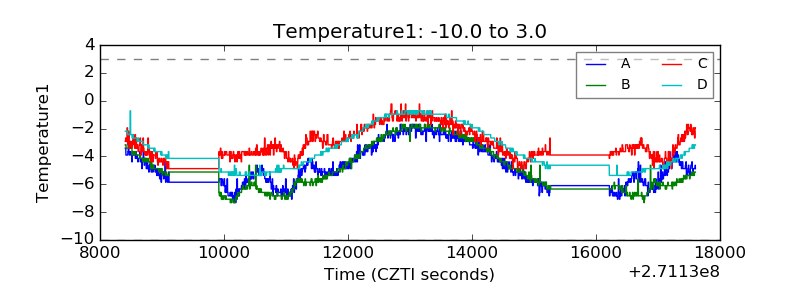 |
| Veto HV Monitor | 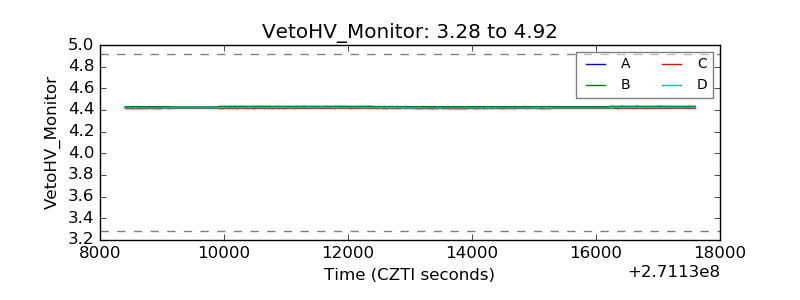 |
| Veto LLD |  |
| Alpha Counter | 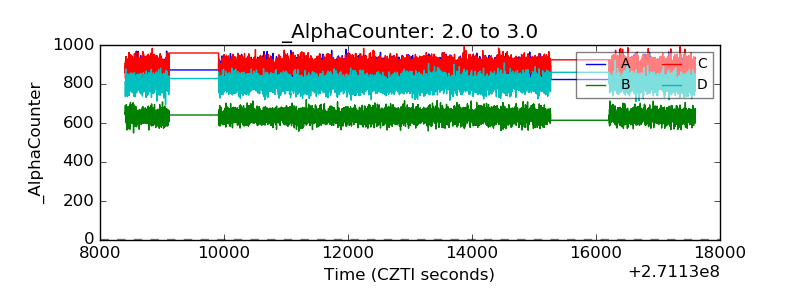 |
| _CPM_Rate | 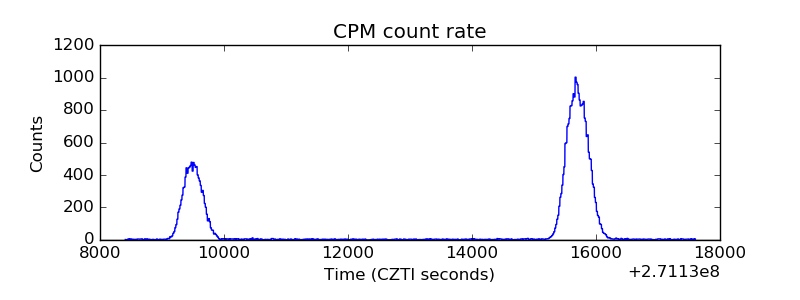 |
| CZT Counter | 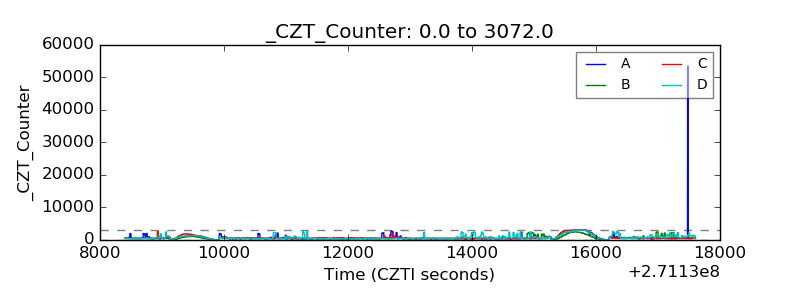 |
| +2.5 Volts monitor |  |
| +5 Volts monitor |  |
| _ROLL_ROT | 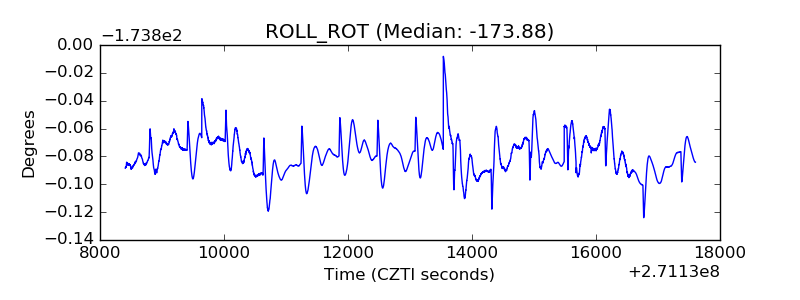 |
| _Roll_DEC | 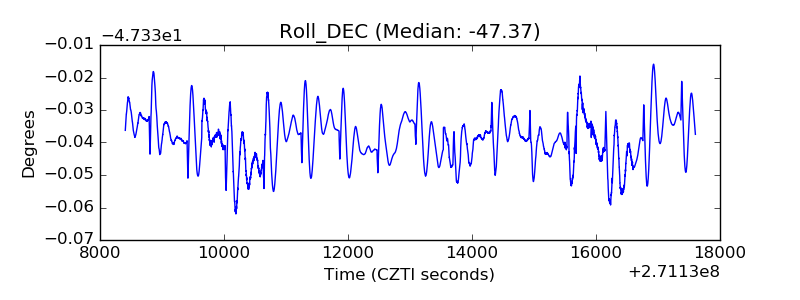 |
| _Roll_RA | 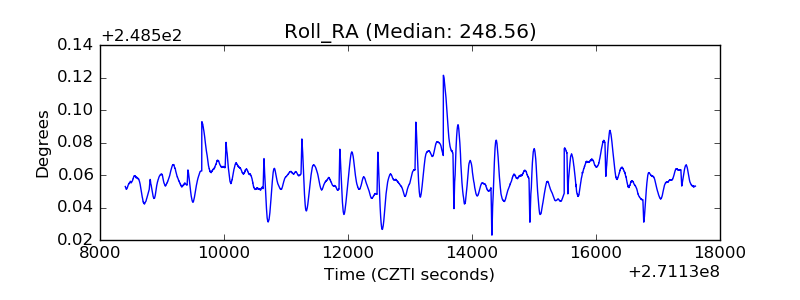 |
| Veto Counter | 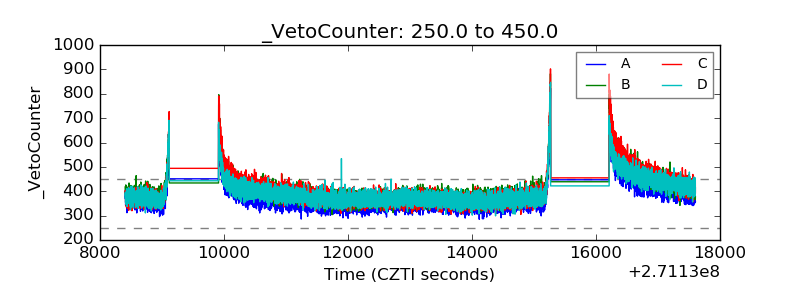 |