| Param | Original file | Final file |
|---|---|---|
| Filename | modeM0/AS1T02_076T01_9000002274_15425cztM0_level2.evt | modeM0/AS1T02_076T01_9000002274_15425cztM0_level2_quad_clean.evt |
| Size (bytes) | 396,642,240 | 60,909,120 |
| Size | 378.3 MB | 58.1 MB |
| Events in quadrant A | 2,535,589 | 382,595 |
| Events in quadrant B | 2,987,797 | 384,742 |
| Events in quadrant C | 2,337,335 | 390,928 |
| Events in quadrant D | 3,844,122 | 367,862 |
| Mode M0 | |||
|---|---|---|---|
| Quadrant | BADHDUFLAG | Total packets | Discarded packets |
| A | 0 | 10474 | 1 |
| B | 0 | 11859 | 1 |
| C | 0 | 9550 | 1 |
| D | 0 | 14552 | 1 |
| Mode SS | |||
|---|---|---|---|
| Quadrant | BADHDUFLAG | Total packets | Discarded packets |
| A | 0 | 90 | 0 |
| B | 0 | 90 | 0 |
| C | 0 | 90 | 0 |
| D | 0 | 90 | 0 |
| Mode M9 | |||
|---|---|---|---|
| Quadrant | BADHDUFLAG | Total packets | Discarded packets |
| A | 0 | 6 | 0 |
| B | 0 | 6 | 0 |
| C | 0 | 6 | 0 |
| D | 0 | 7 | 0 |
| Quadrant | Total seconds | Saturated seconds | Saturation percentage |
|---|---|---|---|
| A | 4525 | 129 | 2.850829% |
| B | 4525 | 147 | 3.248619% |
| C | 4525 | 15 | 0.331492% |
| D | 4525 | 269 | 5.944751% |
Noise dominated data is calculated using 1-second bins in cleaned event files. If a bin has >2000 counts, and if more than 50% of those come from <1% of pixels, then it is considered to be noise-dominated and hence unusable.
| Quadrant | # 1 sec bins | Bins with >0 counts | Bins with >2000 counts | High rate bins dominated by noise | Noise dominated (total time) | Noise dominated (detector-on time) | Marked lightcurve |
|---|---|---|---|---|---|---|---|
| A | 4526 | 4526 | 67 | 67 | 1.48% | 1.48% | 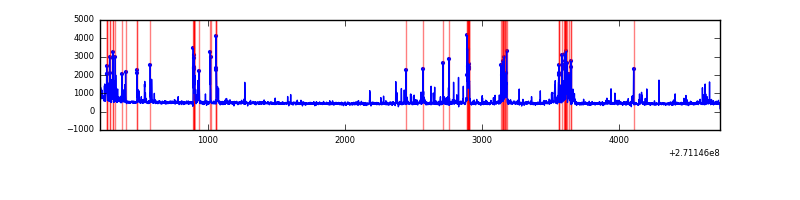 |
| B | 4526 | 4526 | 89 | 89 | 1.97% | 1.97% | 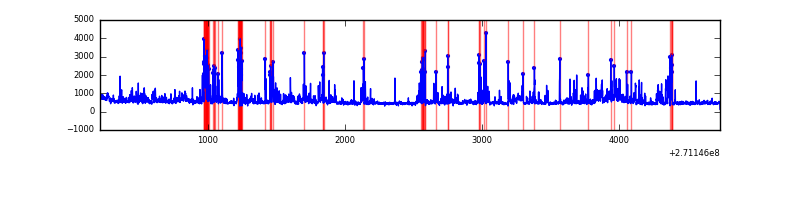 |
| C | 4526 | 4526 | 8 | 8 | 0.18% | 0.18% | 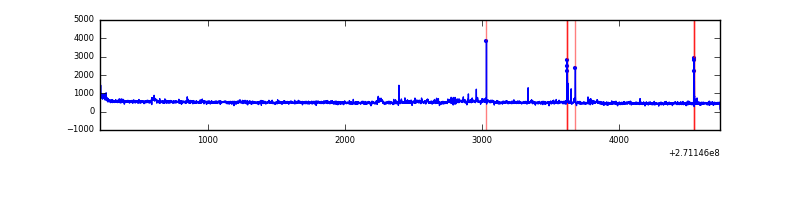 |
| D | 4526 | 4526 | 249 | 249 | 5.50% | 5.50% | 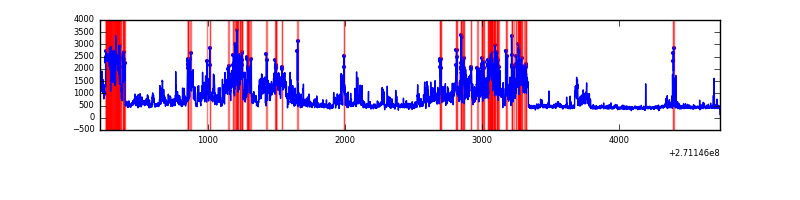 |
Top three noisy pixels from each quadrant. If the there are fewer than three noisy pixels in the level2.evt file, extra rows are filled as -1
| Pixel properties | Quadrant properties | ||||||
|---|---|---|---|---|---|---|---|
| Quadrant | DetID | PixID | Counts | Sigma | Mean | Median | Sigma |
| A | 14 | 238 | 383160 | 3494.81 | 534 | 522 | 109.5 |
| A | 14 | 237 | 82259 | 746.54 | 534 | 522 | 109.5 |
| A | 9 | 143 | 13787 | 121.16 | 534 | 522 | 109.5 |
| B | 10 | 245 | 722327 | 7179.06 | 530 | 517 | 100.5 |
| B | 4 | 142 | 81681 | 807.25 | 530 | 517 | 100.5 |
| B | 0 | 197 | 27400 | 267.38 | 530 | 517 | 100.5 |
| C | 3 | 233 | 283326 | 2363.7 | 521 | 524 | 119.6 |
| C | 10 | 22 | 12739 | 102.09 | 521 | 524 | 119.6 |
| C | 3 | 9 | 5482 | 41.44 | 521 | 524 | 119.6 |
| D | 13 | 122 | 1428851 | 11417.44 | 513 | 497 | 125.1 |
| D | 5 | 222 | 363055 | 2898.08 | 513 | 497 | 125.1 |
| D | 7 | 38 | 38934 | 307.24 | 513 | 497 | 125.1 |
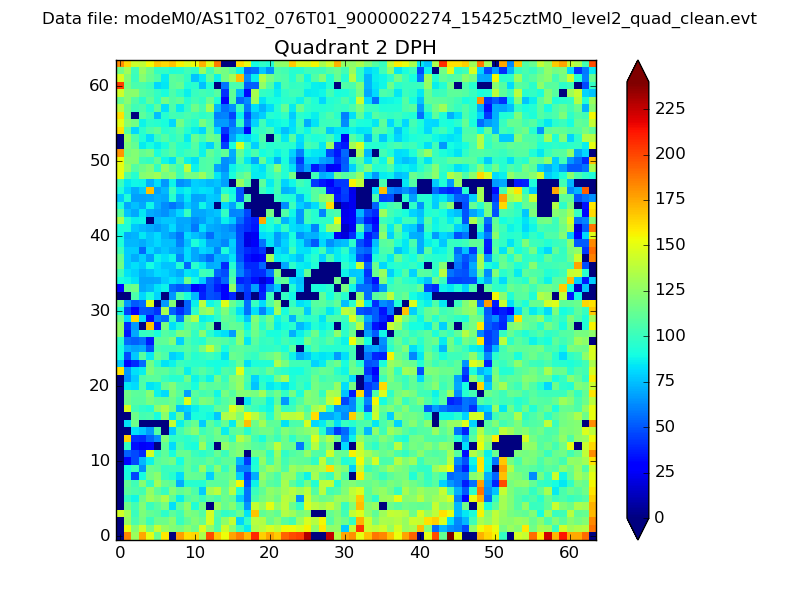
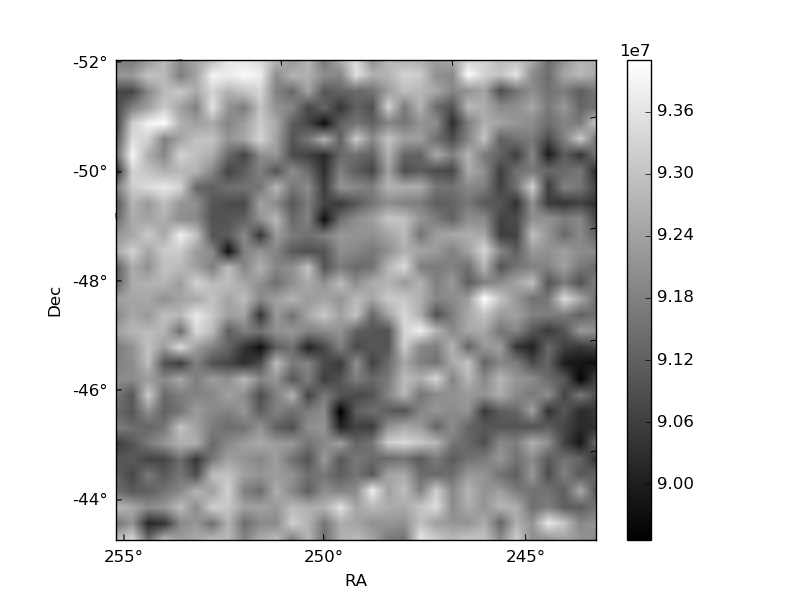
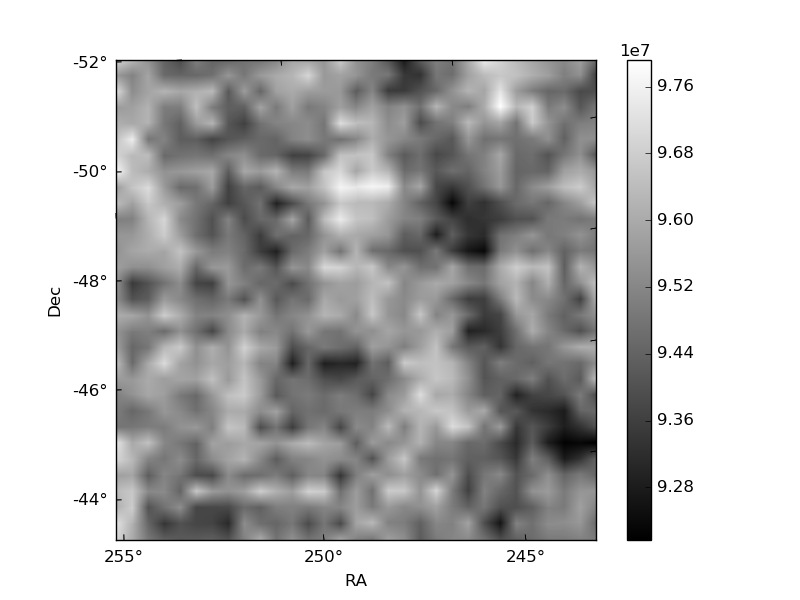
Histogram calculated using DETX and DETY for each event in the final _common_clean file
| Quadrant A |  |
 |
Quadrant B |
|---|---|---|---|
| Quadrant D | 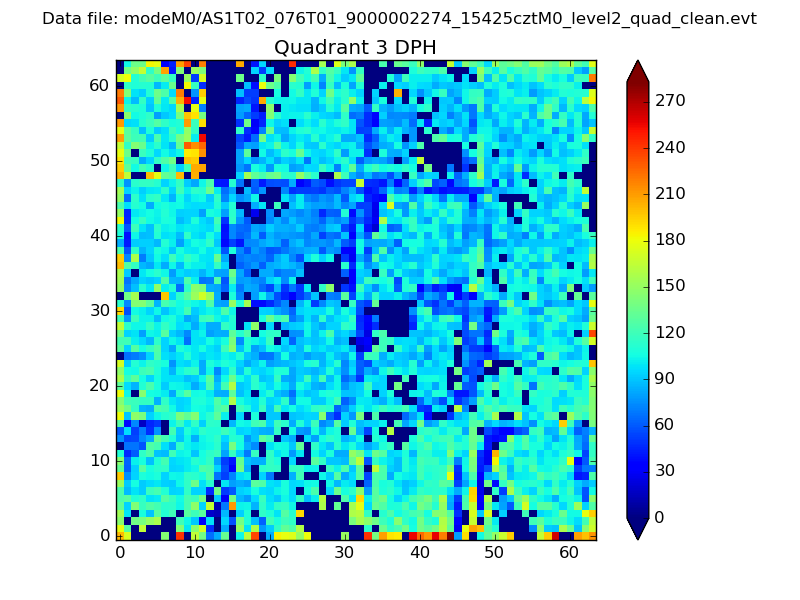 |
 |
Quadrant C |
| Plot type | Count rate plots | Images |
|---|---|---|
| Comparison with Poisson distribution Blue bars denote a histogram of data divided into 1 sec bins. Red curve is a Poisson curve with rate = median count rate of data. |
 |
 |
| Quadrant-wise count rates Data is divided into 100 sec bins |
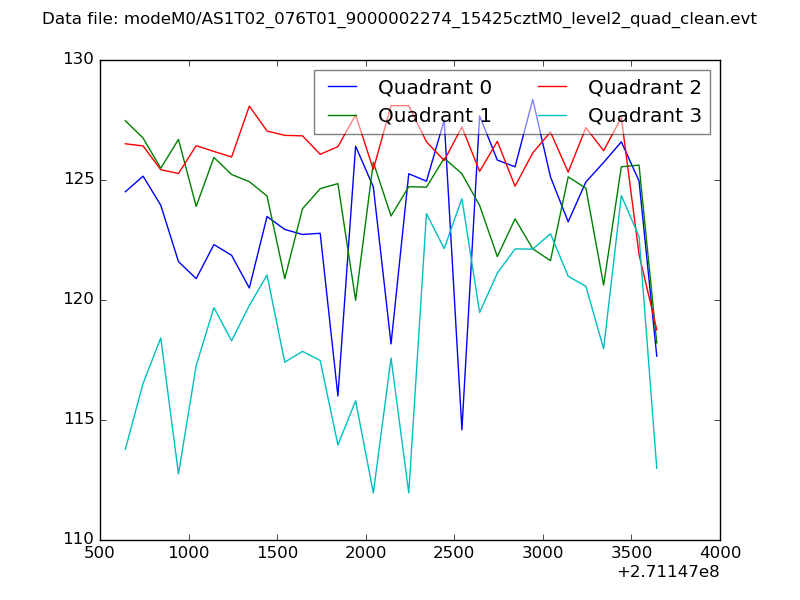 |
|
| Module-wise count rates for Quadrant A Data is divided into 100 sec bins |
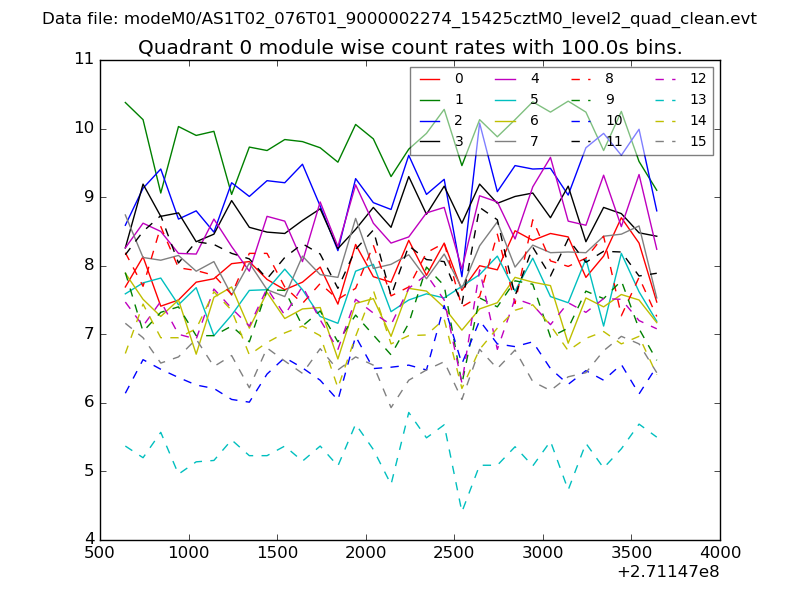 |
 |
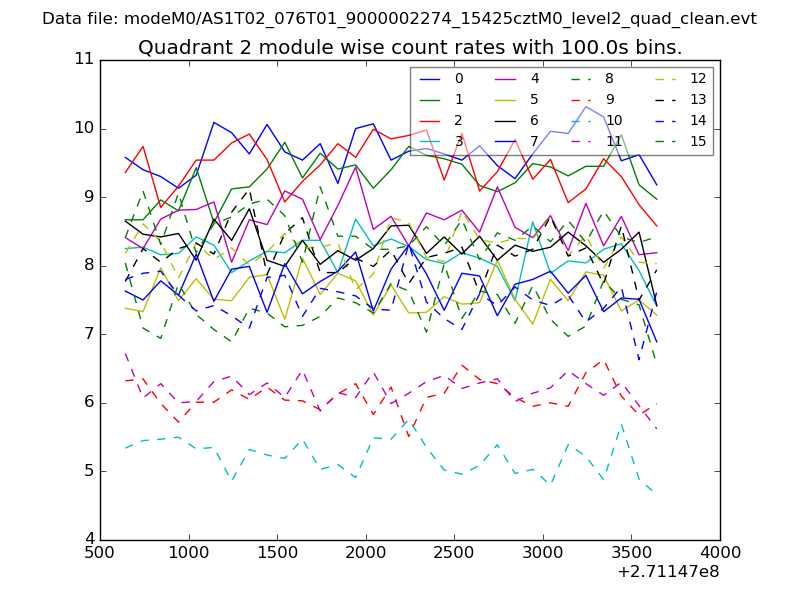
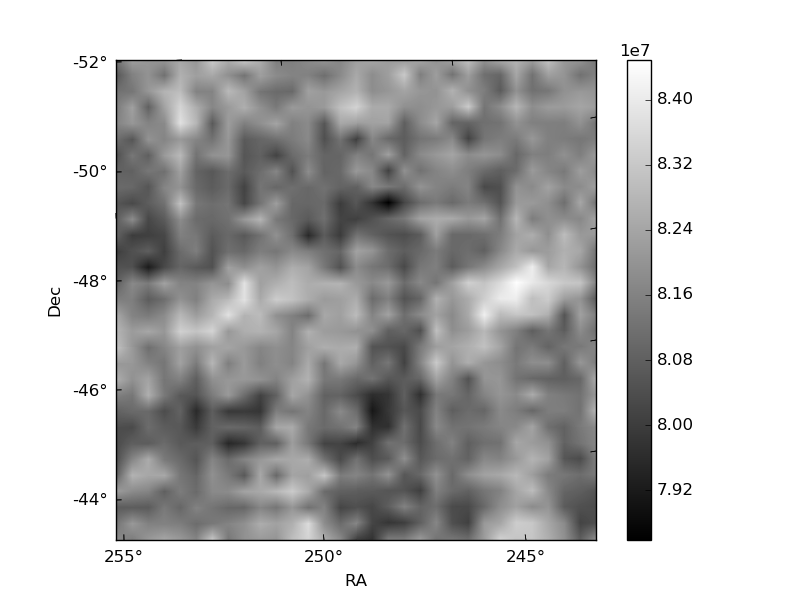
| Module-wise count rates for Quadrant B Data is divided into 100 sec bins |
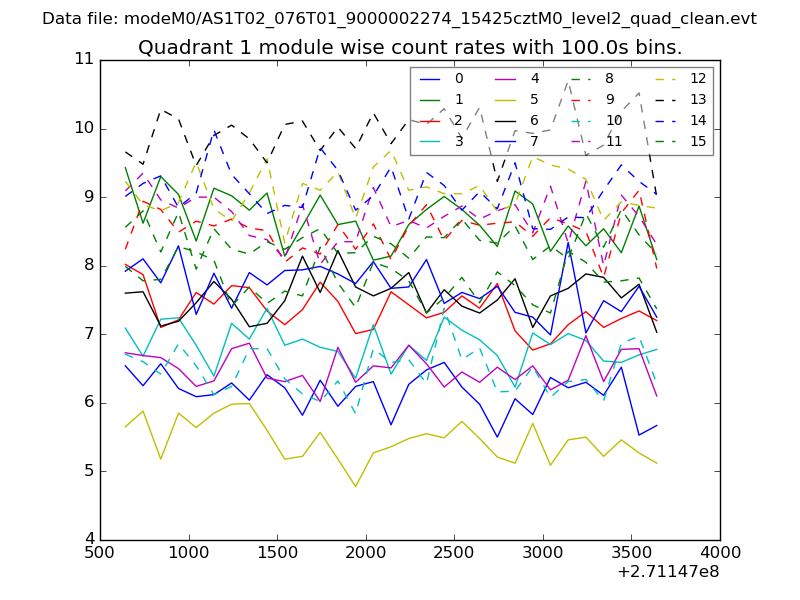 |
 |
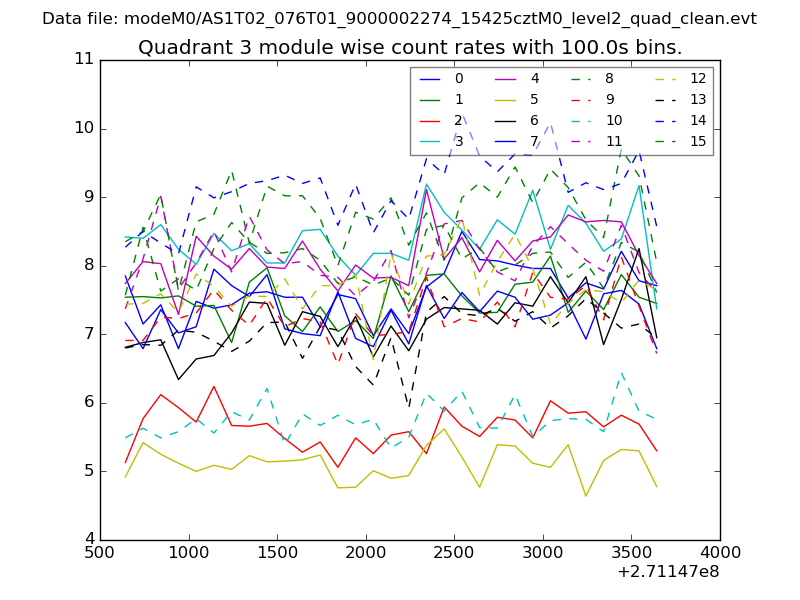
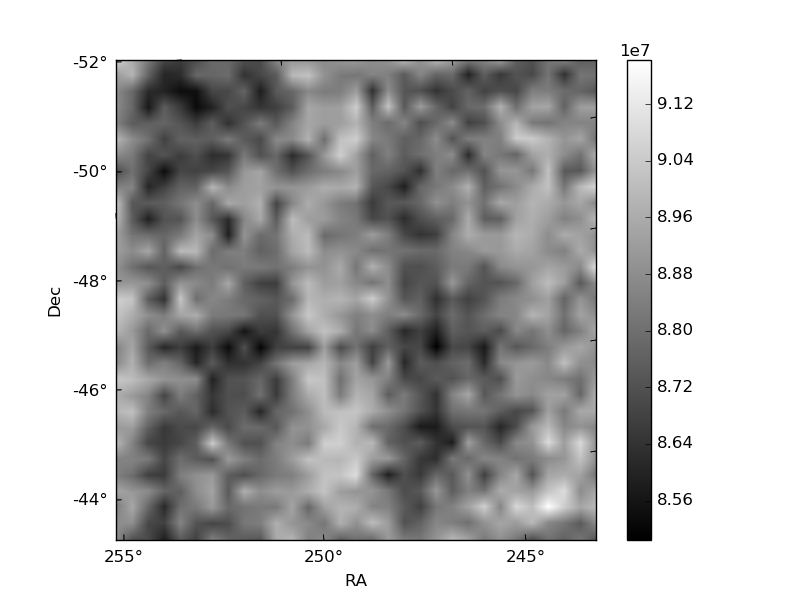
| Module-wise count rates for Quadrant C Data is divided into 100 sec bins |
 |
 |
| Module-wise count rates for Quadrant D Data is divided into 100 sec bins |
 |
 |
| Parameter | Plot |
|---|---|
| CZT HV Monitor | 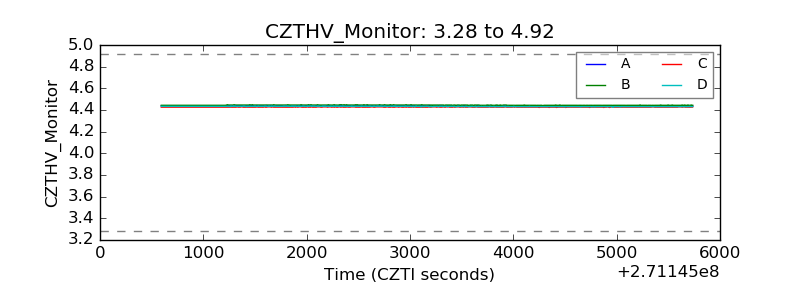 |
| D_VDD | 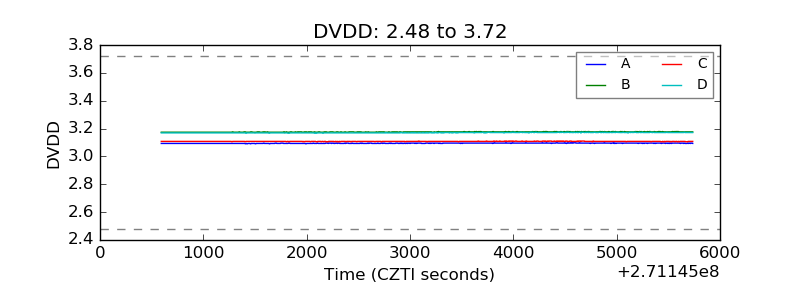 |
| Temperature 1 | 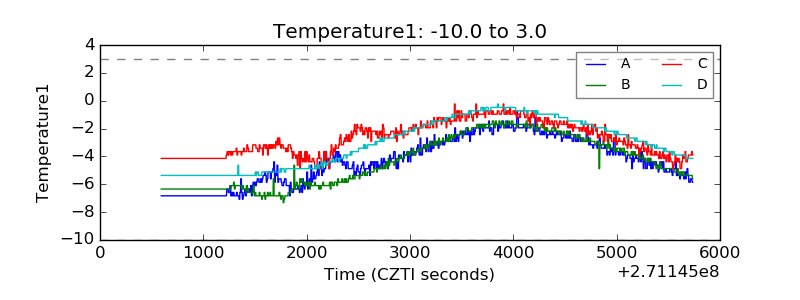 |
| Veto HV Monitor | 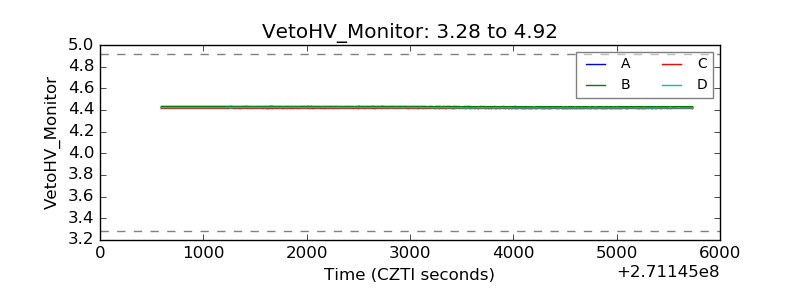 |
| Veto LLD | 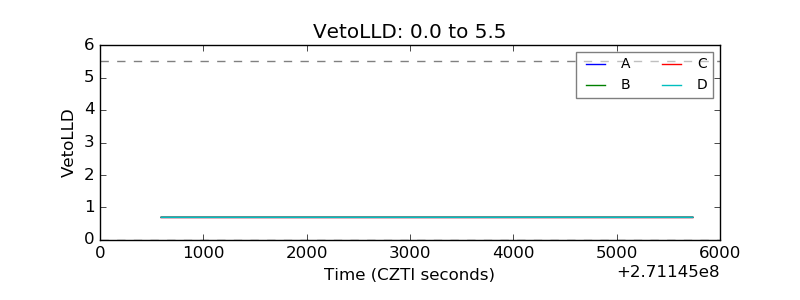 |
| Alpha Counter | 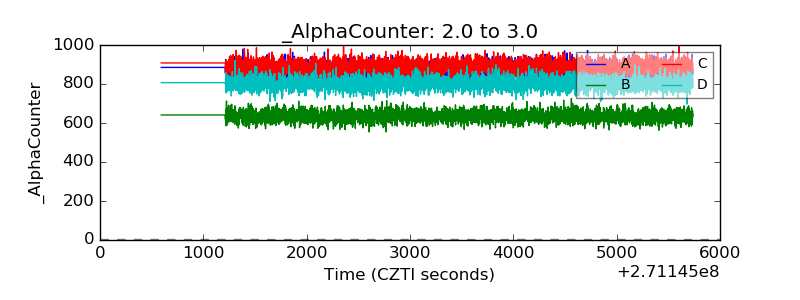 |
| _CPM_Rate | 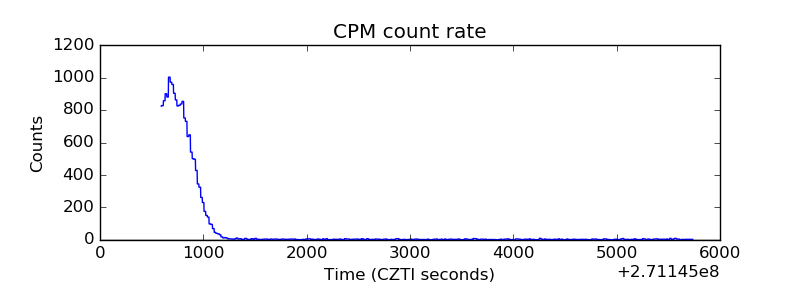 |
| CZT Counter | 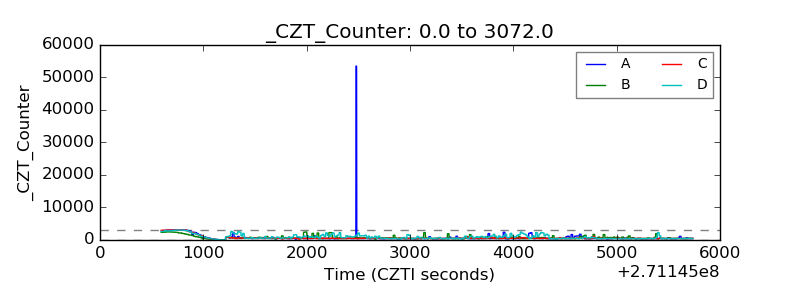 |
| +2.5 Volts monitor |  |
| +5 Volts monitor |  |
| _ROLL_ROT | 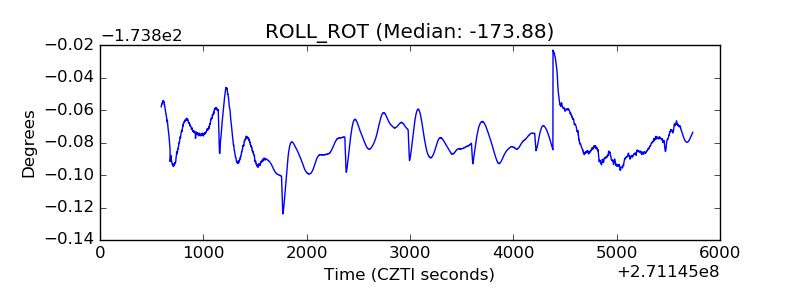 |
| _Roll_DEC | 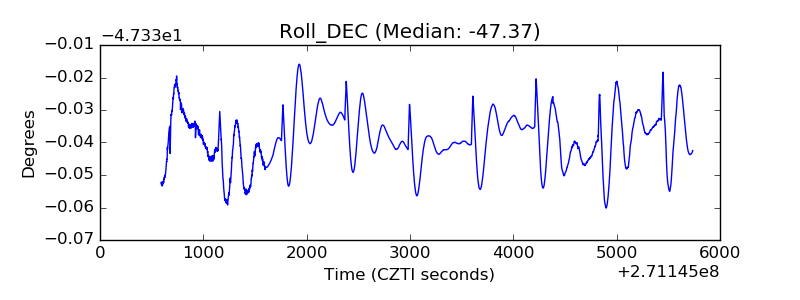 |
| _Roll_RA | 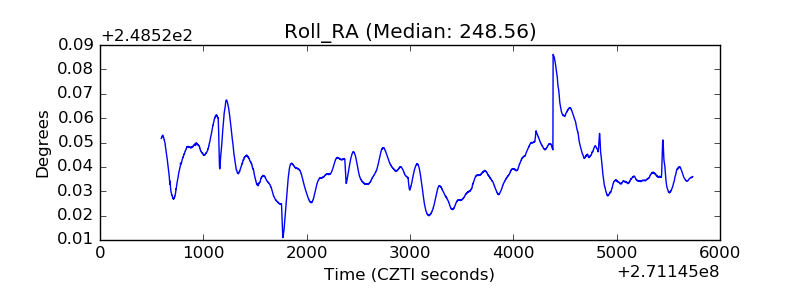 |
| Veto Counter | 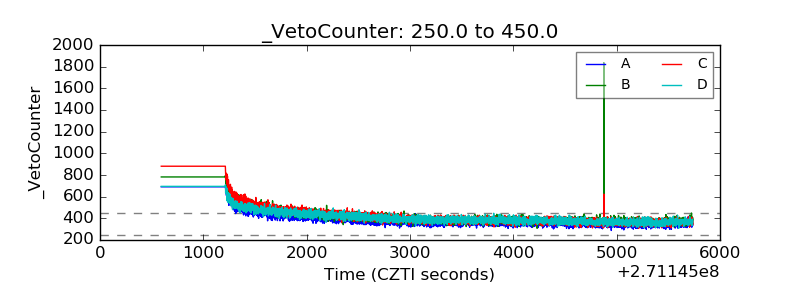 |