| Param | Original file | Final file |
|---|---|---|
| Filename | modeM0/AS1T02_080T01_9000002276_15425cztM0_level2.evt | modeM0/AS1T02_080T01_9000002276_15425cztM0_level2_quad_clean.evt |
| Size (bytes) | 118,356,480 | 6,606,720 |
| Size | 112.9 MB | 6.3 MB |
| Events in quadrant A | 847,204 | 21,655 |
| Events in quadrant B | 852,847 | 21,948 |
| Events in quadrant C | 885,492 | 22,346 |
| Events in quadrant D | 893,784 | 21,579 |
| Mode SS | |||
|---|---|---|---|
| Quadrant | BADHDUFLAG | Total packets | Discarded packets |
| A | 0 | 32 | 0 |
| B | 0 | 32 | 0 |
| C | 0 | 32 | 0 |
| D | 0 | 32 | 0 |
| Mode M0 | |||
|---|---|---|---|
| Quadrant | BADHDUFLAG | Total packets | Discarded packets |
| A | 0 | 3412 | 2 |
| B | 0 | 3419 | 1 |
| C | 0 | 3562 | 1 |
| D | 0 | 3581 | 1 |
| Mode M9 | |||
|---|---|---|---|
| Quadrant | BADHDUFLAG | Total packets | Discarded packets |
| A | 0 | 11 | 0 |
| B | 0 | 11 | 0 |
| C | 0 | 11 | 0 |
| D | 0 | 11 | 0 |
| Quadrant | Total seconds | Saturated seconds | Saturation percentage |
|---|---|---|---|
| A | 1506 | 31 | 2.058433% |
| B | 1506 | 39 | 2.589641% |
| C | 1506 | 33 | 2.191235% |
| D | 1506 | 42 | 2.788845% |
Noise dominated data is calculated using 1-second bins in cleaned event files. If a bin has >2000 counts, and if more than 50% of those come from <1% of pixels, then it is considered to be noise-dominated and hence unusable.
| Quadrant | # 1 sec bins | Bins with >0 counts | Bins with >2000 counts | High rate bins dominated by noise | Noise dominated (total time) | Noise dominated (detector-on time) | Marked lightcurve |
|---|---|---|---|---|---|---|---|
| A | 2607 | 1507 | 1 | 1 | 0.04% | 0.07% | 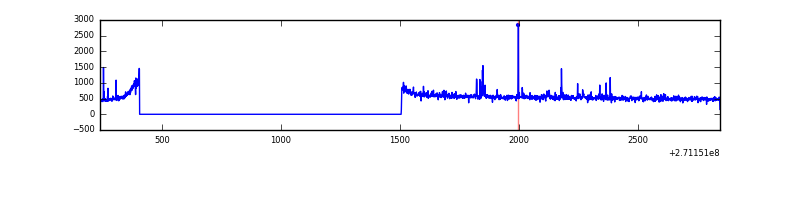 |
| B | 2607 | 1508 | 0 | 0 | 0.00% | 0.00% | 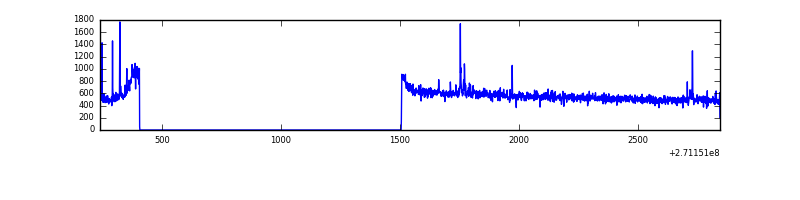 |
| C | 2607 | 1507 | 1 | 1 | 0.04% | 0.07% | 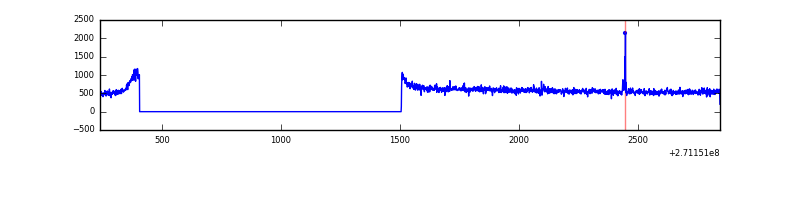 |
| D | 2607 | 1507 | 11 | 11 | 0.42% | 0.73% | 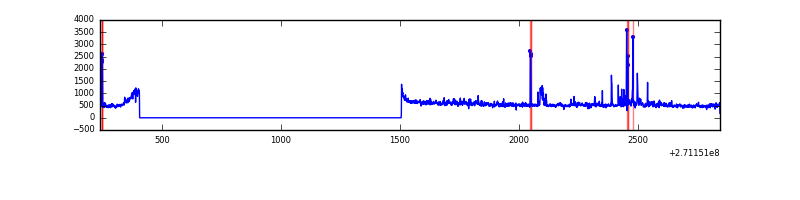 |
Top three noisy pixels from each quadrant. If the there are fewer than three noisy pixels in the level2.evt file, extra rows are filled as -1
| Pixel properties | Quadrant properties | ||||||
|---|---|---|---|---|---|---|---|
| Quadrant | DetID | PixID | Counts | Sigma | Mean | Median | Sigma |
| A | 14 | 238 | 14986 | 334.31 | 211 | 207 | 44.2 |
| A | 14 | 237 | 11701 | 260.0 | 211 | 207 | 44.2 |
| A | 9 | 143 | 6296 | 137.74 | 211 | 207 | 44.2 |
| B | 4 | 173 | 6389 | 146.75 | 213 | 209 | 42.1 |
| B | 12 | 111 | 4625 | 104.86 | 213 | 209 | 42.1 |
| B | 0 | 189 | 4283 | 96.74 | 213 | 209 | 42.1 |
| C | 3 | 233 | 54679 | 1082.35 | 211 | 212 | 50.3 |
| C | 14 | 225 | 6011 | 115.24 | 211 | 212 | 50.3 |
| C | 13 | 61 | 1586 | 27.3 | 211 | 212 | 50.3 |
| D | 10 | 70 | 43295 | 844.38 | 207 | 201 | 51.0 |
| D | 13 | 122 | 37058 | 722.17 | 207 | 201 | 51.0 |
| D | 5 | 222 | 13958 | 269.55 | 207 | 201 | 51.0 |
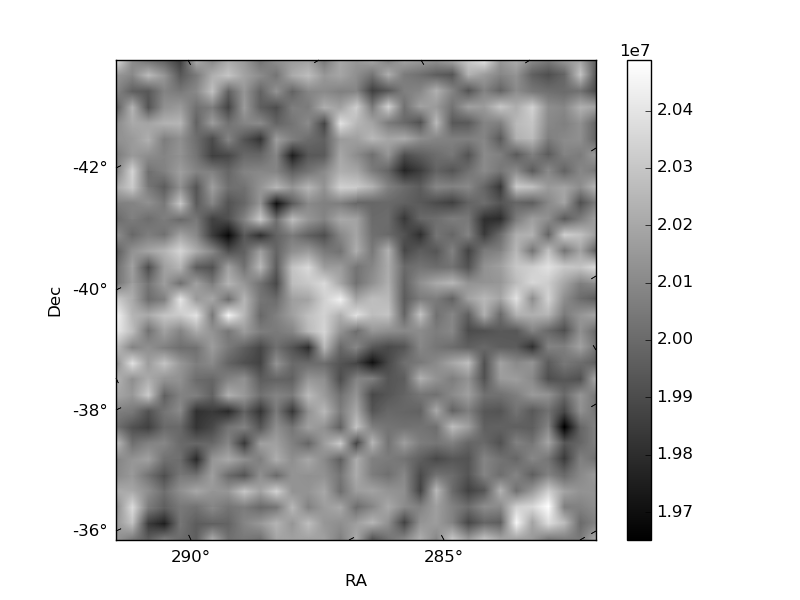
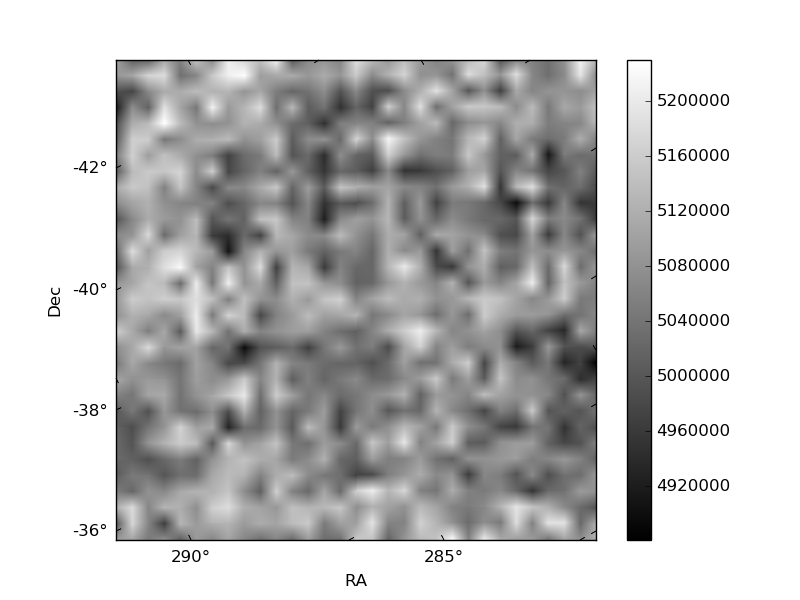
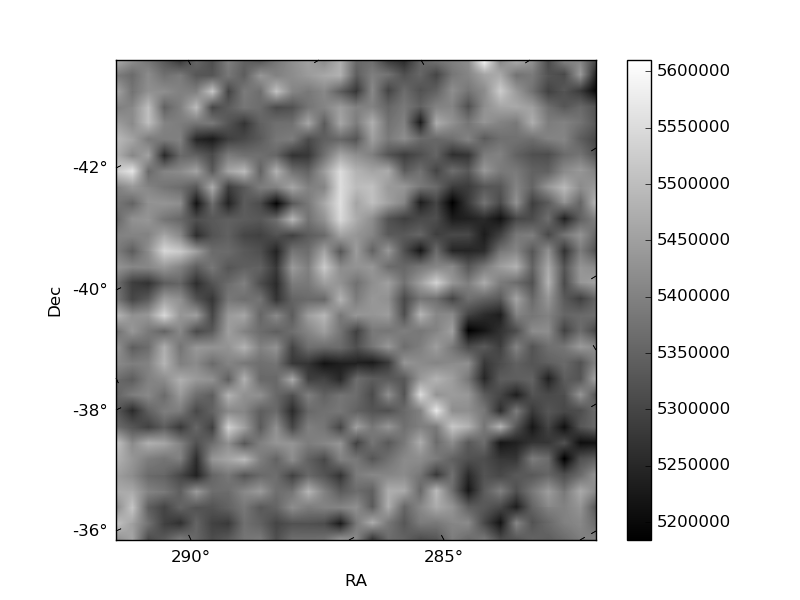
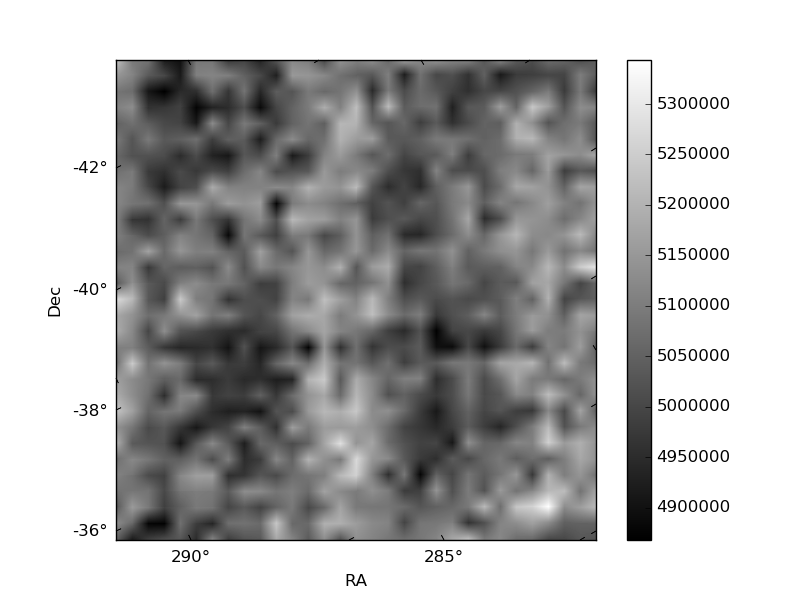
Histogram calculated using DETX and DETY for each event in the final _common_clean file
| Quadrant A | 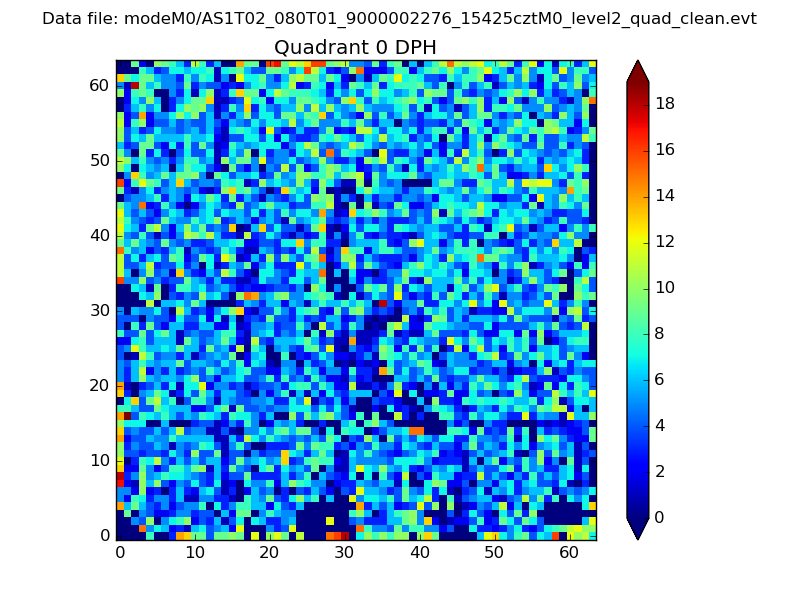 |
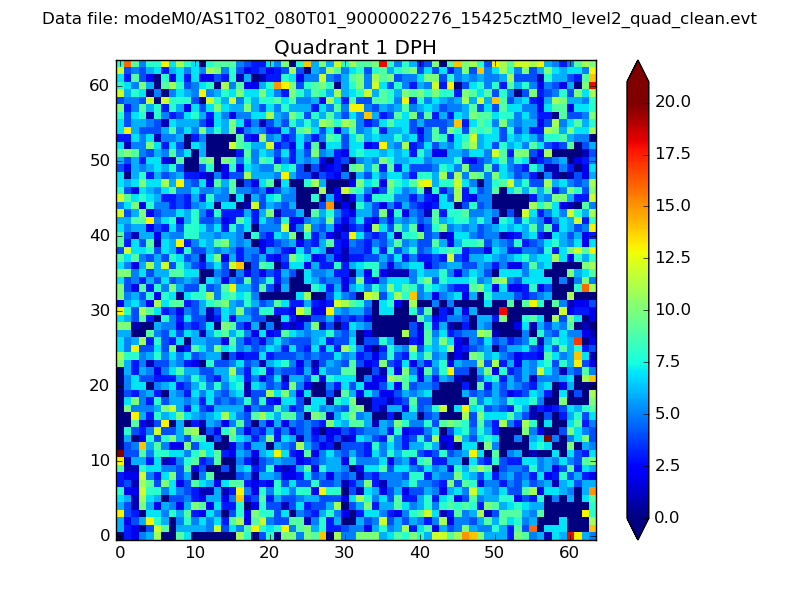 |
Quadrant B |
|---|---|---|---|
| Quadrant D | 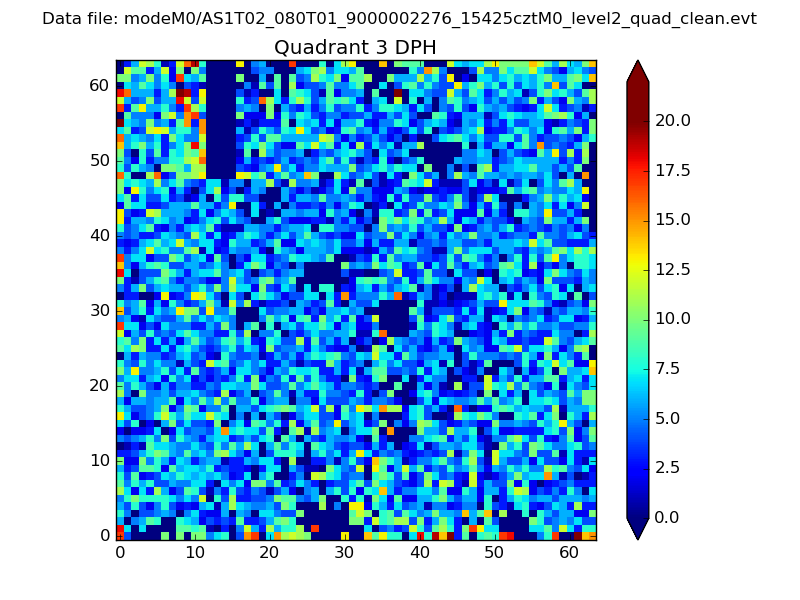 |
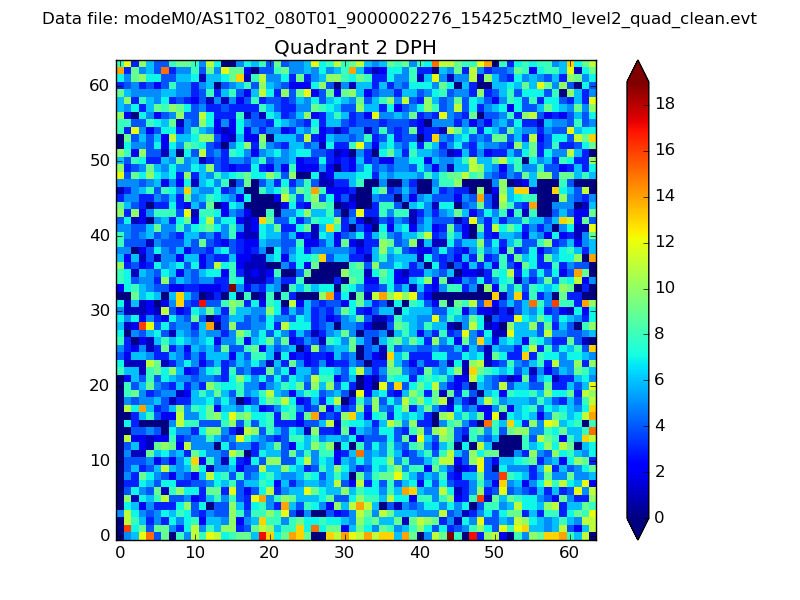 |
Quadrant C |
| Plot type | Count rate plots | Images |
|---|---|---|
| Comparison with Poisson distribution Blue bars denote a histogram of data divided into 1 sec bins. Red curve is a Poisson curve with rate = median count rate of data. |
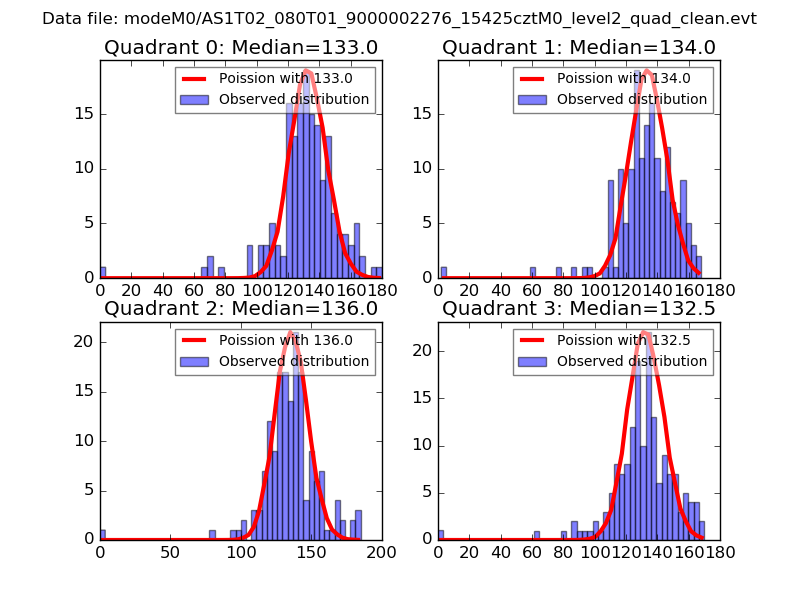 |
 |
| Quadrant-wise count rates Data is divided into 100 sec bins |
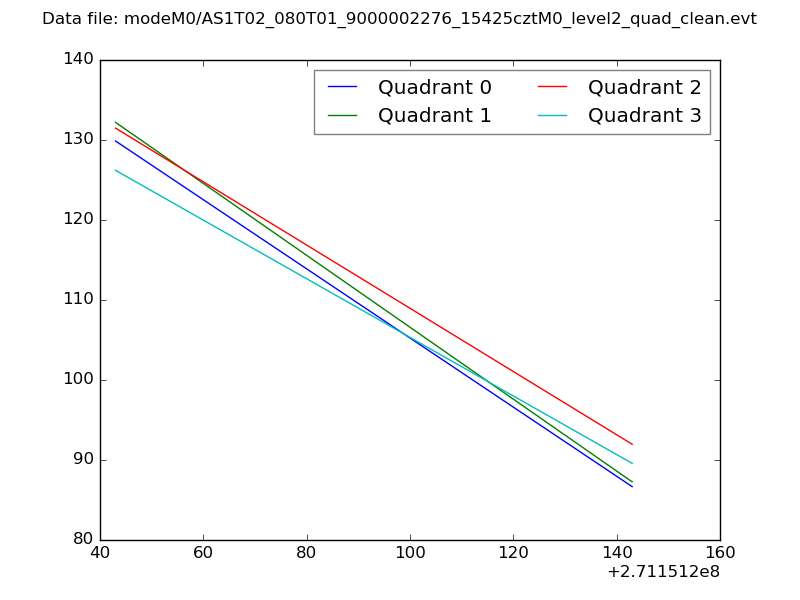 |
|
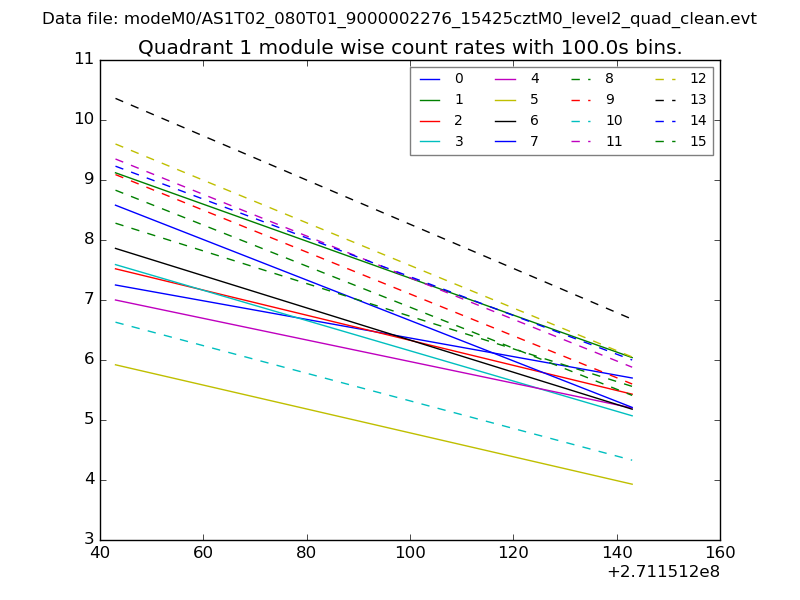
| Module-wise count rates for Quadrant A Data is divided into 100 sec bins |
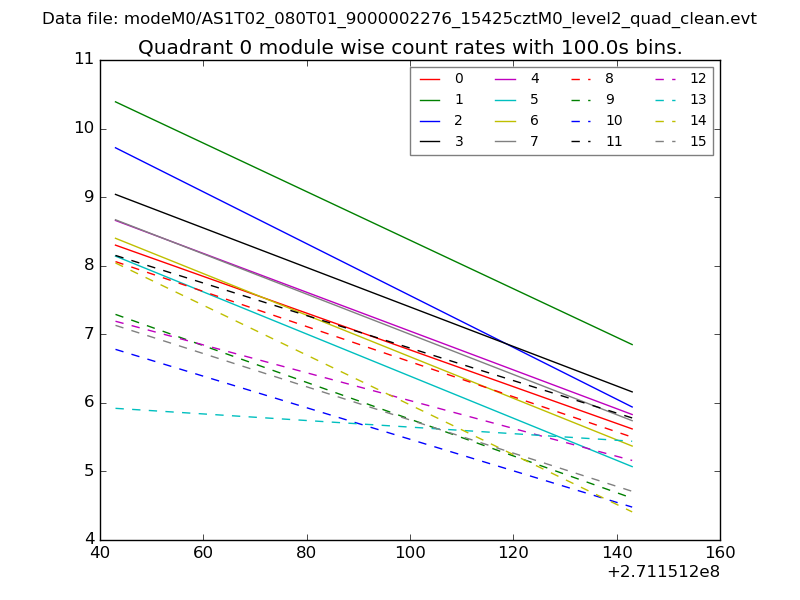 |
 |
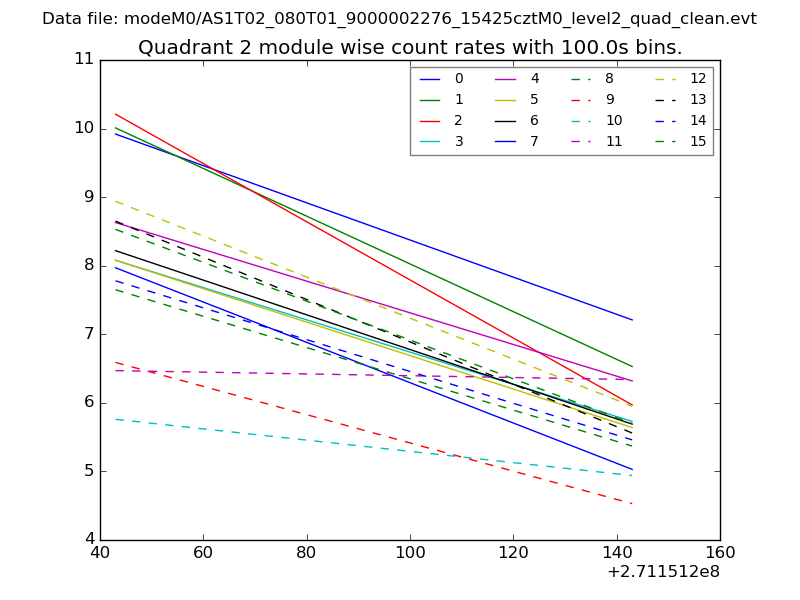
| Module-wise count rates for Quadrant B Data is divided into 100 sec bins |
 |
 |
| Module-wise count rates for Quadrant C Data is divided into 100 sec bins |
 |
 |
| Module-wise count rates for Quadrant D Data is divided into 100 sec bins |
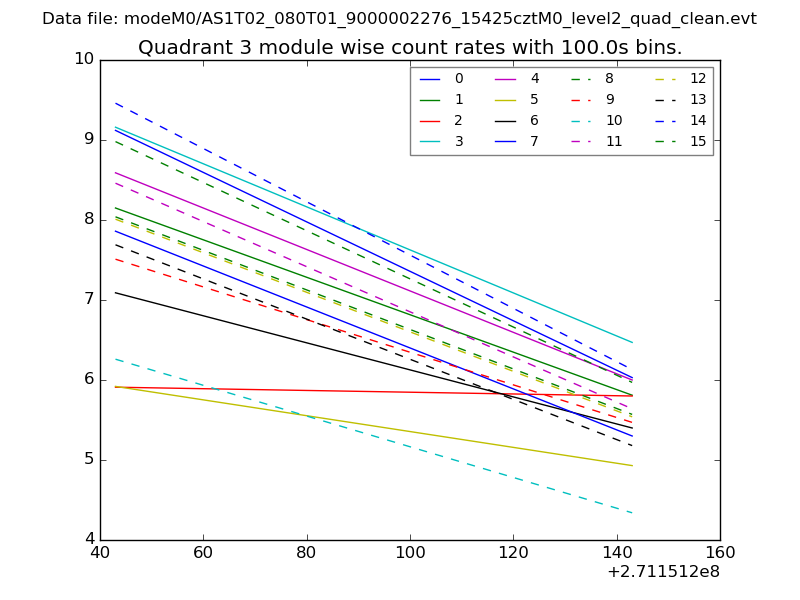 |
 |
| Parameter | Plot |
|---|---|
| CZT HV Monitor | 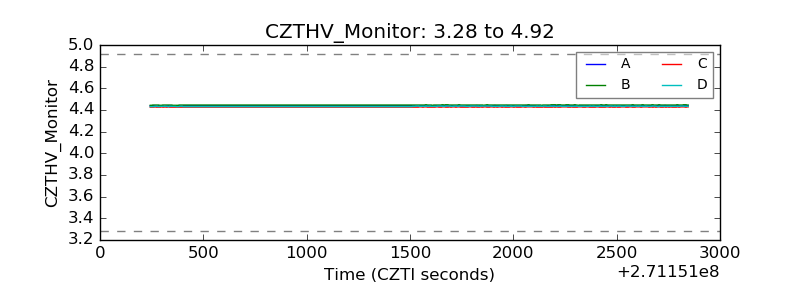 |
| D_VDD | 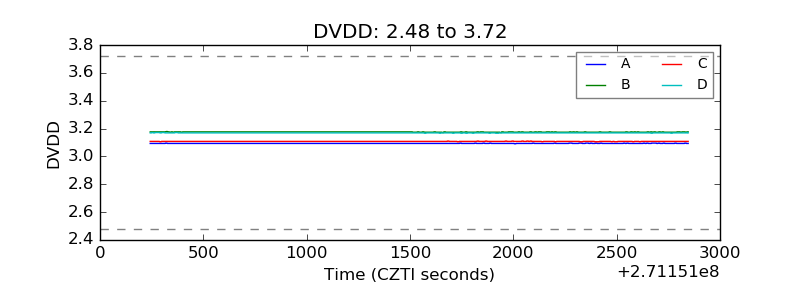 |
| Temperature 1 |  |
| Veto HV Monitor | 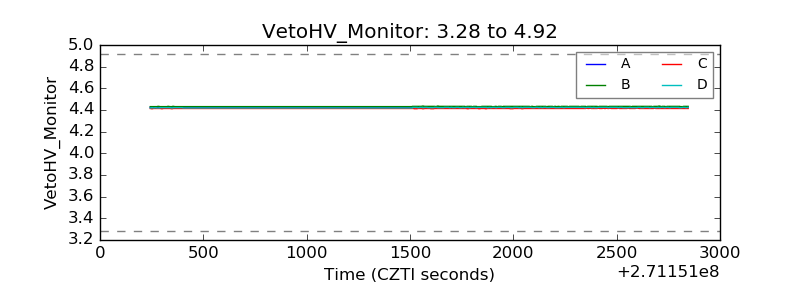 |
| Veto LLD | 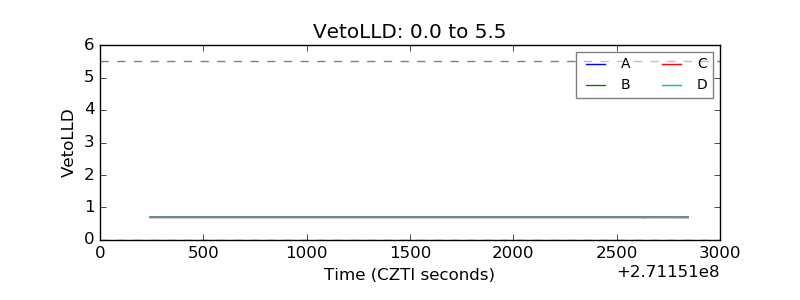 |
| Alpha Counter | 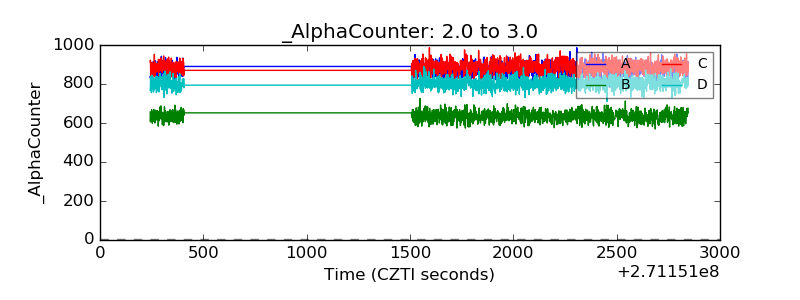 |
| _CPM_Rate | 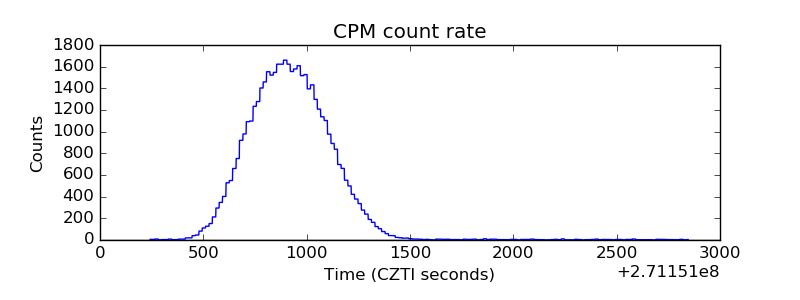 |
| CZT Counter | 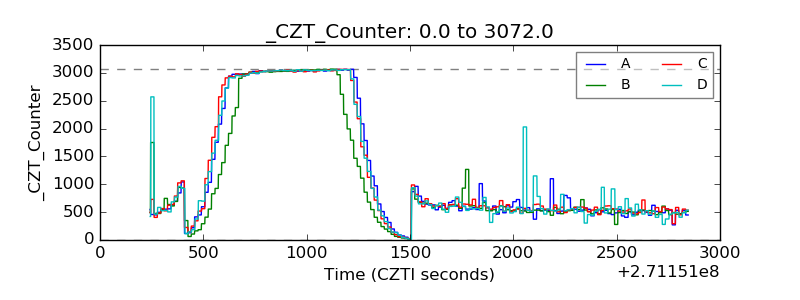 |
| +2.5 Volts monitor |  |
| +5 Volts monitor |  |
| _ROLL_ROT |  |
| _Roll_DEC | 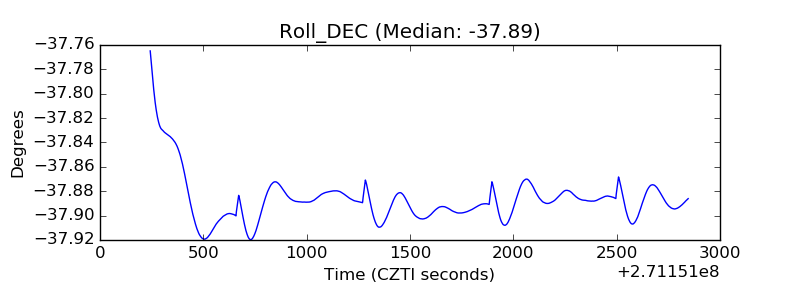 |
| _Roll_RA | 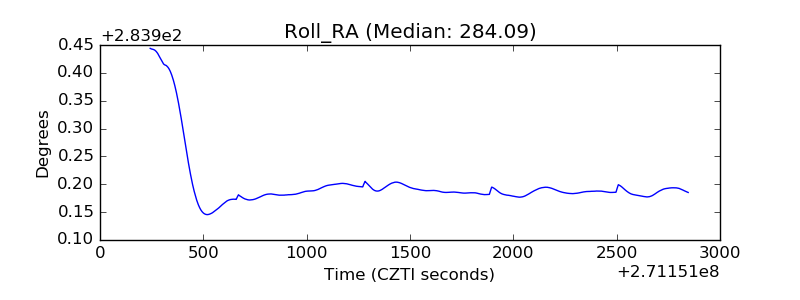 |
| Veto Counter | 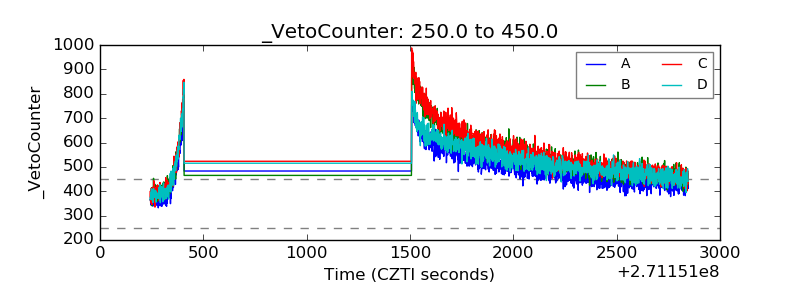 |