| Param | Original file | Final file |
|---|---|---|
| Filename | modeM0/AS1T02_080T01_9000002276_15430cztM0_level2.evt | modeM0/AS1T02_080T01_9000002276_15430cztM0_level2_quad_clean.evt |
| Size (bytes) | 541,607,040 | 116,746,560 |
| Size | 516.5 MB | 111.3 MB |
| Events in quadrant A | 3,826,227 | 775,013 |
| Events in quadrant B | 3,639,321 | 789,434 |
| Events in quadrant C | 4,493,641 | 767,169 |
| Events in quadrant D | 3,989,157 | 737,340 |
| Mode SS | |||
|---|---|---|---|
| Quadrant | BADHDUFLAG | Total packets | Discarded packets |
| A | 0 | 138 | 0 |
| B | 0 | 138 | 0 |
| C | 0 | 138 | 0 |
| D | 0 | 138 | 0 |
| Mode M0 | |||
|---|---|---|---|
| Quadrant | BADHDUFLAG | Total packets | Discarded packets |
| A | 0 | 15705 | 0 |
| B | 0 | 15072 | 0 |
| C | 0 | 18173 | 0 |
| D | 0 | 16423 | 0 |
| Mode M9 | |||
|---|---|---|---|
| Quadrant | BADHDUFLAG | Total packets | Discarded packets |
| A | 0 | 26 | 0 |
| B | 0 | 26 | 0 |
| C | 0 | 26 | 0 |
| D | 0 | 26 | 0 |
| Quadrant | Total seconds | Saturated seconds | Saturation percentage |
|---|---|---|---|
| A | 6699 | 254 | 3.791611% |
| B | 6700 | 241 | 3.597015% |
| C | 6700 | 233 | 3.477612% |
| D | 6700 | 238 | 3.552239% |
Noise dominated data is calculated using 1-second bins in cleaned event files. If a bin has >2000 counts, and if more than 50% of those come from <1% of pixels, then it is considered to be noise-dominated and hence unusable.
| Quadrant | # 1 sec bins | Bins with >0 counts | Bins with >2000 counts | High rate bins dominated by noise | Noise dominated (total time) | Noise dominated (detector-on time) | Marked lightcurve |
|---|---|---|---|---|---|---|---|
| A | 9254 | 6699 | 20 | 20 | 0.22% | 0.30% | 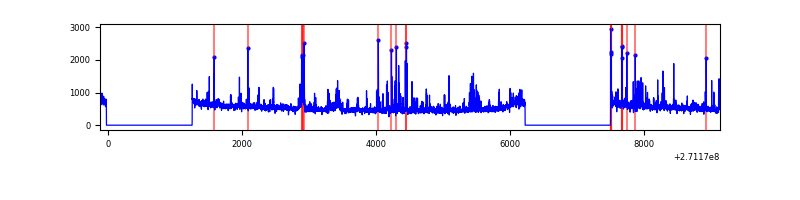 |
| B | 9255 | 6700 | 6 | 6 | 0.06% | 0.09% | 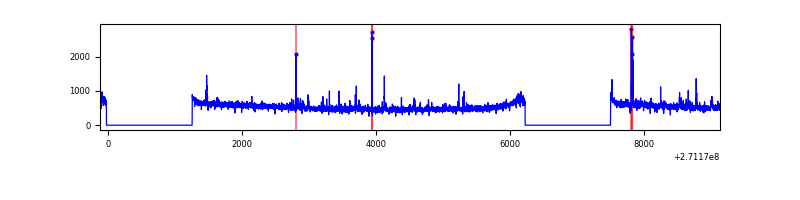 |
| C | 9255 | 6700 | 8 | 8 | 0.09% | 0.12% | 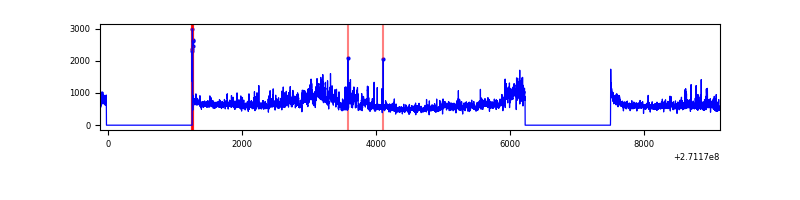 |
| D | 9255 | 6700 | 34 | 34 | 0.37% | 0.51% | 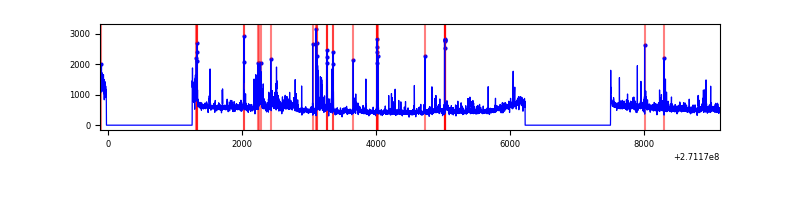 |
Top three noisy pixels from each quadrant. If the there are fewer than three noisy pixels in the level2.evt file, extra rows are filled as -1
| Pixel properties | Quadrant properties | ||||||
|---|---|---|---|---|---|---|---|
| Quadrant | DetID | PixID | Counts | Sigma | Mean | Median | Sigma |
| A | 14 | 238 | 253589 | 1411.8 | 901 | 884 | 179.0 |
| A | 14 | 237 | 87576 | 484.33 | 901 | 884 | 179.0 |
| A | 9 | 143 | 19506 | 104.04 | 901 | 884 | 179.0 |
| B | 0 | 189 | 30209 | 174.77 | 895 | 874 | 167.8 |
| B | 15 | 201 | 21611 | 123.55 | 895 | 874 | 167.8 |
| B | 12 | 111 | 18513 | 105.09 | 895 | 874 | 167.8 |
| C | 3 | 233 | 1107349 | 5693.96 | 859 | 863 | 194.3 |
| C | 7 | 247 | 21378 | 105.57 | 859 | 863 | 194.3 |
| C | 14 | 234 | 17425 | 85.23 | 859 | 863 | 194.3 |
| D | 5 | 222 | 377812 | 1799.28 | 868 | 844 | 209.5 |
| D | 2 | 33 | 96298 | 455.61 | 868 | 844 | 209.5 |
| D | 2 | 152 | 91081 | 430.7 | 868 | 844 | 209.5 |
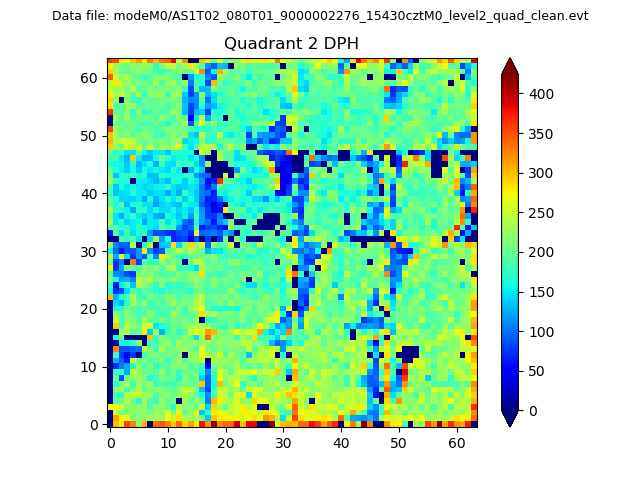
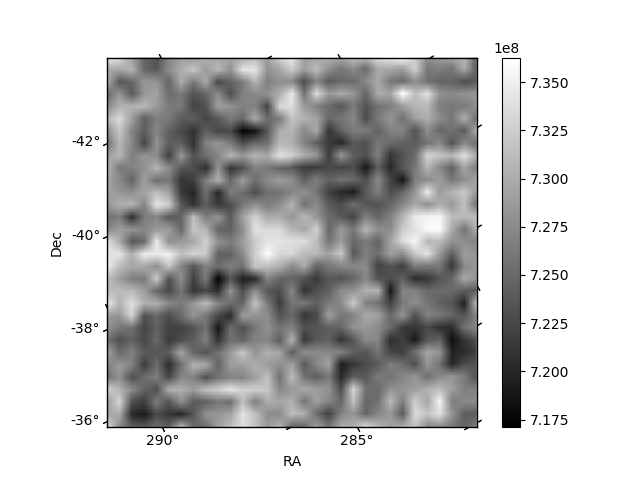
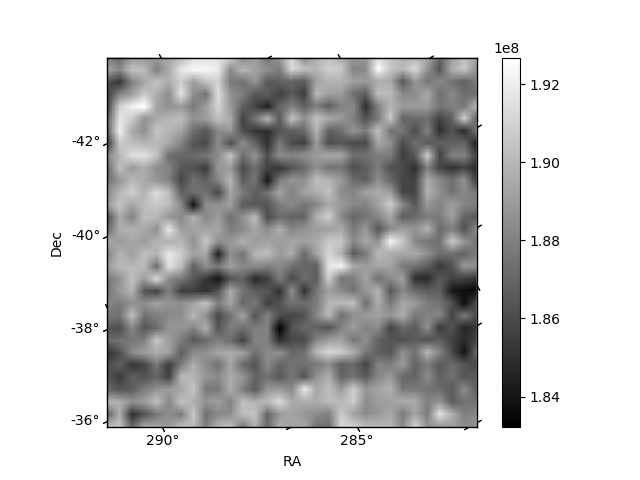
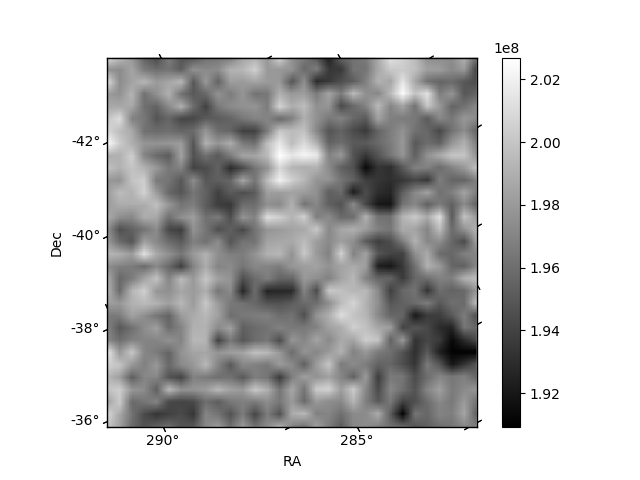
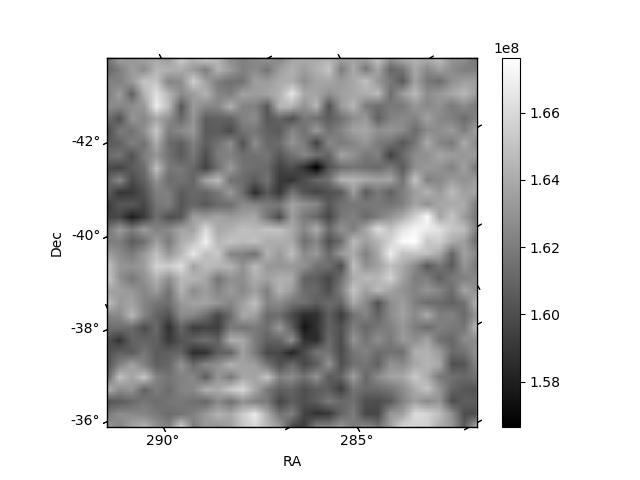
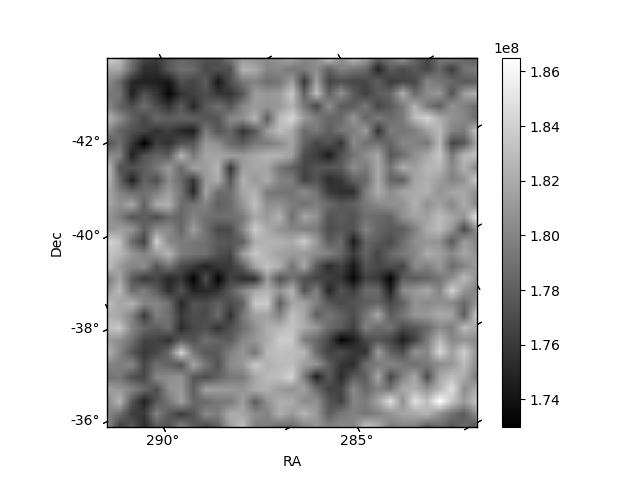
Histogram calculated using DETX and DETY for each event in the final _common_clean file
| Quadrant A | 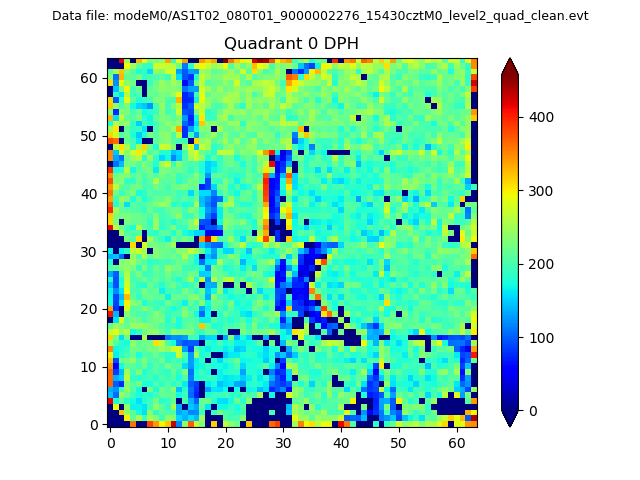 |
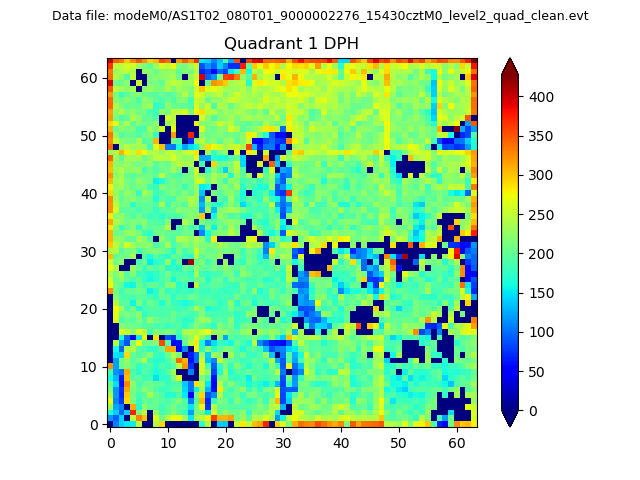 |
Quadrant B |
|---|---|---|---|
| Quadrant D | 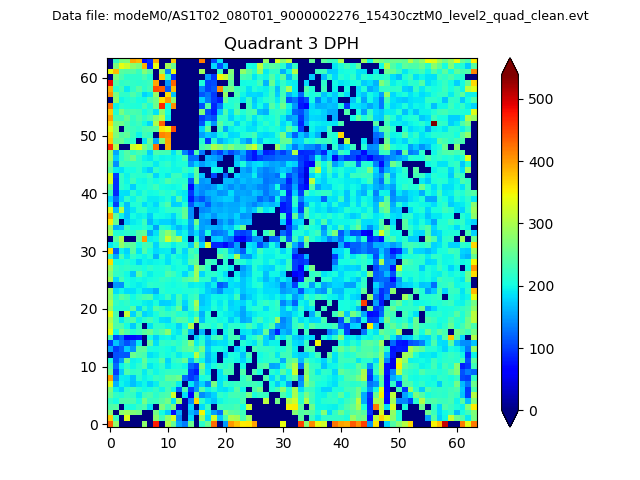 |
 |
Quadrant C |
| Plot type | Count rate plots | Images |
|---|---|---|
| Comparison with Poisson distribution Blue bars denote a histogram of data divided into 1 sec bins. Red curve is a Poisson curve with rate = median count rate of data. |
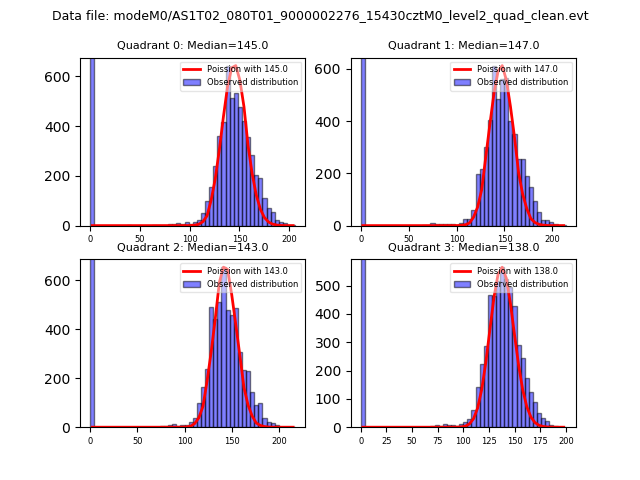 |
 |
| Quadrant-wise count rates Data is divided into 100 sec bins |
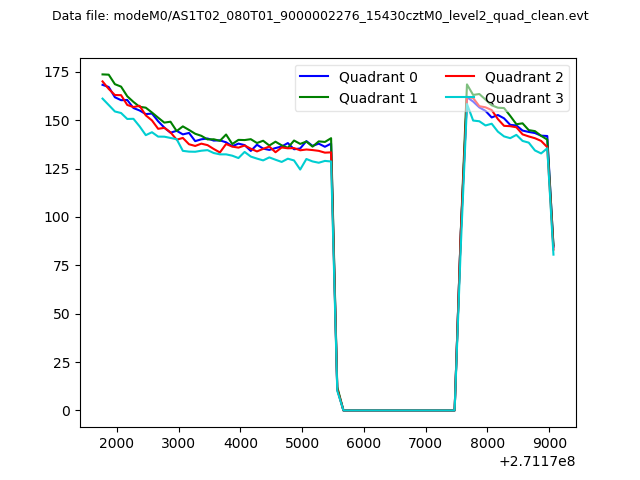 |
|
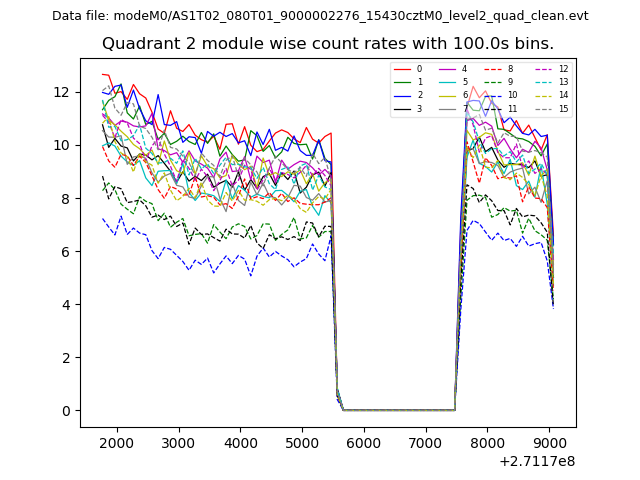
| Module-wise count rates for Quadrant A Data is divided into 100 sec bins |
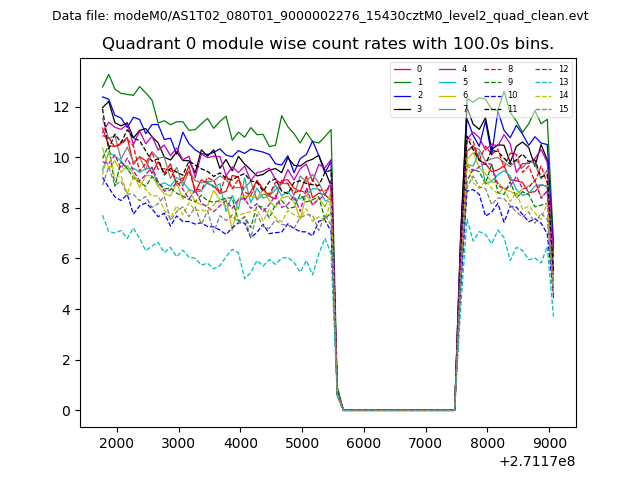 |
 |
| Module-wise count rates for Quadrant B Data is divided into 100 sec bins |
 |
 |
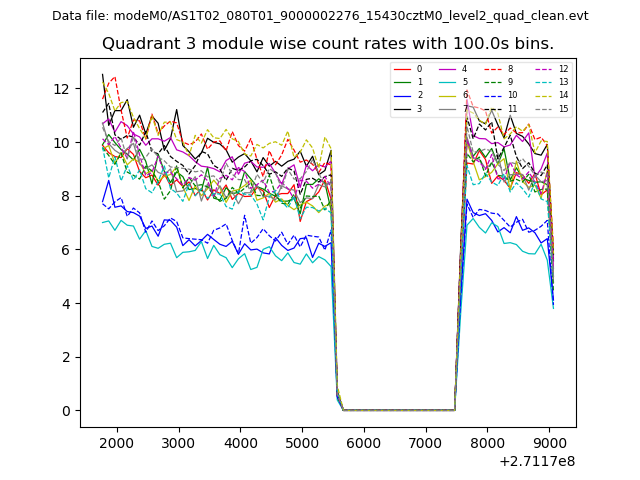
| Module-wise count rates for Quadrant C Data is divided into 100 sec bins |
 |
 |
| Module-wise count rates for Quadrant D Data is divided into 100 sec bins |
 |
 |
| Parameter | Plot |
|---|---|
| CZT HV Monitor | 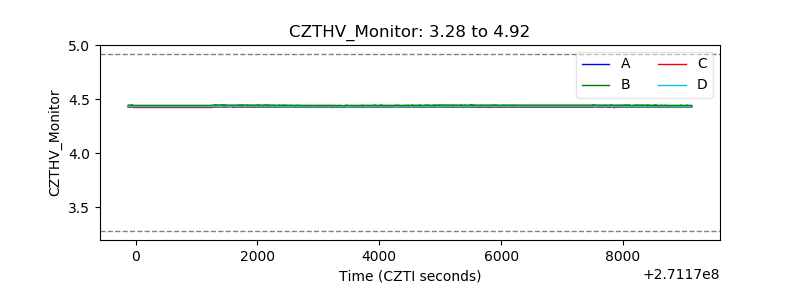 |
| D_VDD | 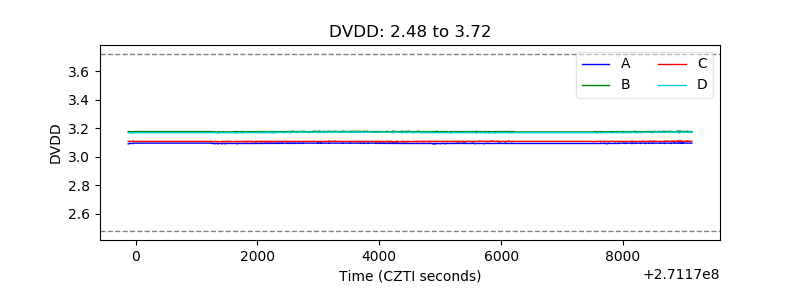 |
| Temperature 1 | 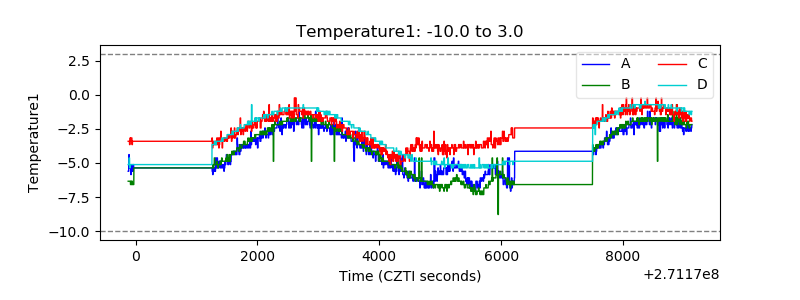 |
| Veto HV Monitor | 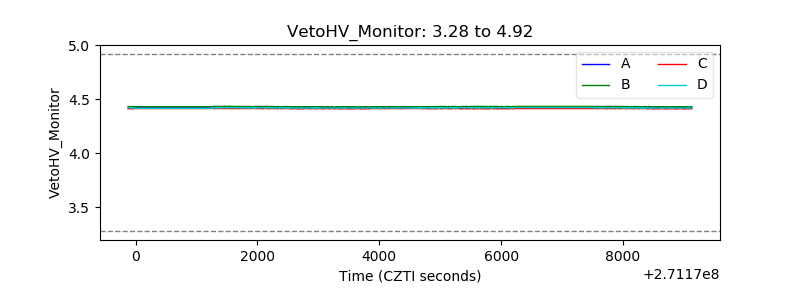 |
| Veto LLD | 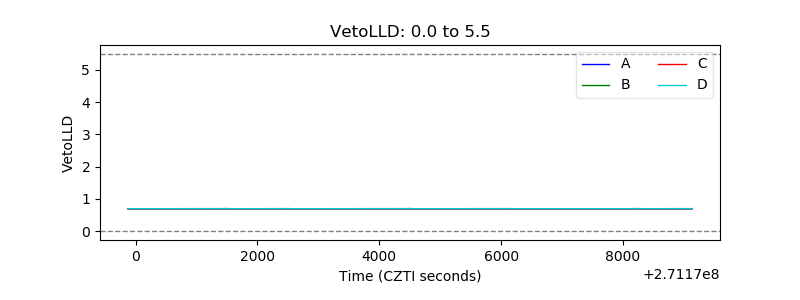 |
| Alpha Counter | 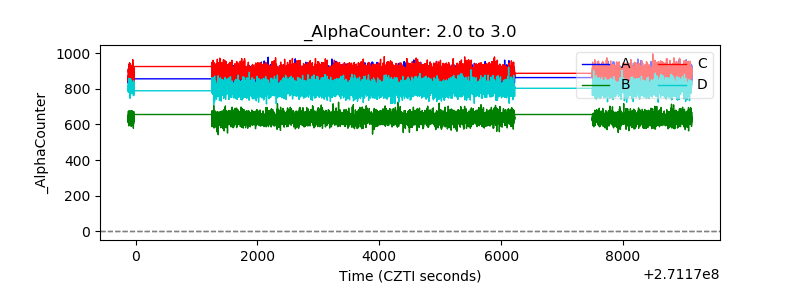 |
| _CPM_Rate | 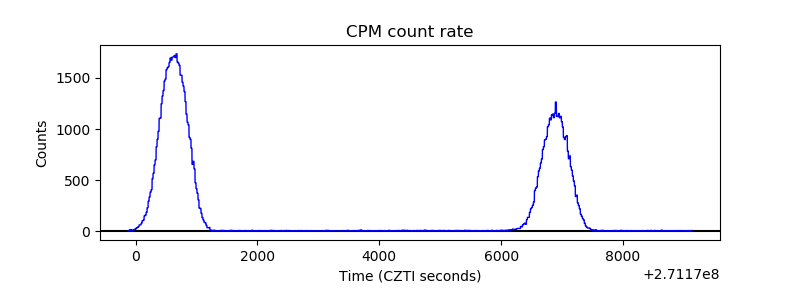 |
| CZT Counter | 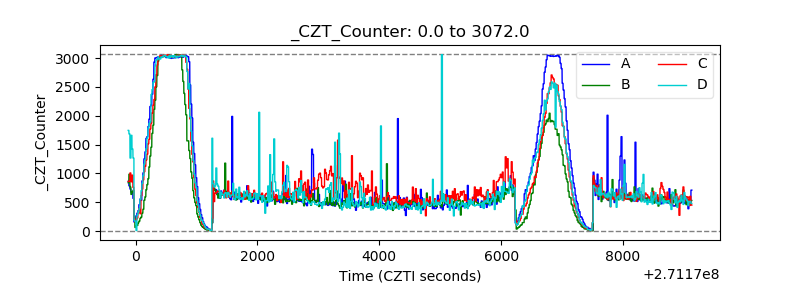 |
| +2.5 Volts monitor |  |
| +5 Volts monitor |  |
| _ROLL_ROT | 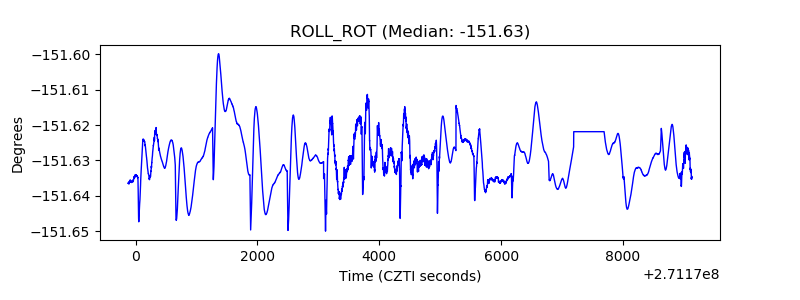 |
| _Roll_DEC | 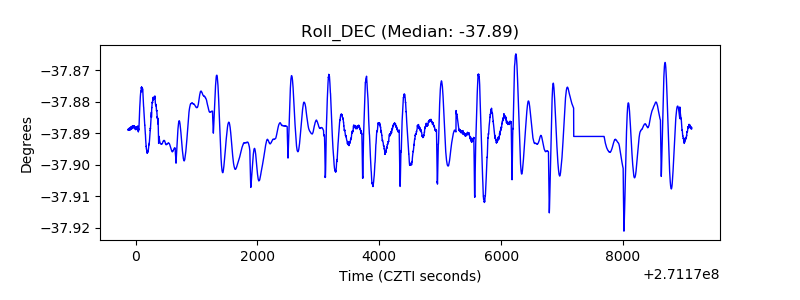 |
| _Roll_RA | 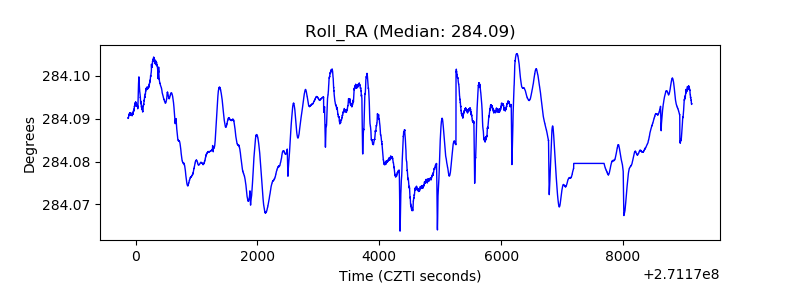 |
| Veto Counter | 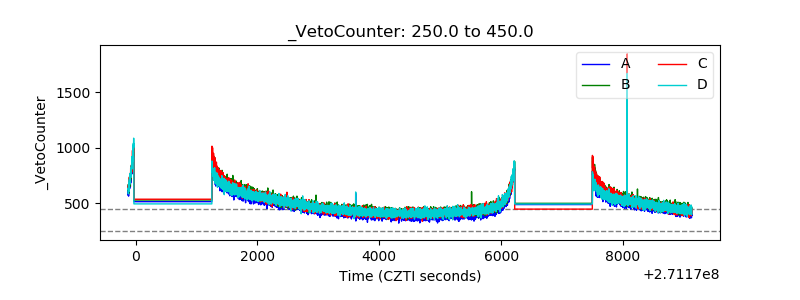 |