| Param | Original file | Final file |
|---|---|---|
| Filename | modeM0/AS1T02_080T01_9000002276_15431cztM0_level2.evt | modeM0/AS1T02_080T01_9000002276_15431cztM0_level2_quad_clean.evt |
| Size (bytes) | 525,528,000 | 110,220,480 |
| Size | 501.2 MB | 105.1 MB |
| Events in quadrant A | 3,388,927 | 733,749 |
| Events in quadrant B | 3,408,881 | 744,527 |
| Events in quadrant C | 4,094,731 | 727,353 |
| Events in quadrant D | 4,582,948 | 679,450 |
| Mode SS | |||
|---|---|---|---|
| Quadrant | BADHDUFLAG | Total packets | Discarded packets |
| A | 0 | 132 | 0 |
| B | 0 | 132 | 0 |
| C | 0 | 132 | 0 |
| D | 0 | 132 | 0 |
| Mode M0 | |||
|---|---|---|---|
| Quadrant | BADHDUFLAG | Total packets | Discarded packets |
| A | 0 | 14211 | 0 |
| B | 0 | 14136 | 0 |
| C | 0 | 16655 | 0 |
| D | 0 | 18013 | 0 |
| Mode M9 | |||
|---|---|---|---|
| Quadrant | BADHDUFLAG | Total packets | Discarded packets |
| A | 0 | 11 | 0 |
| B | 0 | 11 | 0 |
| C | 0 | 11 | 0 |
| D | 0 | 11 | 0 |
| Quadrant | Total seconds | Saturated seconds | Saturation percentage |
|---|---|---|---|
| A | 6485 | 105 | 1.619121% |
| B | 6486 | 95 | 1.464693% |
| C | 6486 | 74 | 1.140919% |
| D | 6485 | 381 | 5.875096% |
Noise dominated data is calculated using 1-second bins in cleaned event files. If a bin has >2000 counts, and if more than 50% of those come from <1% of pixels, then it is considered to be noise-dominated and hence unusable.
| Quadrant | # 1 sec bins | Bins with >0 counts | Bins with >2000 counts | High rate bins dominated by noise | Noise dominated (total time) | Noise dominated (detector-on time) | Marked lightcurve |
|---|---|---|---|---|---|---|---|
| A | 7625 | 6485 | 12 | 12 | 0.16% | 0.19% | 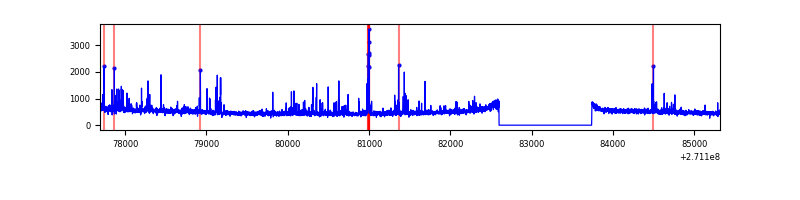 |
| B | 7626 | 6487 | 7 | 7 | 0.09% | 0.11% | 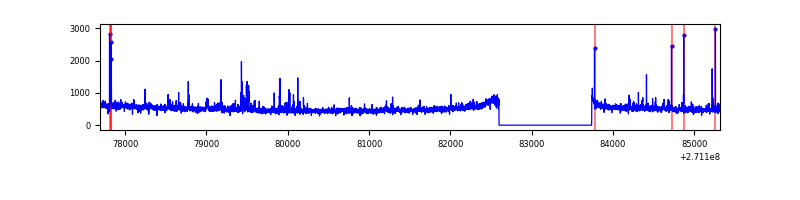 |
| C | 7626 | 6487 | 2 | 2 | 0.03% | 0.03% | 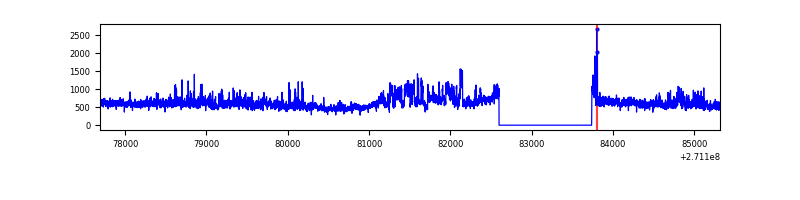 |
| D | 7625 | 6486 | 290 | 290 | 3.80% | 4.47% | 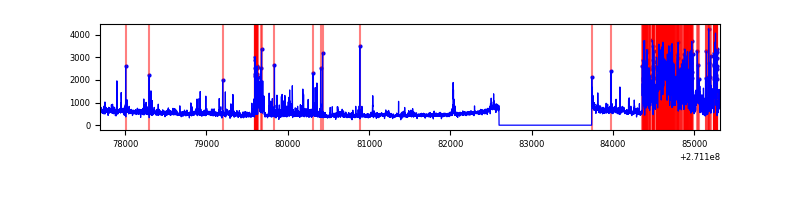 |
Top three noisy pixels from each quadrant. If the there are fewer than three noisy pixels in the level2.evt file, extra rows are filled as -1
| Pixel properties | Quadrant properties | ||||||
|---|---|---|---|---|---|---|---|
| Quadrant | DetID | PixID | Counts | Sigma | Mean | Median | Sigma |
| A | 14 | 238 | 161851 | 964.79 | 820 | 803 | 166.9 |
| A | 14 | 237 | 64423 | 381.13 | 820 | 803 | 166.9 |
| A | 9 | 143 | 14019 | 79.17 | 820 | 803 | 166.9 |
| B | 3 | 209 | 37834 | 242.68 | 815 | 798 | 152.6 |
| B | 4 | 142 | 35393 | 226.69 | 815 | 798 | 152.6 |
| B | 0 | 229 | 34903 | 223.48 | 815 | 798 | 152.6 |
| C | 3 | 233 | 942026 | 5289.17 | 781 | 787 | 178.0 |
| C | 7 | 247 | 81682 | 454.58 | 781 | 787 | 178.0 |
| C | 10 | 22 | 22029 | 119.37 | 781 | 787 | 178.0 |
| D | 1 | 52 | 712662 | 3758.06 | 777 | 756 | 189.4 |
| D | 13 | 122 | 651492 | 3435.15 | 777 | 756 | 189.4 |
| D | 5 | 222 | 106182 | 556.53 | 777 | 756 | 189.4 |
Histogram calculated using DETX and DETY for each event in the final _common_clean file
| Quadrant A |  |
 |
Quadrant B |
|---|---|---|---|
| Quadrant D |  |
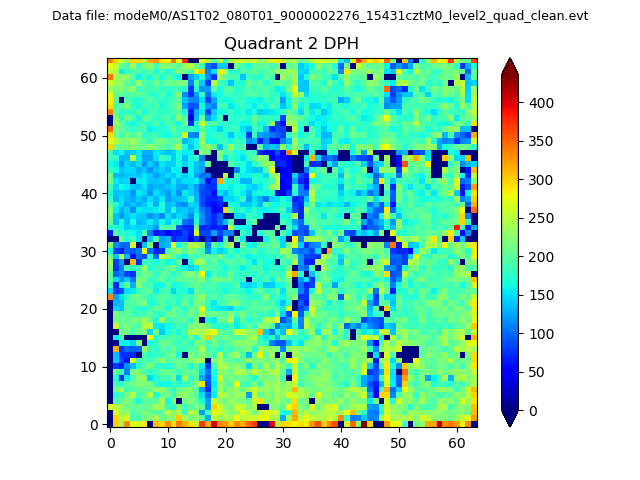 |
Quadrant C |
| Plot type | Count rate plots | Images |
|---|---|---|
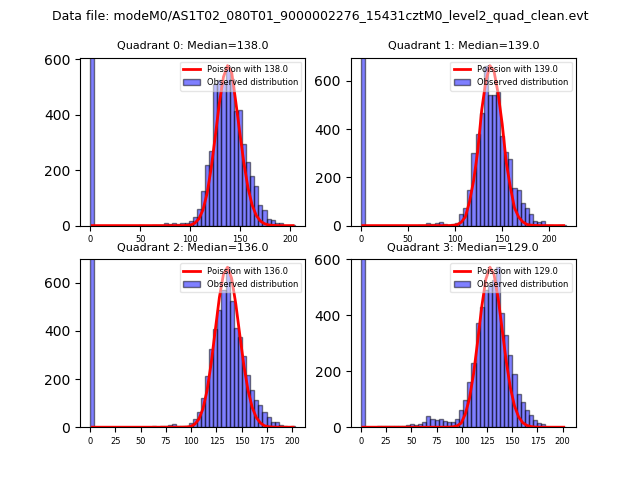
| Comparison with Poisson distribution Blue bars denote a histogram of data divided into 1 sec bins. Red curve is a Poisson curve with rate = median count rate of data. |
 |
 |
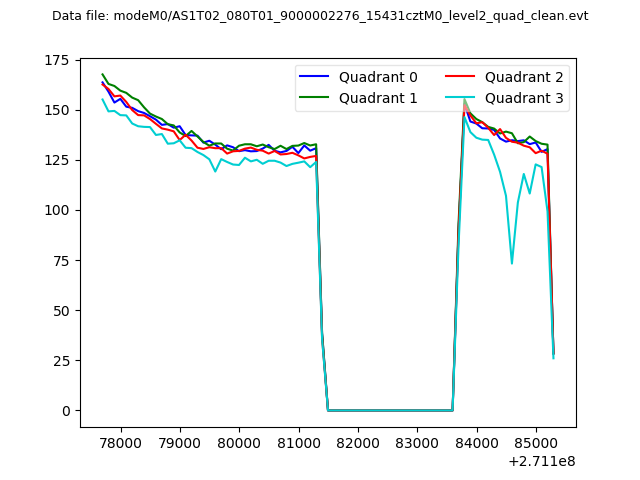
| Quadrant-wise count rates Data is divided into 100 sec bins |
 |
|
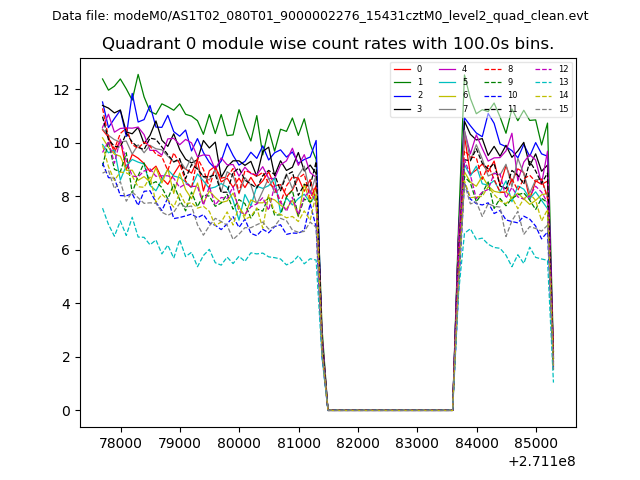
| Module-wise count rates for Quadrant A Data is divided into 100 sec bins |
 |
 |
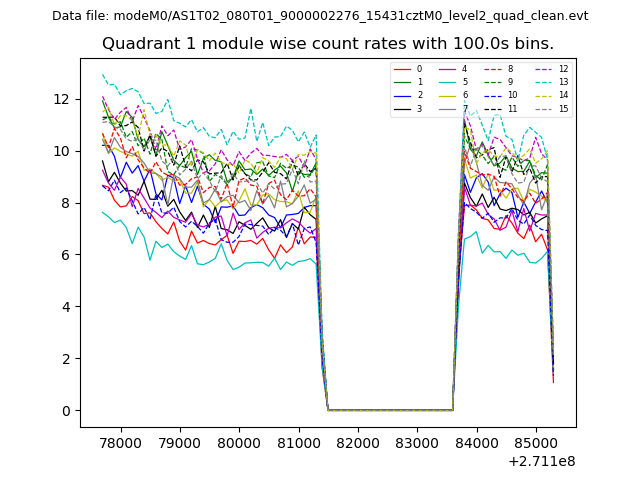
| Module-wise count rates for Quadrant B Data is divided into 100 sec bins |
 |
 |
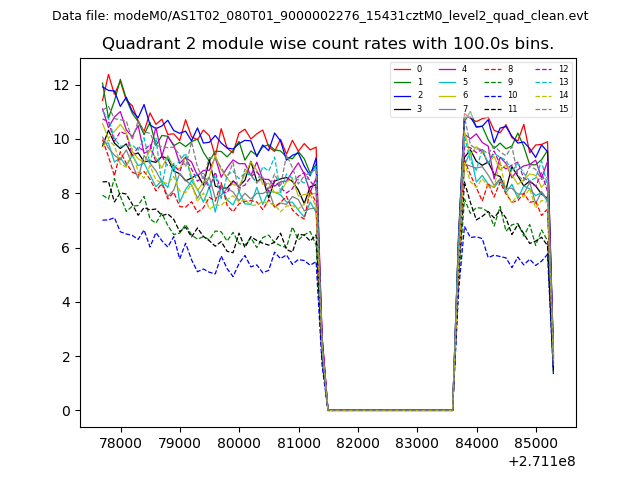
| Module-wise count rates for Quadrant C Data is divided into 100 sec bins |
 |
 |
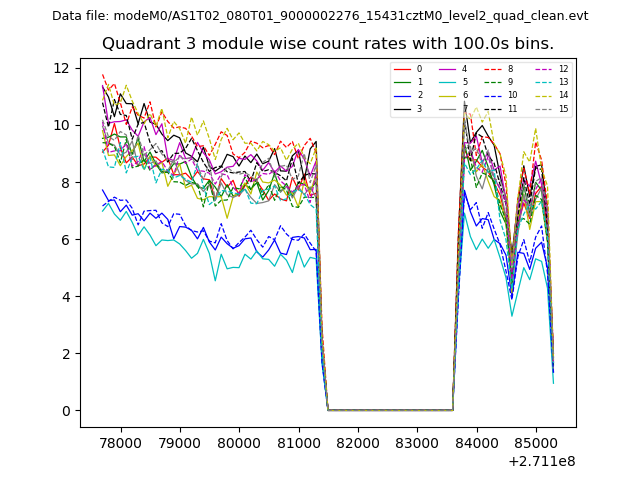
| Module-wise count rates for Quadrant D Data is divided into 100 sec bins |
 |
 |
| Parameter | Plot |
|---|---|
| CZT HV Monitor | 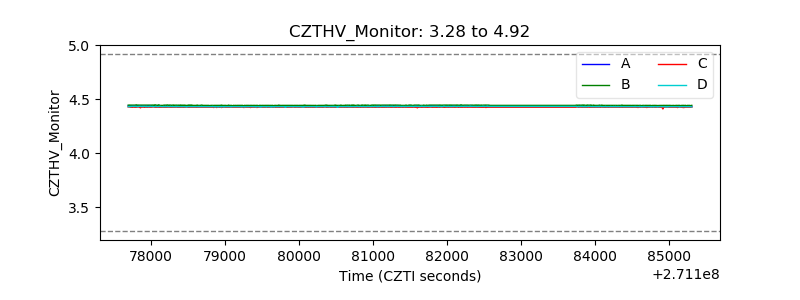 |
| D_VDD |  |
| Temperature 1 | 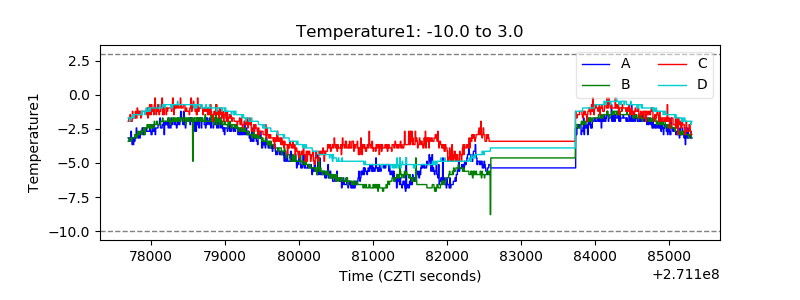 |
| Veto HV Monitor | 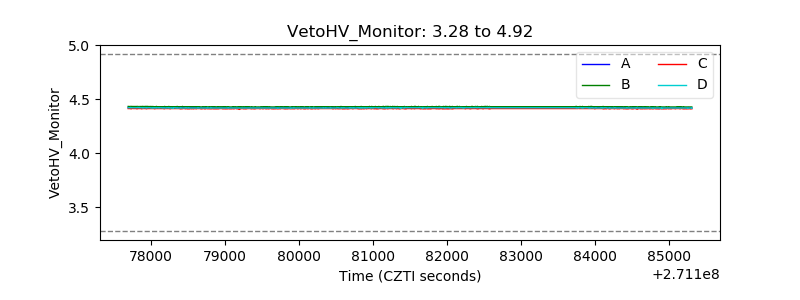 |
| Veto LLD | 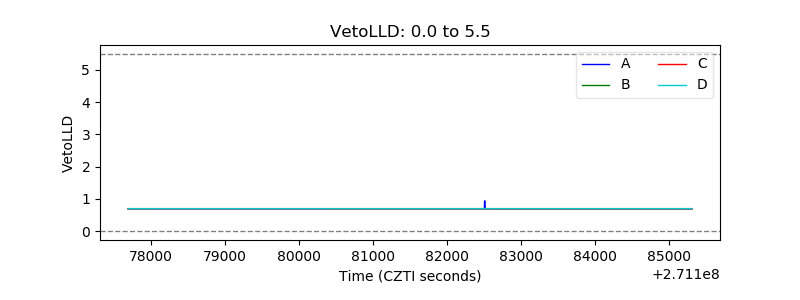 |
| Alpha Counter | 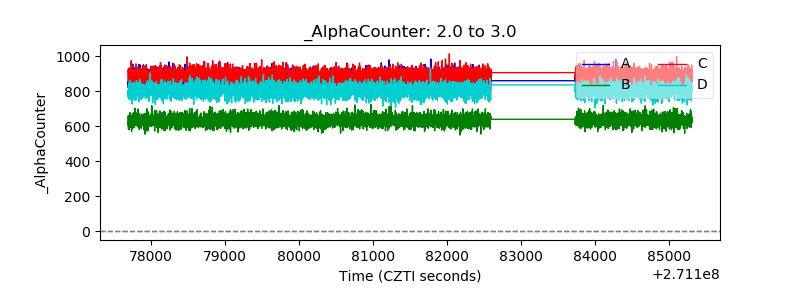 |
| _CPM_Rate | 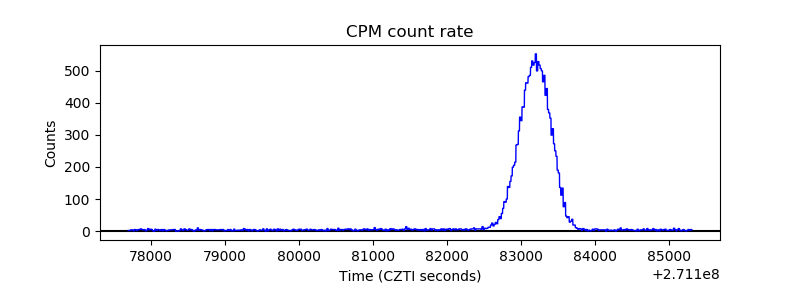 |
| CZT Counter | 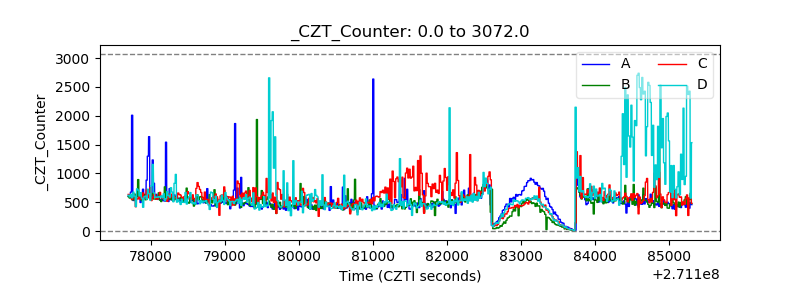 |
| +2.5 Volts monitor |  |
| +5 Volts monitor | 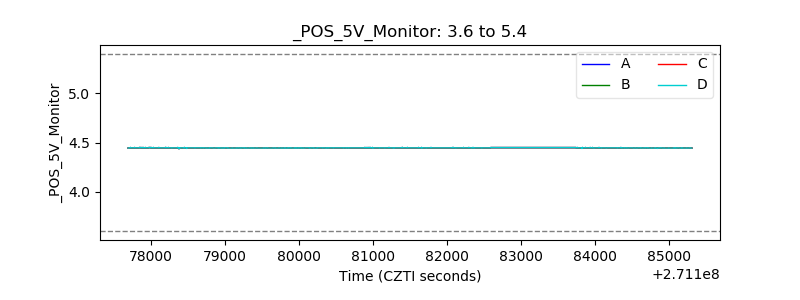 |
| _ROLL_ROT | 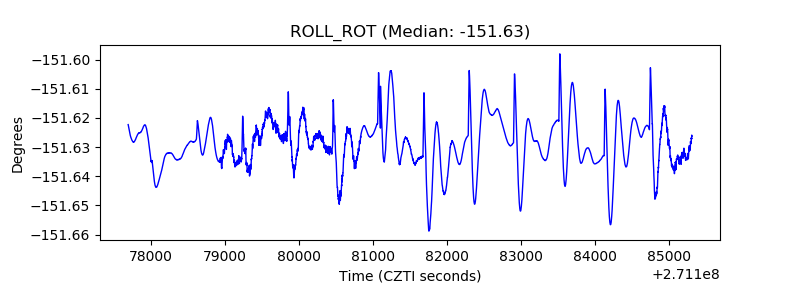 |
| _Roll_DEC | 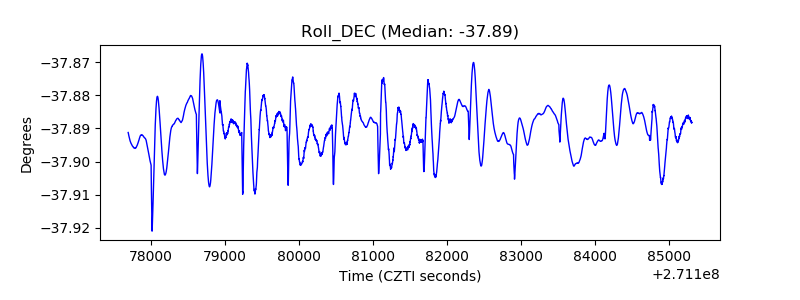 |
| _Roll_RA | 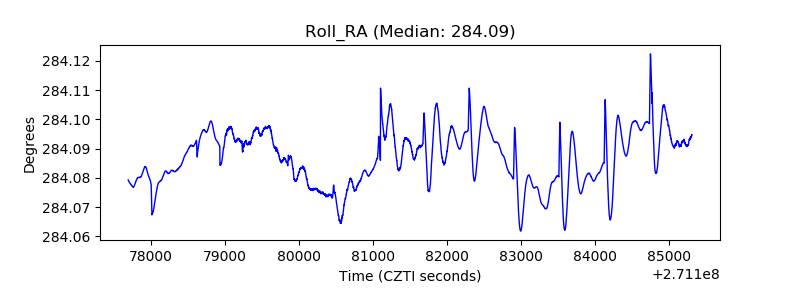 |
| Veto Counter | 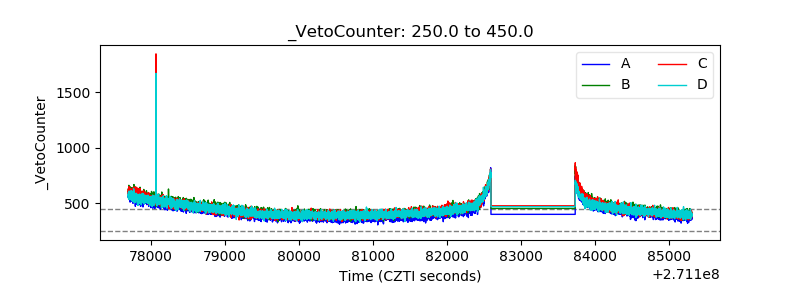 |