| Param | Original file | Final file |
|---|---|---|
| Filename | modeM0/AS1T02_080T01_9000002276_15433cztM0_level2.evt | modeM0/AS1T02_080T01_9000002276_15433cztM0_level2_quad_clean.evt |
| Size (bytes) | 612,144,000 | 99,259,200 |
| Size | 583.8 MB | 94.7 MB |
| Events in quadrant A | 3,508,590 | 636,108 |
| Events in quadrant B | 3,682,150 | 651,189 |
| Events in quadrant C | 5,025,622 | 635,158 |
| Events in quadrant D | 5,839,226 | 586,168 |
| Mode SS | |||
|---|---|---|---|
| Quadrant | BADHDUFLAG | Total packets | Discarded packets |
| A | 0 | 144 | 0 |
| B | 0 | 144 | 0 |
| C | 0 | 144 | 0 |
| D | 0 | 144 | 0 |
| Mode M0 | |||
|---|---|---|---|
| Quadrant | BADHDUFLAG | Total packets | Discarded packets |
| A | 0 | 15238 | 0 |
| B | 0 | 15587 | 0 |
| C | 0 | 19719 | 0 |
| D | 0 | 22205 | 0 |
| Mode M9 | |||
|---|---|---|---|
| Quadrant | BADHDUFLAG | Total packets | Discarded packets |
| A | 0 | 6 | 0 |
| B | 0 | 7 | 0 |
| C | 0 | 7 | 0 |
| D | 0 | 7 | 0 |
| Quadrant | Total seconds | Saturated seconds | Saturation percentage |
|---|---|---|---|
| A | 7145 | 65 | 0.909727% |
| B | 7145 | 50 | 0.699790% |
| C | 7144 | 154 | 2.155655% |
| D | 7144 | 432 | 6.047032% |
Noise dominated data is calculated using 1-second bins in cleaned event files. If a bin has >2000 counts, and if more than 50% of those come from <1% of pixels, then it is considered to be noise-dominated and hence unusable.
| Quadrant | # 1 sec bins | Bins with >0 counts | Bins with >2000 counts | High rate bins dominated by noise | Noise dominated (total time) | Noise dominated (detector-on time) | Marked lightcurve |
|---|---|---|---|---|---|---|---|
| A | 7680 | 7146 | 32 | 32 | 0.42% | 0.45% | 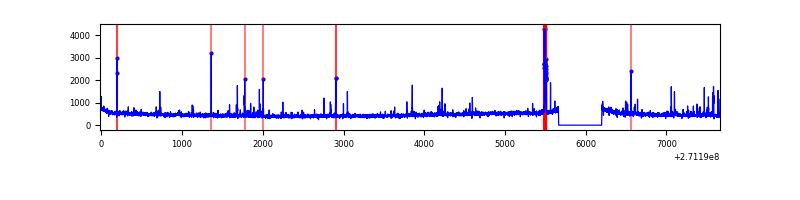 |
| B | 7680 | 7146 | 10 | 10 | 0.13% | 0.14% | 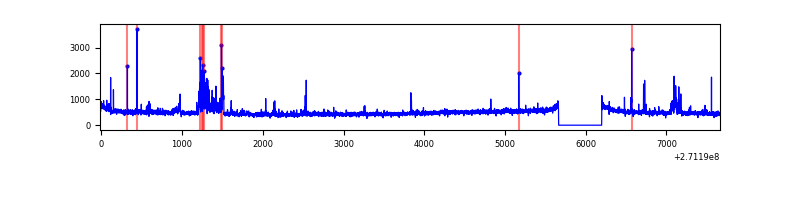 |
| C | 7679 | 7145 | 64 | 64 | 0.83% | 0.90% | 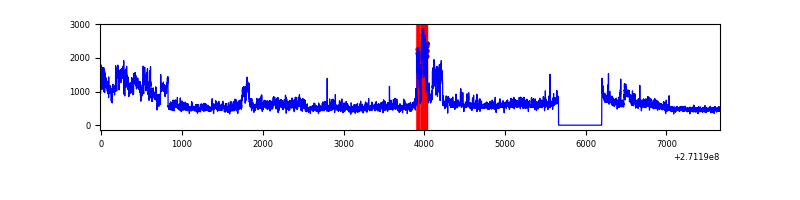 |
| D | 7679 | 7145 | 394 | 394 | 5.13% | 5.51% | 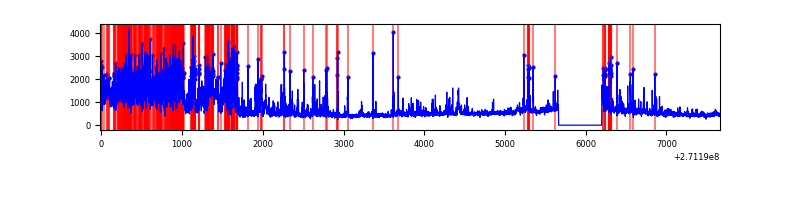 |
Top three noisy pixels from each quadrant. If the there are fewer than three noisy pixels in the level2.evt file, extra rows are filled as -1
| Pixel properties | Quadrant properties | ||||||
|---|---|---|---|---|---|---|---|
| Quadrant | DetID | PixID | Counts | Sigma | Mean | Median | Sigma |
| A | 14 | 238 | 79009 | 456.52 | 850 | 832 | 171.2 |
| A | 15 | 69 | 64903 | 374.15 | 850 | 832 | 171.2 |
| A | 14 | 237 | 34795 | 198.33 | 850 | 832 | 171.2 |
| B | 4 | 142 | 196783 | 1206.65 | 853 | 833 | 162.4 |
| B | 0 | 190 | 27168 | 162.17 | 853 | 833 | 162.4 |
| B | 0 | 229 | 25922 | 154.5 | 853 | 833 | 162.4 |
| C | 3 | 233 | 1806191 | 9599.34 | 815 | 820 | 188.1 |
| C | 7 | 247 | 30153 | 155.97 | 815 | 820 | 188.1 |
| C | 13 | 61 | 5938 | 27.21 | 815 | 820 | 188.1 |
| D | 1 | 52 | 2120492 | 10691.43 | 808 | 784 | 198.3 |
| D | 5 | 222 | 279270 | 1404.63 | 808 | 784 | 198.3 |
| D | 13 | 122 | 101173 | 506.34 | 808 | 784 | 198.3 |
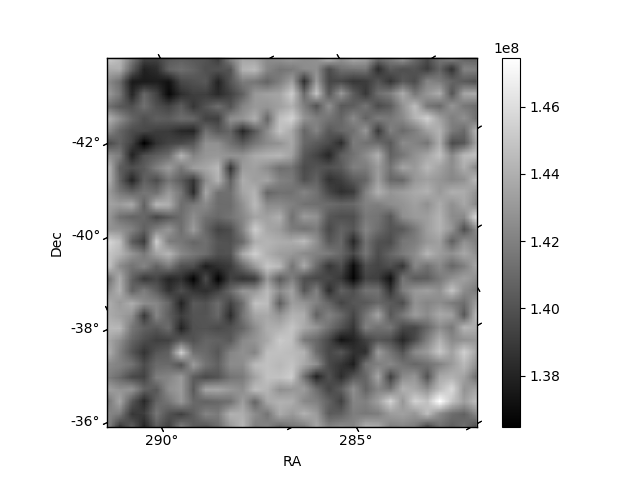
Histogram calculated using DETX and DETY for each event in the final _common_clean file
| Quadrant A |  |
 |
Quadrant B |
|---|---|---|---|
| Quadrant D |  |
 |
Quadrant C |
| Plot type | Count rate plots | Images |
|---|---|---|
| Comparison with Poisson distribution Blue bars denote a histogram of data divided into 1 sec bins. Red curve is a Poisson curve with rate = median count rate of data. |
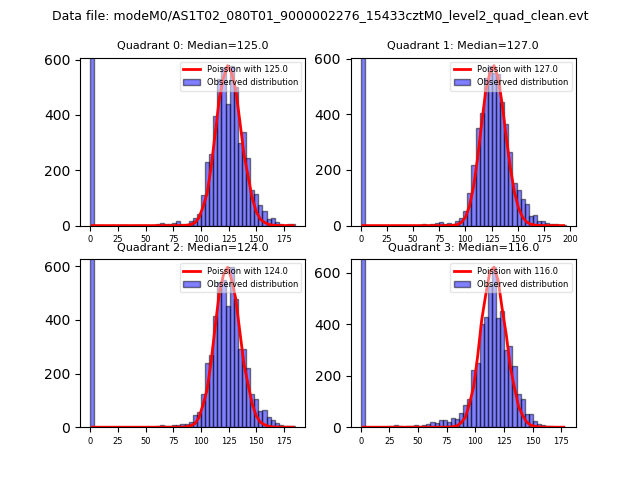 |
 |
| Quadrant-wise count rates Data is divided into 100 sec bins |
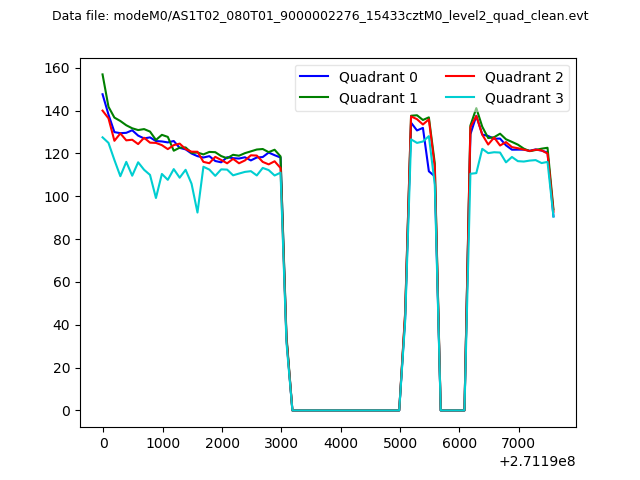 |
|
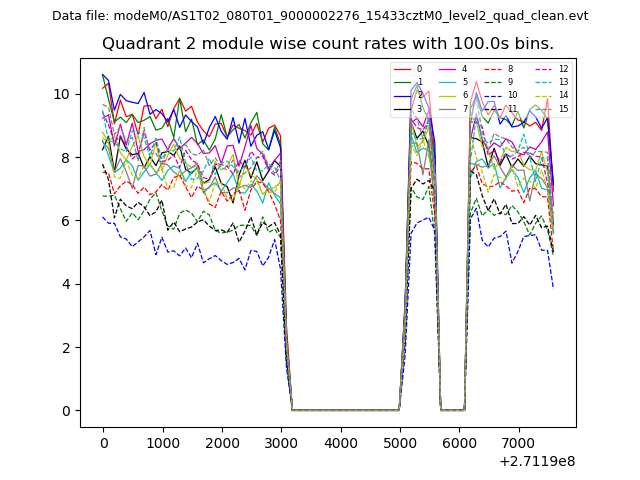
| Module-wise count rates for Quadrant A Data is divided into 100 sec bins |
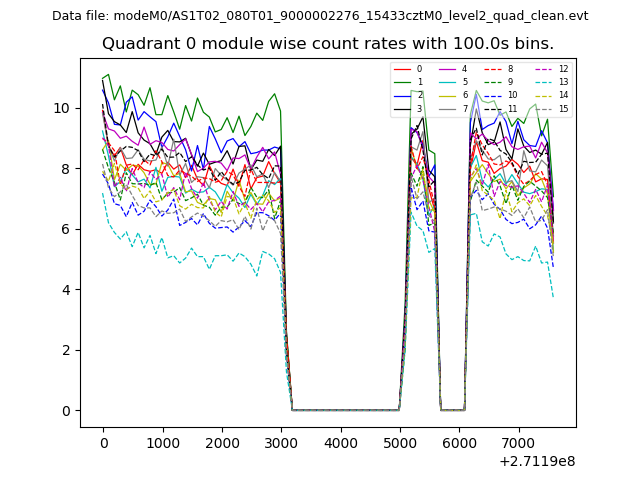 |
 |
| Module-wise count rates for Quadrant B Data is divided into 100 sec bins |
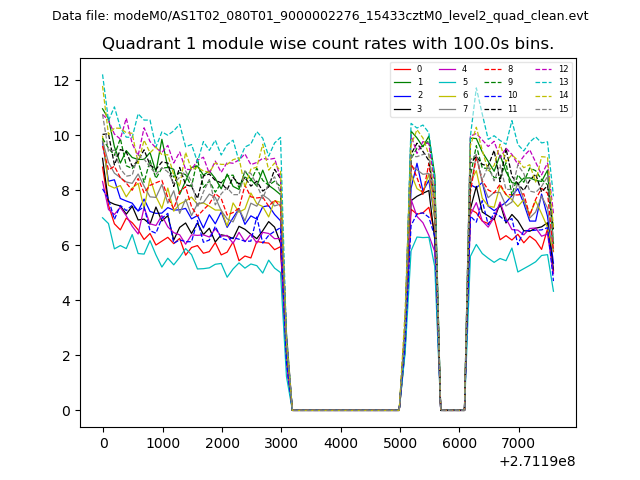 |
 |
| Module-wise count rates for Quadrant C Data is divided into 100 sec bins |
 |
 |
| Module-wise count rates for Quadrant D Data is divided into 100 sec bins |
 |
 |
| Parameter | Plot |
|---|---|
| CZT HV Monitor | 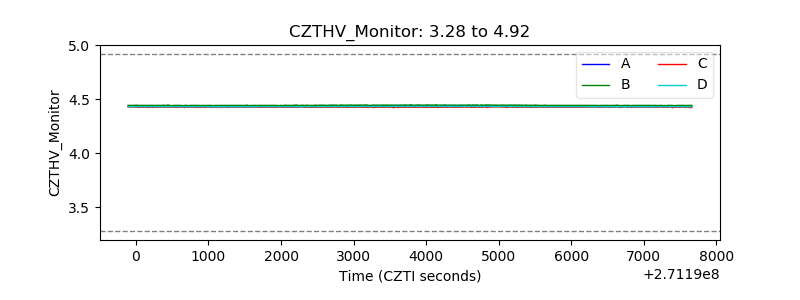 |
| D_VDD |  |
| Temperature 1 |  |
| Veto HV Monitor |  |
| Veto LLD |  |
| Alpha Counter | 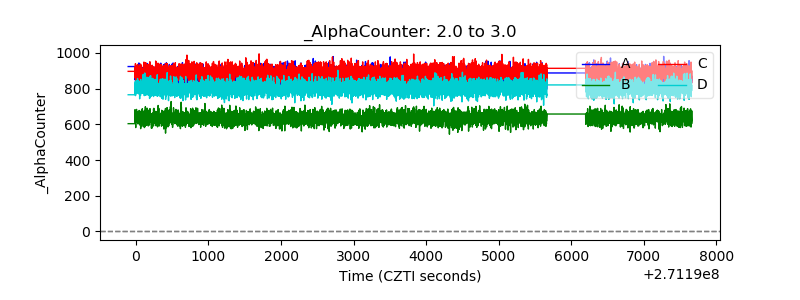 |
| _CPM_Rate | 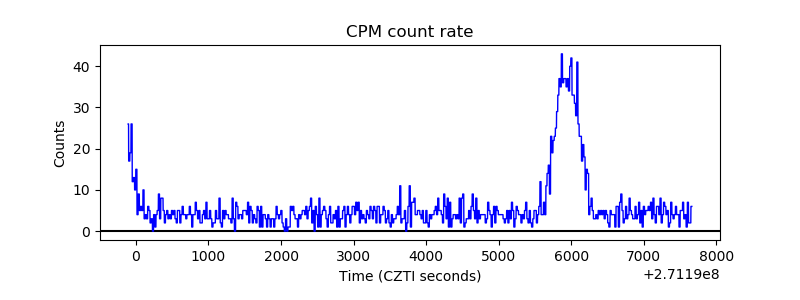 |
| CZT Counter |  |
| +2.5 Volts monitor |  |
| +5 Volts monitor |  |
| _ROLL_ROT |  |
| _Roll_DEC |  |
| _Roll_RA |  |
| Veto Counter |  |