| Param | Original file | Final file |
|---|---|---|
| Filename | modeM0/AS1T02_080T01_9000002276_15434cztM0_level2.evt | modeM0/AS1T02_080T01_9000002276_15434cztM0_level2_quad_clean.evt |
| Size (bytes) | 546,592,320 | 106,246,080 |
| Size | 521.3 MB | 101.3 MB |
| Events in quadrant A | 3,784,877 | 675,979 |
| Events in quadrant B | 3,711,965 | 691,540 |
| Events in quadrant C | 3,929,714 | 683,793 |
| Events in quadrant D | 4,616,557 | 642,689 |
| Mode SS | |||
|---|---|---|---|
| Quadrant | BADHDUFLAG | Total packets | Discarded packets |
| A | 0 | 152 | 0 |
| B | 0 | 152 | 0 |
| C | 0 | 152 | 0 |
| D | 0 | 152 | 0 |
| Mode M0 | |||
|---|---|---|---|
| Quadrant | BADHDUFLAG | Total packets | Discarded packets |
| A | 0 | 16345 | 0 |
| B | 0 | 15948 | 0 |
| C | 0 | 16504 | 0 |
| D | 0 | 18822 | 0 |
| Mode M9 | |||
|---|---|---|---|
| Quadrant | BADHDUFLAG | Total packets | Discarded packets |
| A | 0 | 4 | 0 |
| B | 0 | 5 | 0 |
| C | 0 | 5 | 0 |
| D | 0 | 5 | 0 |
| Quadrant | Total seconds | Saturated seconds | Saturation percentage |
|---|---|---|---|
| A | 7528 | 92 | 1.222104% |
| B | 7528 | 58 | 0.770457% |
| C | 7528 | 17 | 0.225824% |
| D | 7528 | 169 | 2.244952% |
Noise dominated data is calculated using 1-second bins in cleaned event files. If a bin has >2000 counts, and if more than 50% of those come from <1% of pixels, then it is considered to be noise-dominated and hence unusable.
| Quadrant | # 1 sec bins | Bins with >0 counts | Bins with >2000 counts | High rate bins dominated by noise | Noise dominated (total time) | Noise dominated (detector-on time) | Marked lightcurve |
|---|---|---|---|---|---|---|---|
| A | 7833 | 7529 | 43 | 43 | 0.55% | 0.57% | 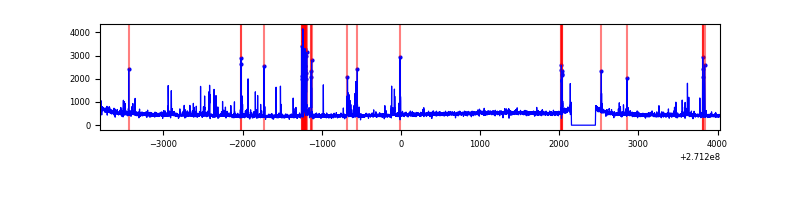 |
| B | 7833 | 7529 | 9 | 9 | 0.11% | 0.12% | 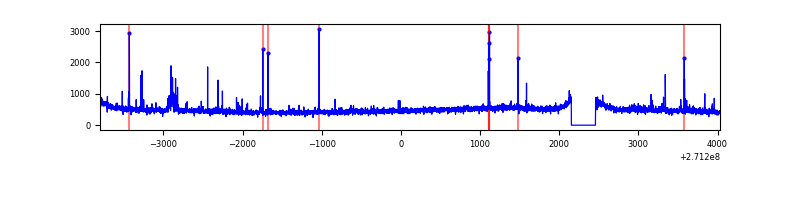 |
| C | 7833 | 7529 | 2 | 2 | 0.03% | 0.03% | 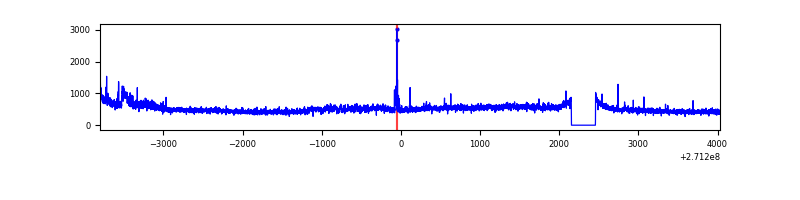 |
| D | 7833 | 7529 | 121 | 121 | 1.54% | 1.61% | 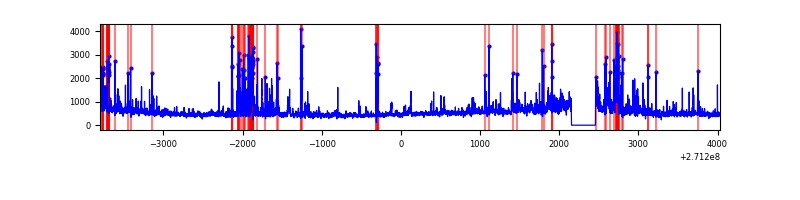 |
Top three noisy pixels from each quadrant. If the there are fewer than three noisy pixels in the level2.evt file, extra rows are filled as -1
| Pixel properties | Quadrant properties | ||||||
|---|---|---|---|---|---|---|---|
| Quadrant | DetID | PixID | Counts | Sigma | Mean | Median | Sigma |
| A | 14 | 238 | 205606 | 1133.91 | 887 | 865 | 180.6 |
| A | 14 | 237 | 91349 | 501.12 | 887 | 865 | 180.6 |
| A | 9 | 143 | 23511 | 125.42 | 887 | 865 | 180.6 |
| B | 4 | 142 | 46080 | 266.09 | 893 | 868 | 169.9 |
| B | 0 | 219 | 25584 | 145.47 | 893 | 868 | 169.9 |
| B | 0 | 229 | 25267 | 143.6 | 893 | 868 | 169.9 |
| C | 3 | 233 | 545681 | 2760.35 | 855 | 860 | 197.4 |
| C | 7 | 247 | 25865 | 126.69 | 855 | 860 | 197.4 |
| C | 8 | 128 | 10957 | 51.15 | 855 | 860 | 197.4 |
| D | 1 | 52 | 800539 | 3831.17 | 850 | 824 | 208.7 |
| D | 5 | 222 | 281354 | 1343.93 | 850 | 824 | 208.7 |
| D | 13 | 122 | 79185 | 375.4 | 850 | 824 | 208.7 |
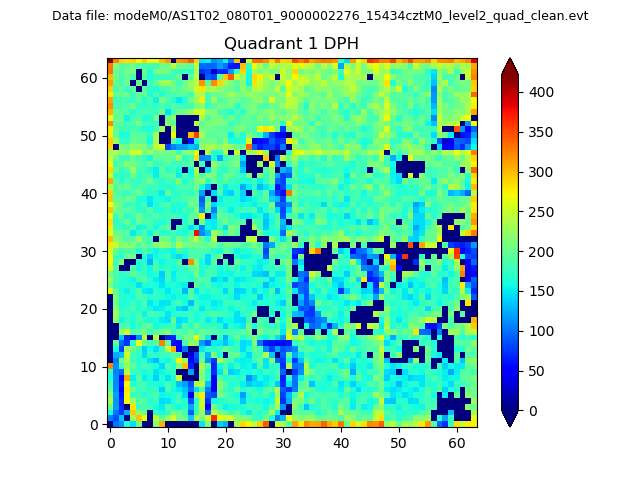
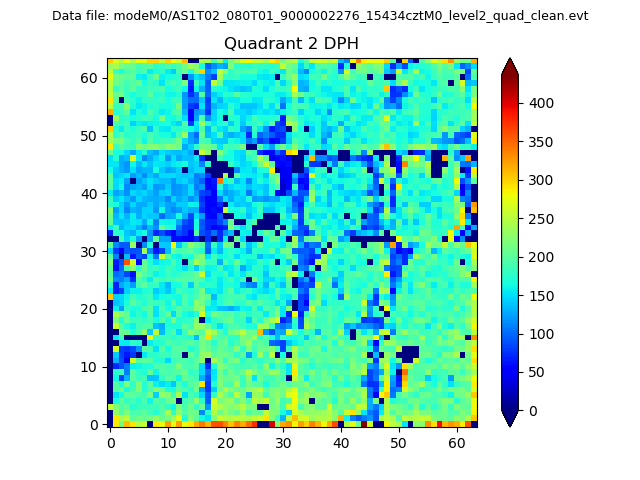
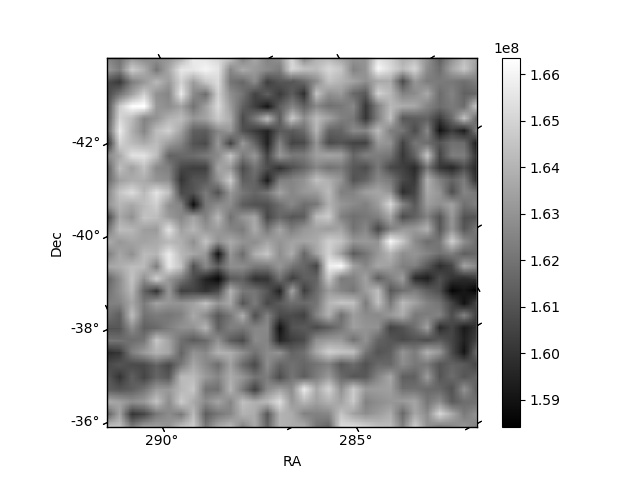
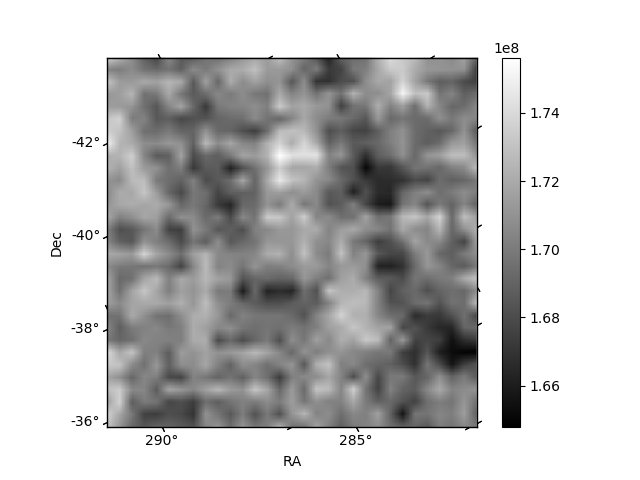
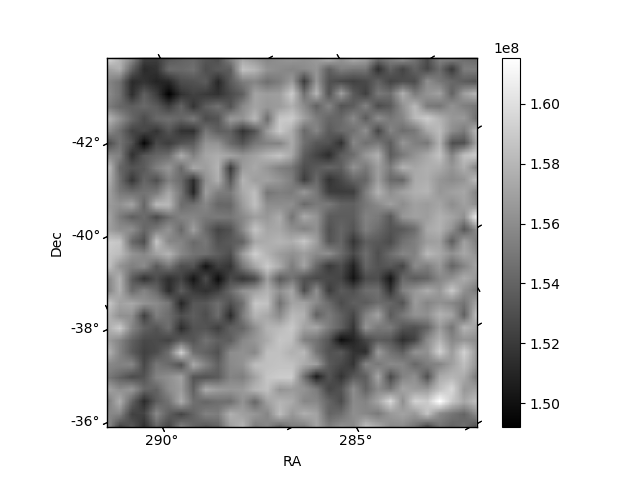
Histogram calculated using DETX and DETY for each event in the final _common_clean file
| Quadrant A |  |
 |
Quadrant B |
|---|---|---|---|
| Quadrant D |  |
 |
Quadrant C |
| Plot type | Count rate plots | Images |
|---|---|---|
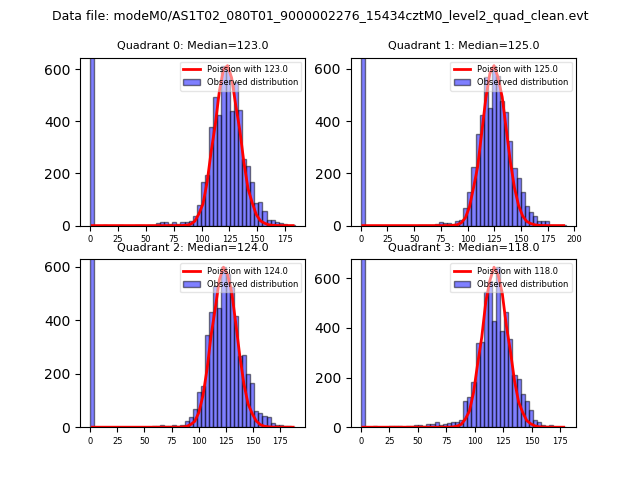
| Comparison with Poisson distribution Blue bars denote a histogram of data divided into 1 sec bins. Red curve is a Poisson curve with rate = median count rate of data. |
 |
 |
| Quadrant-wise count rates Data is divided into 100 sec bins |
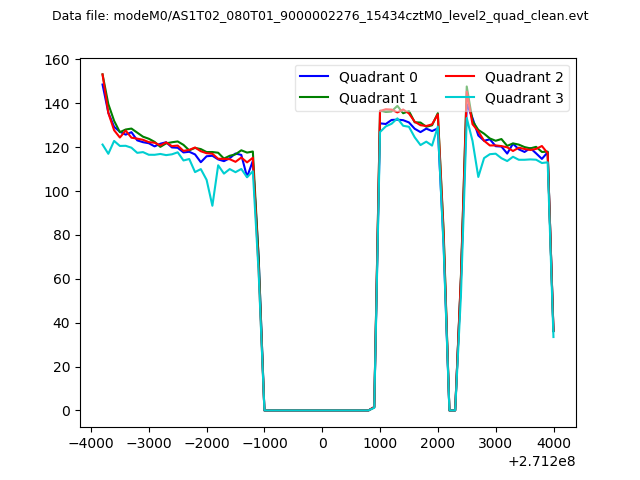 |
|
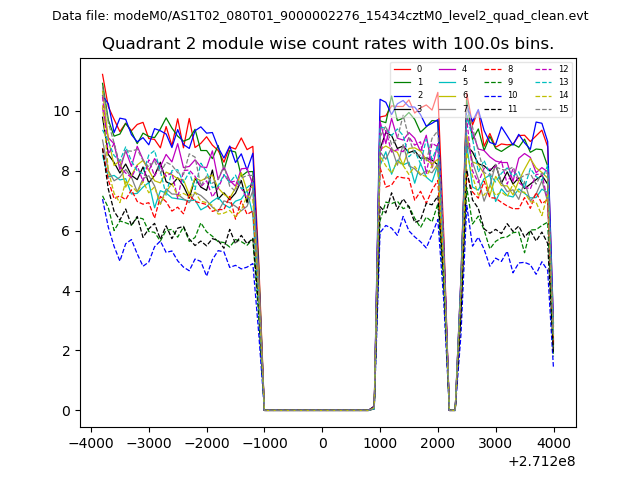
| Module-wise count rates for Quadrant A Data is divided into 100 sec bins |
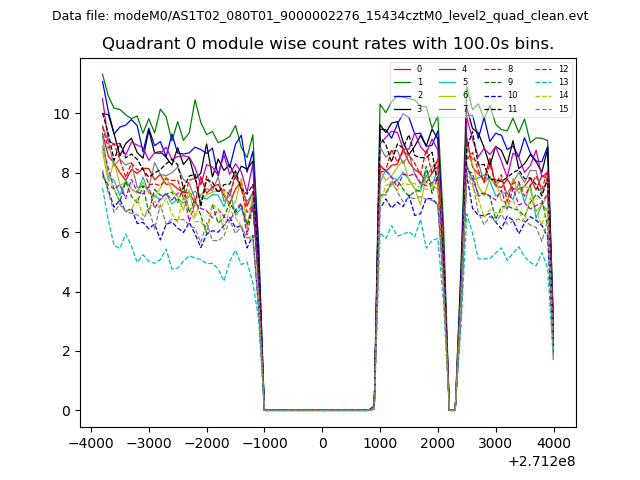 |
 |
| Module-wise count rates for Quadrant B Data is divided into 100 sec bins |
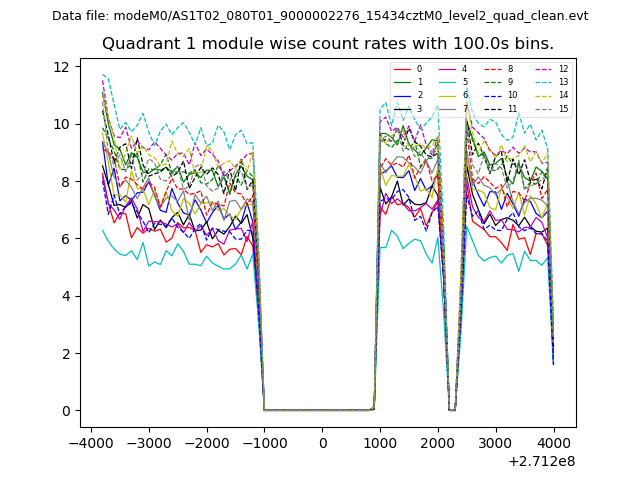 |
 |
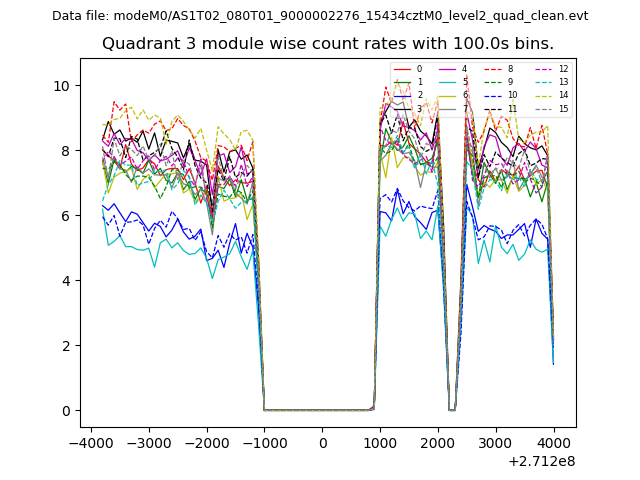
| Module-wise count rates for Quadrant C Data is divided into 100 sec bins |
 |
 |
| Module-wise count rates for Quadrant D Data is divided into 100 sec bins |
 |
 |
| Parameter | Plot |
|---|---|
| CZT HV Monitor | 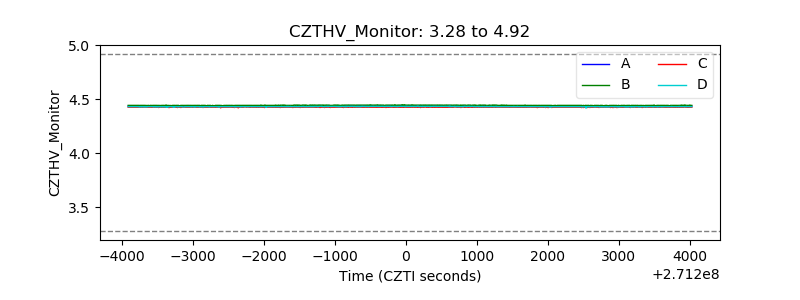 |
| D_VDD | 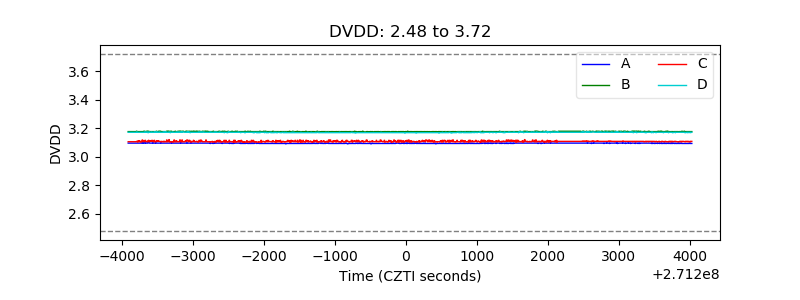 |
| Temperature 1 | 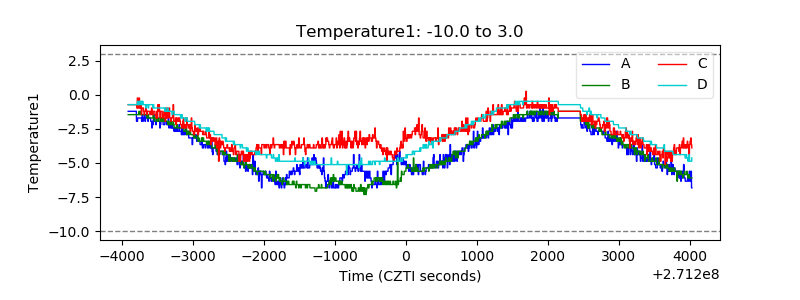 |
| Veto HV Monitor | 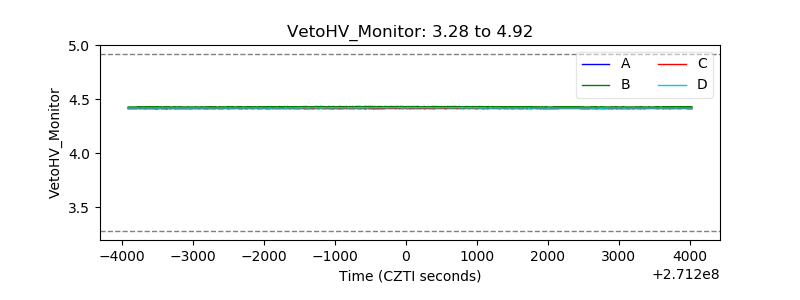 |
| Veto LLD | 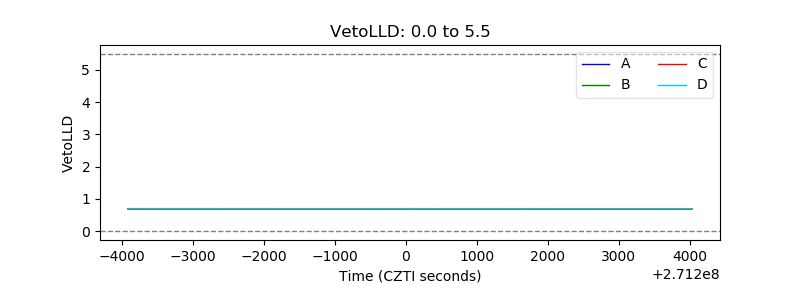 |
| Alpha Counter | 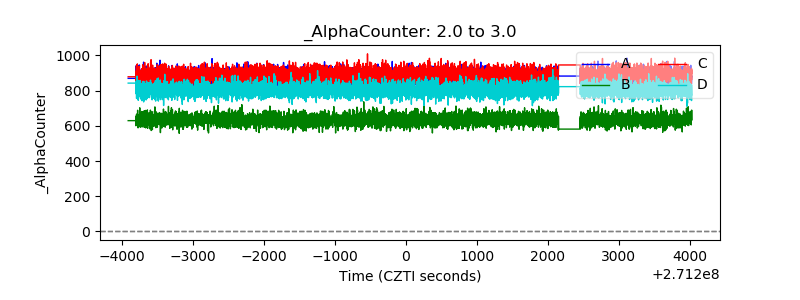 |
| _CPM_Rate | 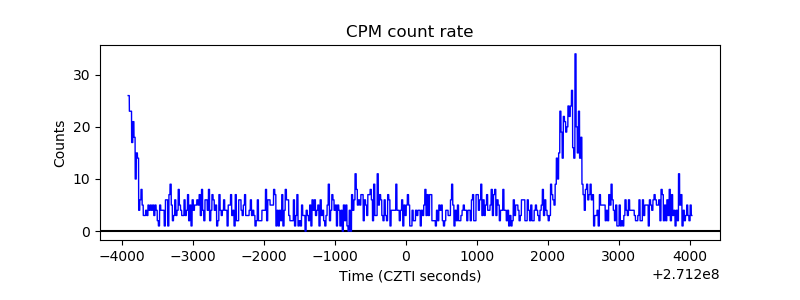 |
| CZT Counter |  |
| +2.5 Volts monitor |  |
| +5 Volts monitor |  |
| _ROLL_ROT | 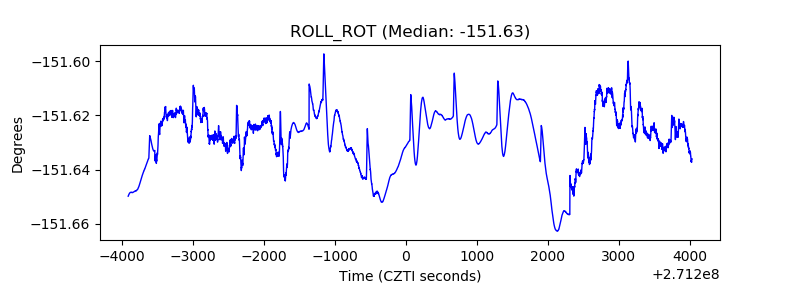 |
| _Roll_DEC | 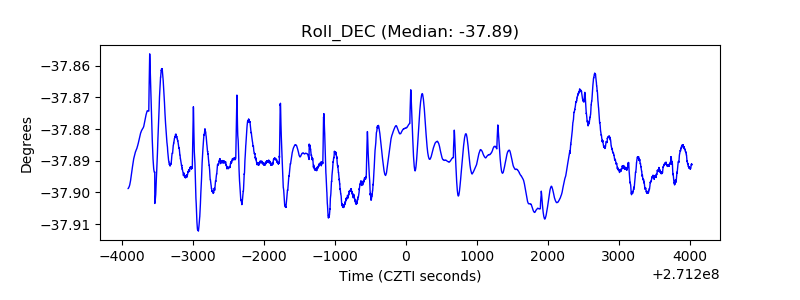 |
| _Roll_RA | 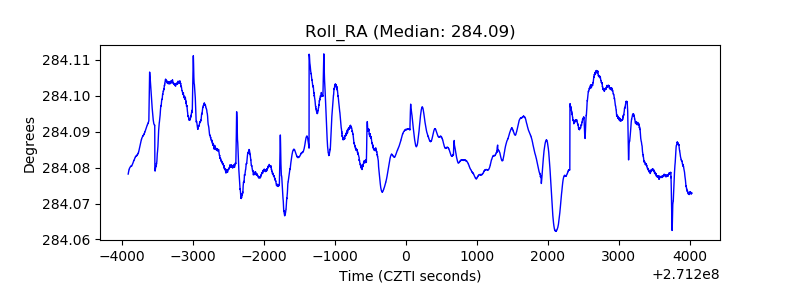 |
| Veto Counter | 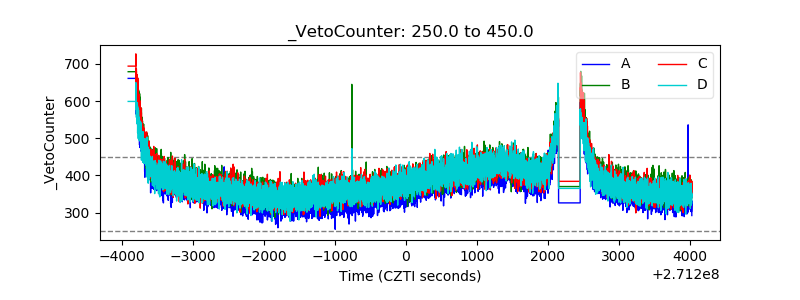 |