| Param | Original file | Final file |
|---|---|---|
| Filename | modeM0/AS1T02_080T01_9000002276_15438cztM0_level2.evt | modeM0/AS1T02_080T01_9000002276_15438cztM0_level2_quad_clean.evt |
| Size (bytes) | 1,429,341,120 | 223,617,600 |
| Size | 1.3 GB | 213.3 MB |
| Events in quadrant A | 9,905,396 | 1,389,123 |
| Events in quadrant B | 8,868,512 | 1,421,256 |
| Events in quadrant C | 9,773,646 | 1,406,424 |
| Events in quadrant D | 13,504,734 | 1,293,699 |
| Mode SS | |||
|---|---|---|---|
| Quadrant | BADHDUFLAG | Total packets | Discarded packets |
| A | 0 | 374 | 0 |
| B | 0 | 374 | 0 |
| C | 0 | 374 | 0 |
| D | 0 | 374 | 0 |
| Mode M0 | |||
|---|---|---|---|
| Quadrant | BADHDUFLAG | Total packets | Discarded packets |
| A | 0 | 41765 | 5 |
| B | 0 | 38228 | 4 |
| C | 0 | 40171 | 4 |
| D | 0 | 52742 | 4 |
| Mode M9 | |||
|---|---|---|---|
| Quadrant | BADHDUFLAG | Total packets | Discarded packets |
| A | 0 | 26 | 0 |
| B | 0 | 26 | 0 |
| C | 0 | 26 | 0 |
| D | 0 | 26 | 0 |
| Quadrant | Total seconds | Saturated seconds | Saturation percentage |
|---|---|---|---|
| A | 18308 | 149 | 0.813852% |
| B | 18308 | 144 | 0.786541% |
| C | 18308 | 138 | 0.753769% |
| D | 18308 | 1173 | 6.407035% |
Noise dominated data is calculated using 1-second bins in cleaned event files. If a bin has >2000 counts, and if more than 50% of those come from <1% of pixels, then it is considered to be noise-dominated and hence unusable.
| Quadrant | # 1 sec bins | Bins with >0 counts | Bins with >2000 counts | High rate bins dominated by noise | Noise dominated (total time) | Noise dominated (detector-on time) | Marked lightcurve |
|---|---|---|---|---|---|---|---|
| A | 20869 | 18313 | 17 | 17 | 0.08% | 0.09% | 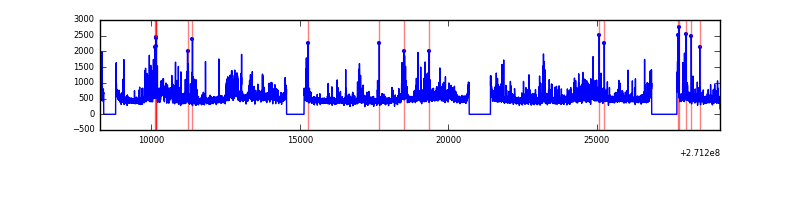 |
| B | 20869 | 18313 | 11 | 11 | 0.05% | 0.06% | 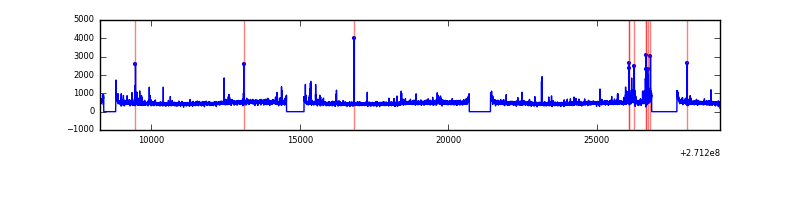 |
| C | 20869 | 18312 | 30 | 30 | 0.14% | 0.16% | 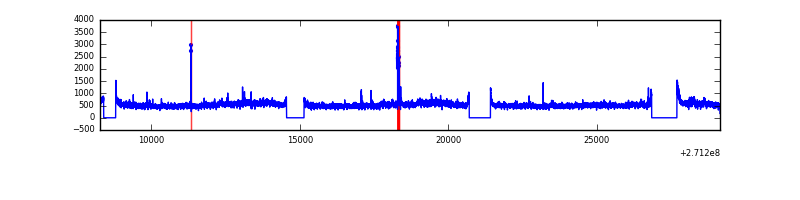 |
| D | 20869 | 18311 | 871 | 871 | 4.17% | 4.76% | 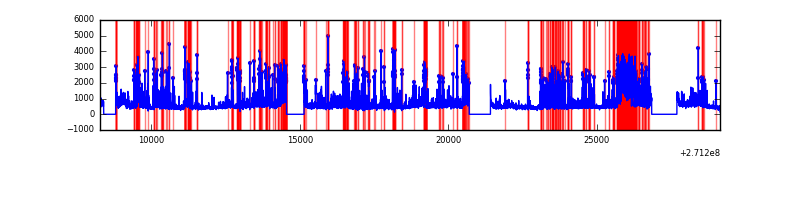 |
Top three noisy pixels from each quadrant. If the there are fewer than three noisy pixels in the level2.evt file, extra rows are filled as -1
| Pixel properties | Quadrant properties | ||||||
|---|---|---|---|---|---|---|---|
| Quadrant | DetID | PixID | Counts | Sigma | Mean | Median | Sigma |
| A | 15 | 249 | 1303164 | 3019.16 | 2141 | 2095 | 430.9 |
| A | 14 | 238 | 210704 | 484.08 | 2141 | 2095 | 430.9 |
| A | 14 | 237 | 80772 | 182.57 | 2141 | 2095 | 430.9 |
| B | 4 | 142 | 79782 | 188.92 | 2156 | 2100 | 411.2 |
| B | 0 | 197 | 70879 | 167.27 | 2156 | 2100 | 411.2 |
| B | 0 | 189 | 56117 | 131.37 | 2156 | 2100 | 411.2 |
| C | 3 | 233 | 1483775 | 3081.41 | 2086 | 2096 | 480.8 |
| C | 10 | 22 | 92568 | 188.15 | 2086 | 2096 | 480.8 |
| C | 7 | 247 | 18137 | 33.36 | 2086 | 2096 | 480.8 |
| D | 13 | 122 | 2321110 | 4677.75 | 2036 | 1976 | 495.8 |
| D | 5 | 222 | 1400907 | 2821.68 | 2036 | 1976 | 495.8 |
| D | 1 | 52 | 1281767 | 2581.37 | 2036 | 1976 | 495.8 |
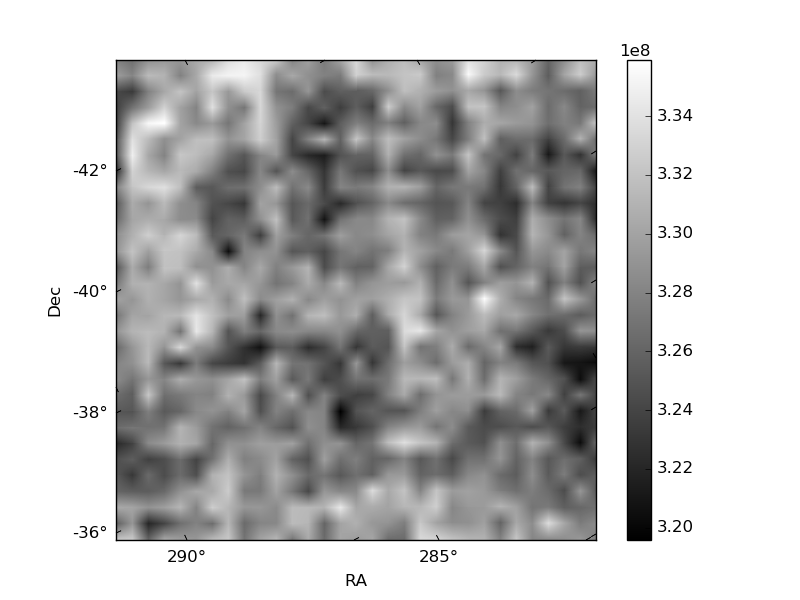
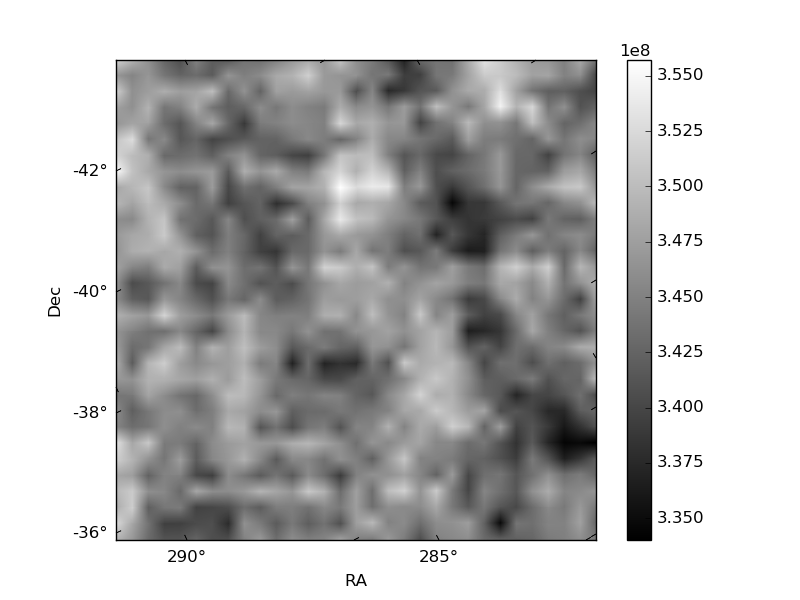
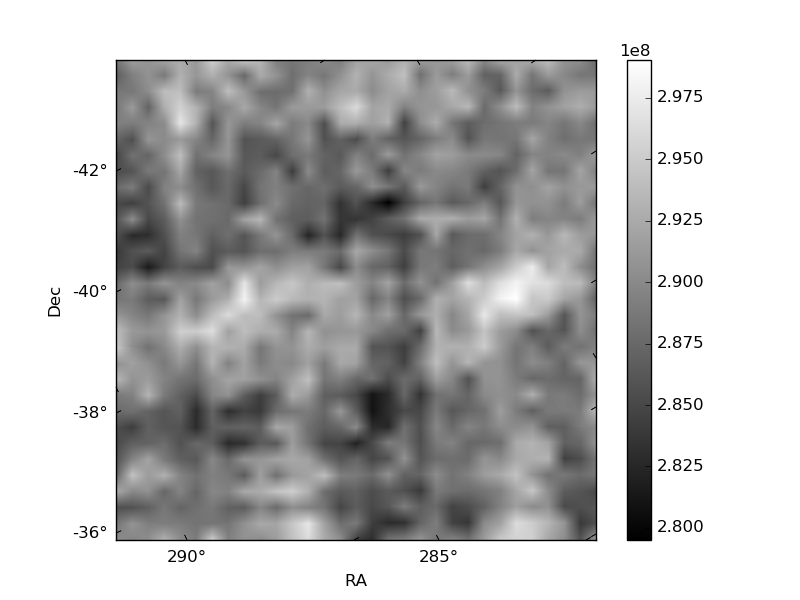
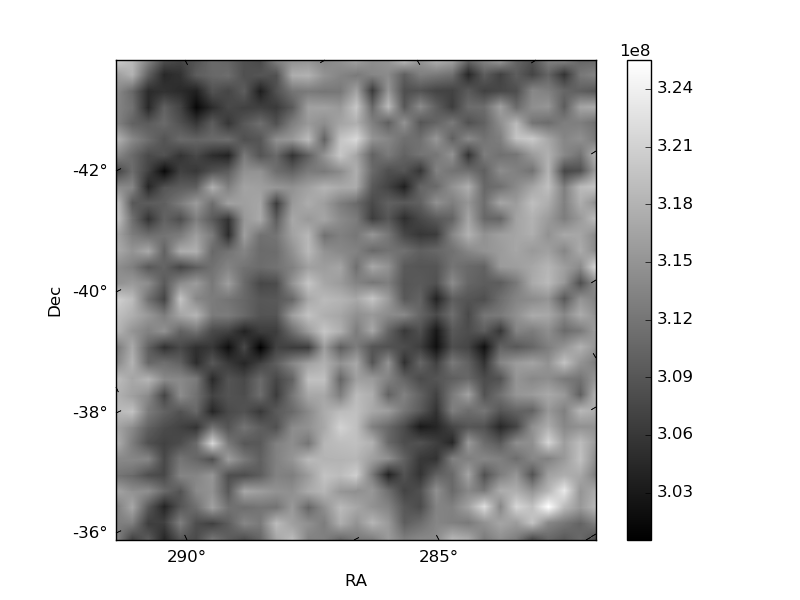
Histogram calculated using DETX and DETY for each event in the final _common_clean file
| Quadrant A | 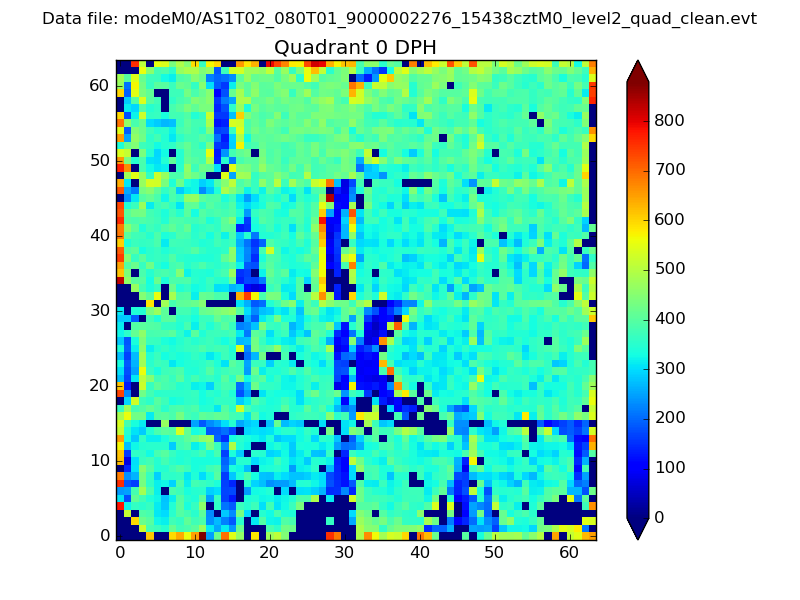 |
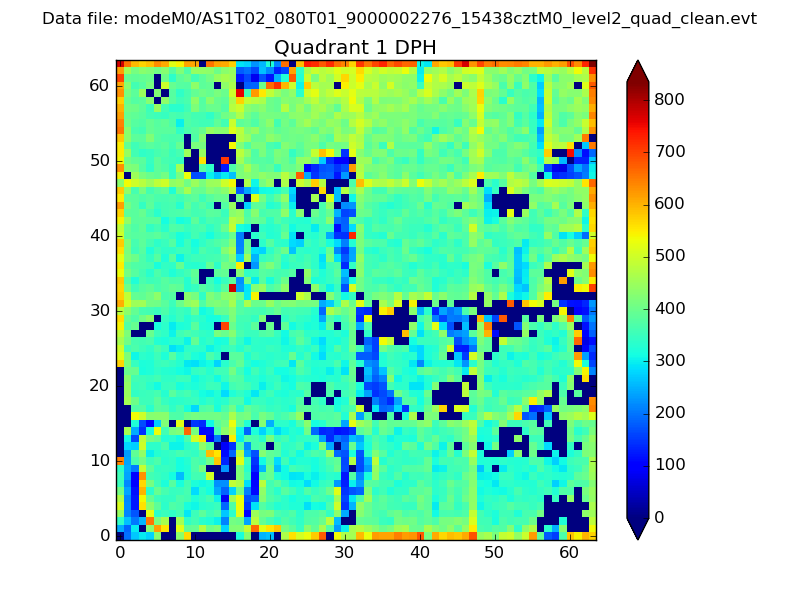 |
Quadrant B |
|---|---|---|---|
| Quadrant D | 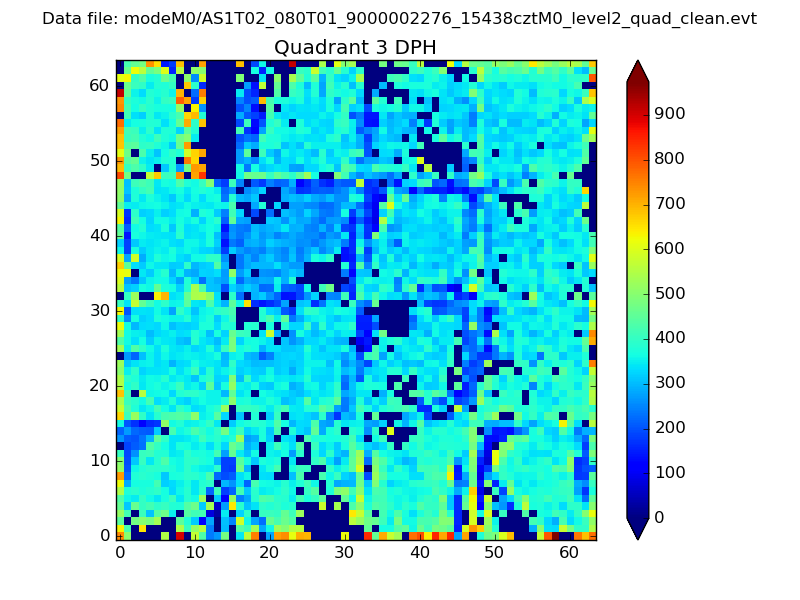 |
 |
Quadrant C |
| Plot type | Count rate plots | Images |
|---|---|---|
| Comparison with Poisson distribution Blue bars denote a histogram of data divided into 1 sec bins. Red curve is a Poisson curve with rate = median count rate of data. |
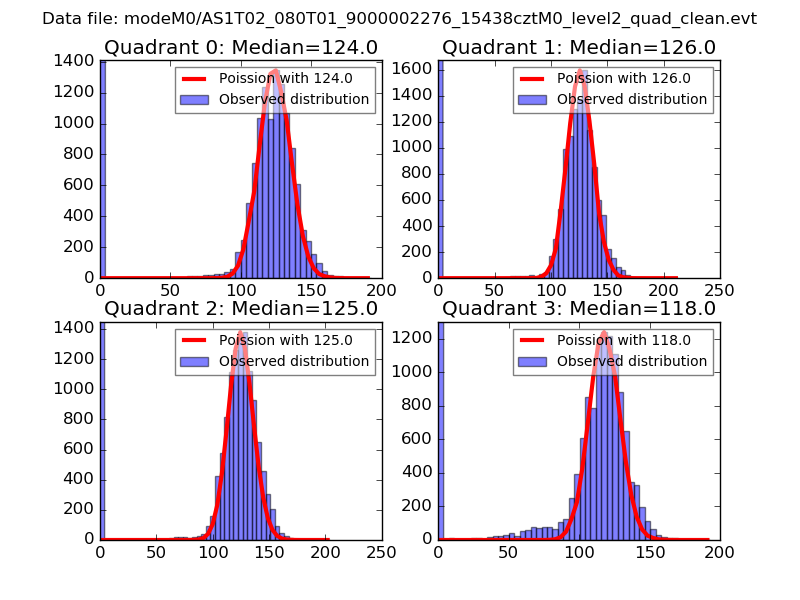 |
 |
| Quadrant-wise count rates Data is divided into 100 sec bins |
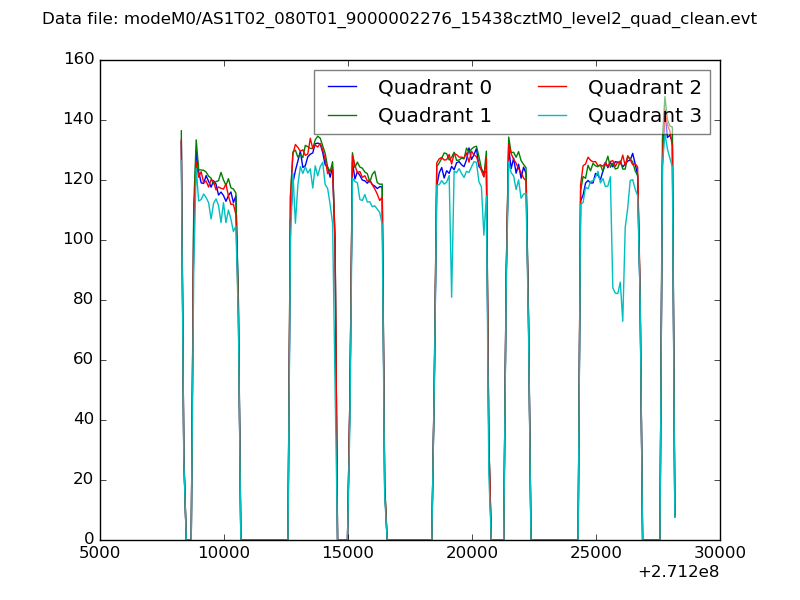 |
|
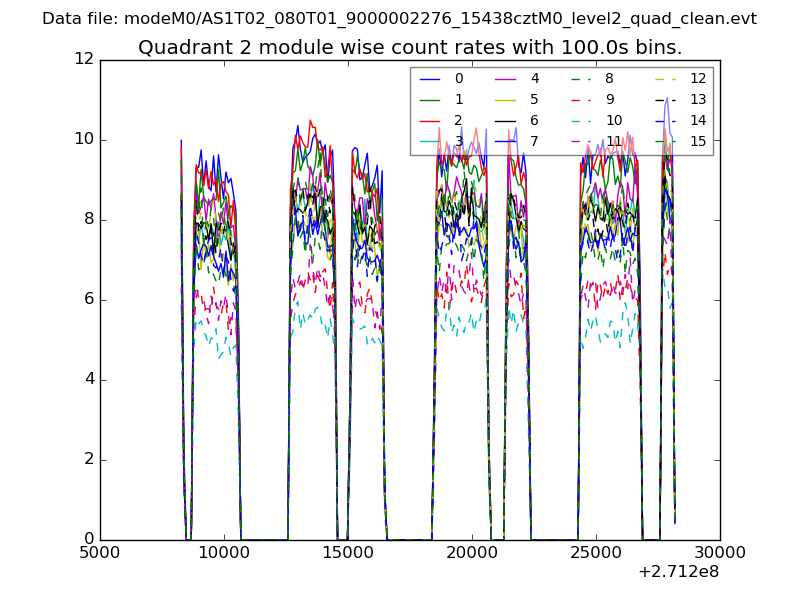
| Module-wise count rates for Quadrant A Data is divided into 100 sec bins |
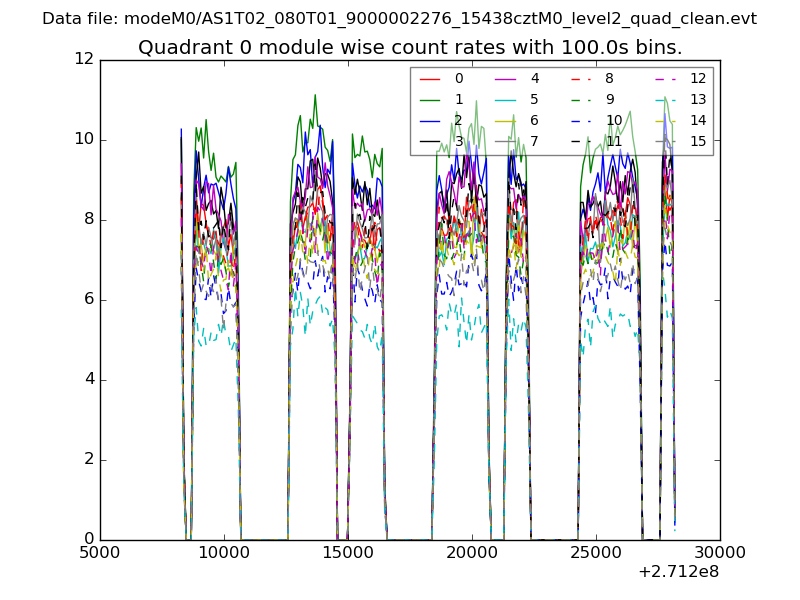 |
 |
| Module-wise count rates for Quadrant B Data is divided into 100 sec bins |
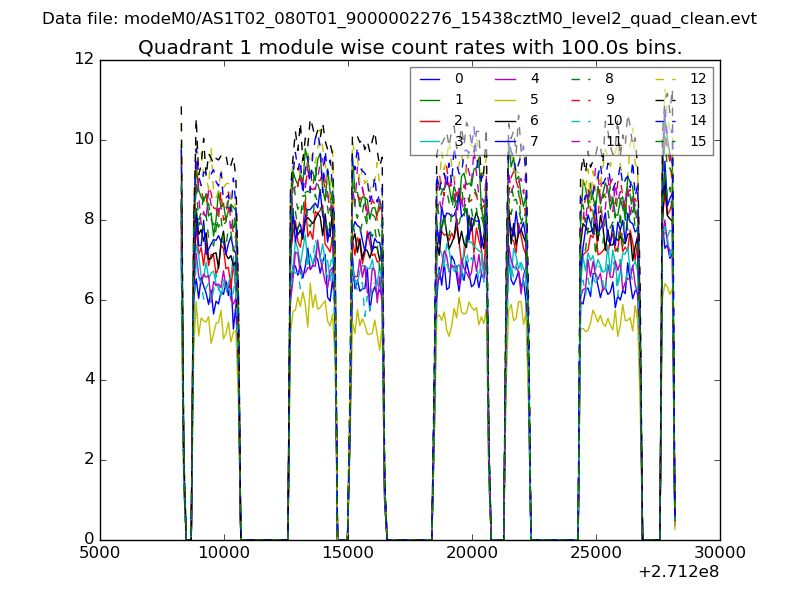 |
 |
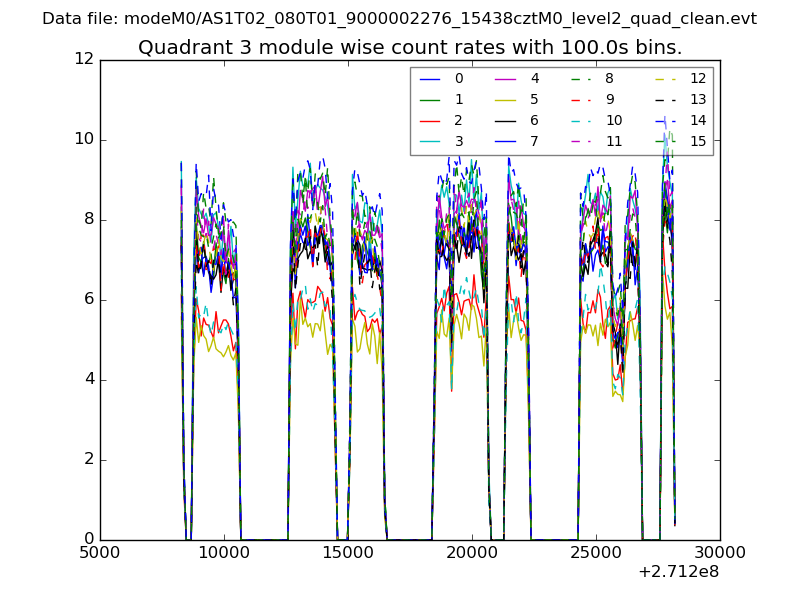
| Module-wise count rates for Quadrant C Data is divided into 100 sec bins |
 |
 |
| Module-wise count rates for Quadrant D Data is divided into 100 sec bins |
 |
 |
| Parameter | Plot |
|---|---|
| CZT HV Monitor | 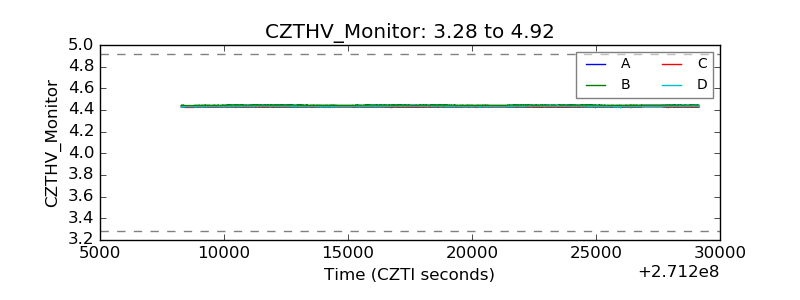 |
| D_VDD | 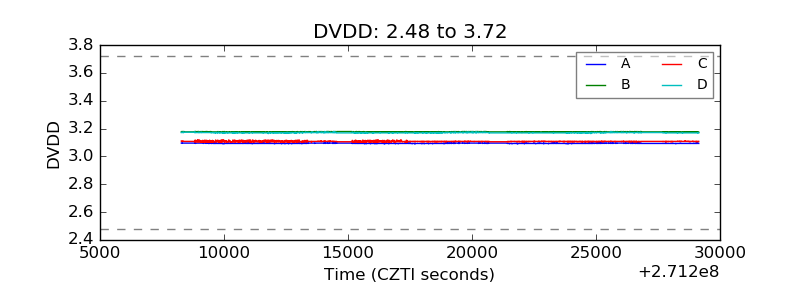 |
| Temperature 1 | 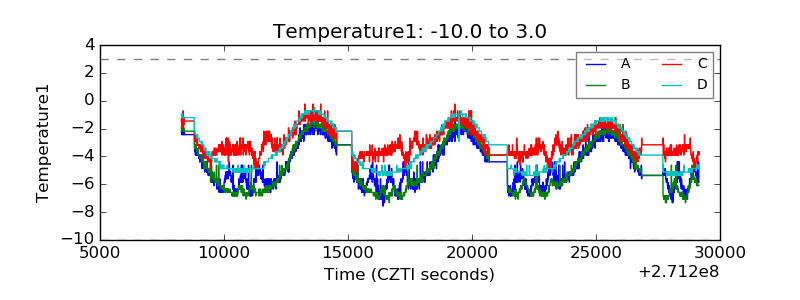 |
| Veto HV Monitor | 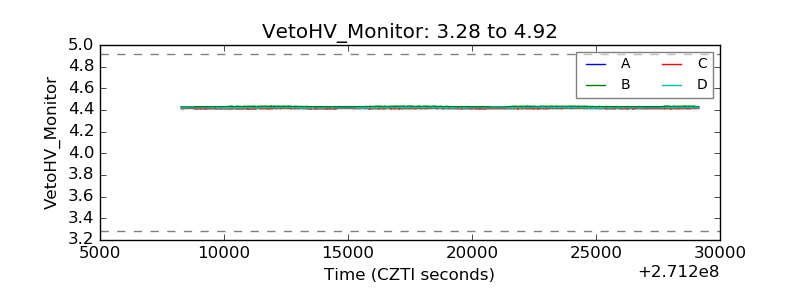 |
| Veto LLD | 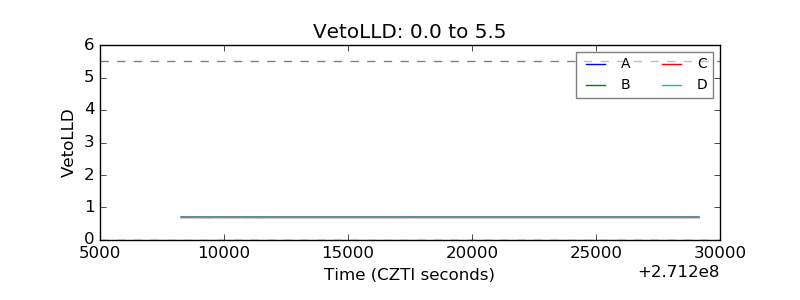 |
| Alpha Counter | 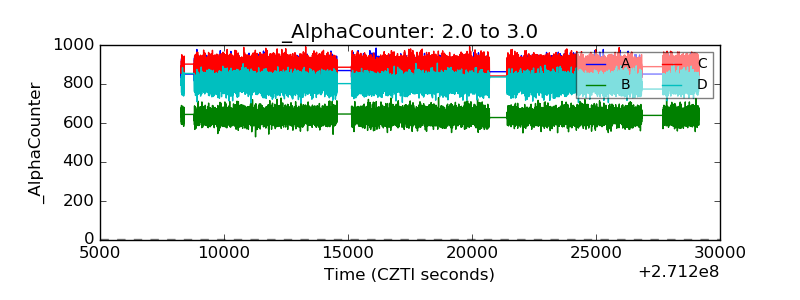 |
| _CPM_Rate | 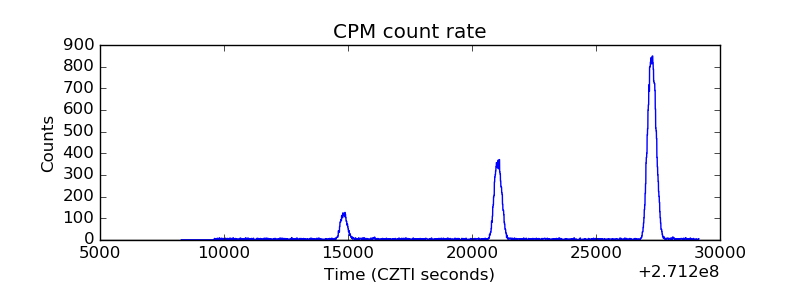 |
| CZT Counter |  |
| +2.5 Volts monitor | 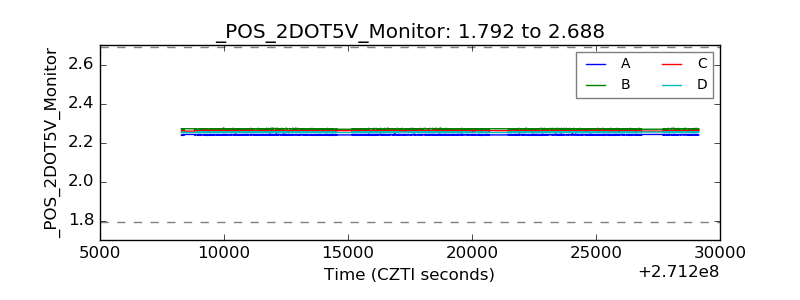 |
| +5 Volts monitor |  |
| _ROLL_ROT | 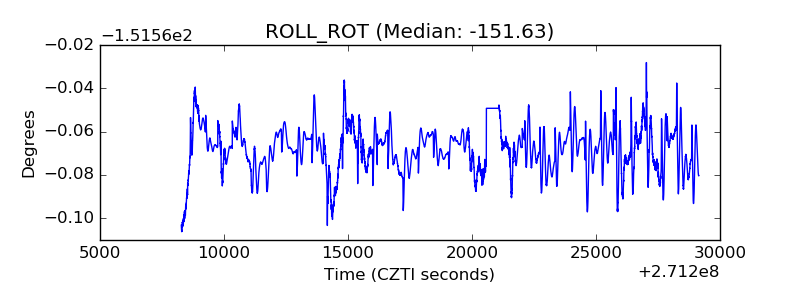 |
| _Roll_DEC | 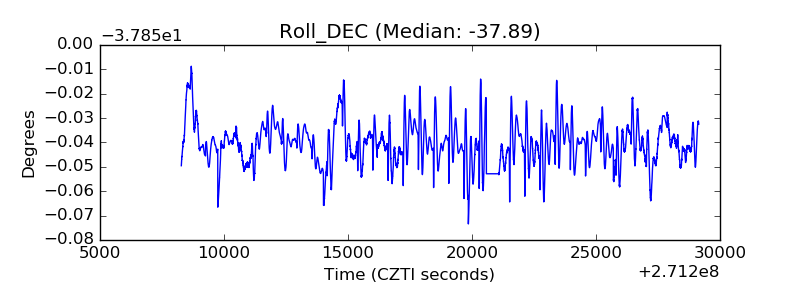 |
| _Roll_RA |  |
| Veto Counter | 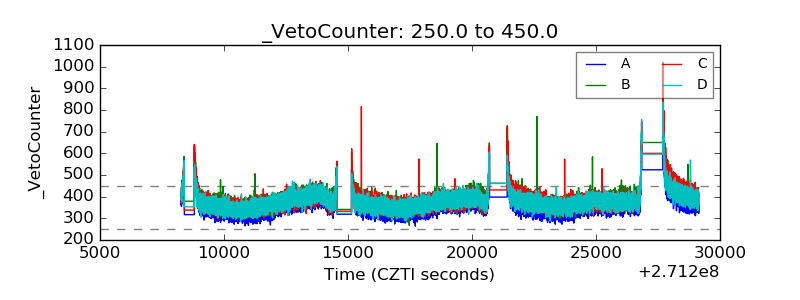 |