| Param | Original file | Final file |
|---|---|---|
| Filename | modeM0/AS1T02_080T01_9000002276_15439cztM0_level2.evt | modeM0/AS1T02_080T01_9000002276_15439cztM0_level2_quad_clean.evt |
| Size (bytes) | 483,183,360 | 69,485,760 |
| Size | 460.8 MB | 66.3 MB |
| Events in quadrant A | 3,598,634 | 406,564 |
| Events in quadrant B | 3,281,589 | 419,770 |
| Events in quadrant C | 3,545,352 | 420,945 |
| Events in quadrant D | 3,762,435 | 399,195 |
| Mode SS | |||
|---|---|---|---|
| Quadrant | BADHDUFLAG | Total packets | Discarded packets |
| A | 0 | 132 | 0 |
| B | 0 | 132 | 0 |
| C | 0 | 132 | 0 |
| D | 0 | 132 | 0 |
| Mode M0 | |||
|---|---|---|---|
| Quadrant | BADHDUFLAG | Total packets | Discarded packets |
| A | 0 | 15004 | 0 |
| B | 0 | 13864 | 0 |
| C | 0 | 14482 | 0 |
| D | 0 | 15644 | 0 |
| Mode M9 | |||
|---|---|---|---|
| Quadrant | BADHDUFLAG | Total packets | Discarded packets |
| A | 0 | 12 | 0 |
| B | 0 | 13 | 0 |
| C | 0 | 13 | 0 |
| D | 0 | 13 | 0 |
| Quadrant | Total seconds | Saturated seconds | Saturation percentage |
|---|---|---|---|
| A | 6591 | 116 | 1.759976% |
| B | 6591 | 65 | 0.986193% |
| C | 6590 | 59 | 0.895296% |
| D | 6487 | 91 | 1.402806% |
Noise dominated data is calculated using 1-second bins in cleaned event files. If a bin has >2000 counts, and if more than 50% of those come from <1% of pixels, then it is considered to be noise-dominated and hence unusable.
| Quadrant | # 1 sec bins | Bins with >0 counts | Bins with >2000 counts | High rate bins dominated by noise | Noise dominated (total time) | Noise dominated (detector-on time) | Marked lightcurve |
|---|---|---|---|---|---|---|---|
| A | 7626 | 6591 | 23 | 23 | 0.30% | 0.35% | 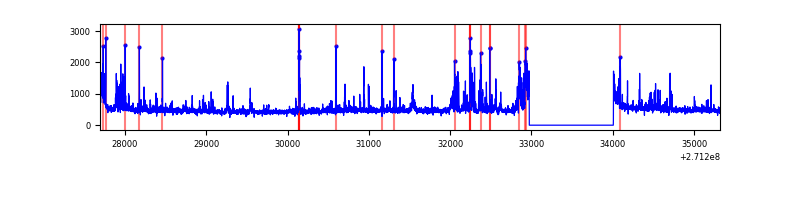 |
| B | 7626 | 6592 | 3 | 3 | 0.04% | 0.05% | 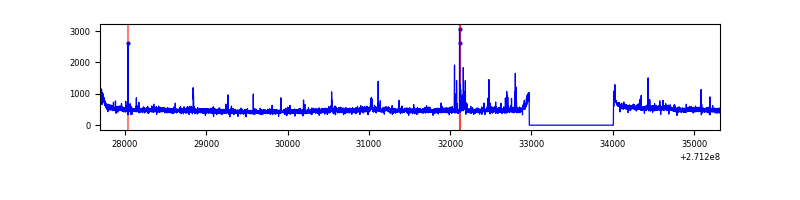 |
| C | 7625 | 6591 | 0 | 0 | 0.00% | 0.00% | 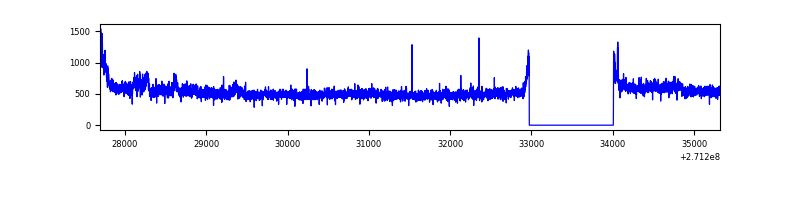 |
| D | 7625 | 6489 | 34 | 34 | 0.45% | 0.52% | 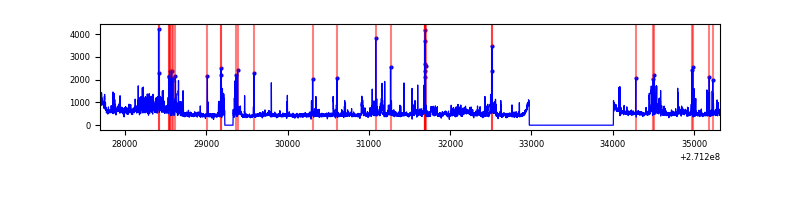 |
Top three noisy pixels from each quadrant. If the there are fewer than three noisy pixels in the level2.evt file, extra rows are filled as -1
| Pixel properties | Quadrant properties | ||||||
|---|---|---|---|---|---|---|---|
| Quadrant | DetID | PixID | Counts | Sigma | Mean | Median | Sigma |
| A | 14 | 238 | 229189 | 1426.99 | 797 | 781 | 160.1 |
| A | 15 | 249 | 198330 | 1234.2 | 797 | 781 | 160.1 |
| A | 14 | 237 | 87994 | 544.87 | 797 | 781 | 160.1 |
| B | 0 | 213 | 35828 | 227.48 | 806 | 785 | 154.0 |
| B | 0 | 189 | 33184 | 210.32 | 806 | 785 | 154.0 |
| B | 3 | 209 | 21350 | 133.5 | 806 | 785 | 154.0 |
| C | 3 | 233 | 455575 | 2491.34 | 789 | 793 | 182.5 |
| C | 13 | 61 | 5739 | 27.09 | 789 | 793 | 182.5 |
| C | 14 | 225 | 4552 | 20.59 | 789 | 793 | 182.5 |
| D | 5 | 222 | 390711 | 2086.85 | 771 | 749 | 186.9 |
| D | 13 | 122 | 139805 | 744.15 | 771 | 749 | 186.9 |
| D | 1 | 52 | 135785 | 722.63 | 771 | 749 | 186.9 |
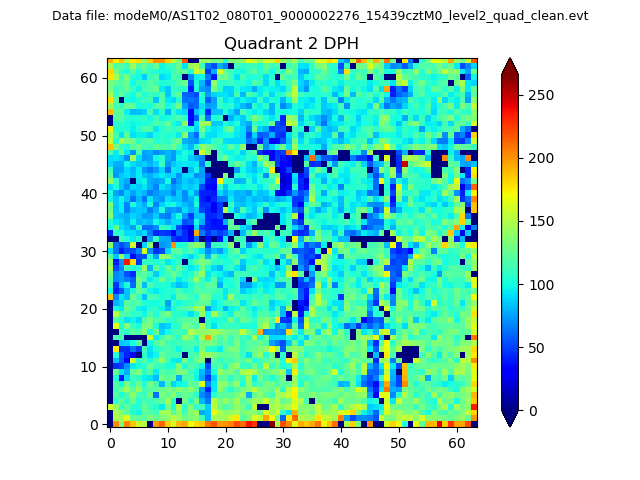
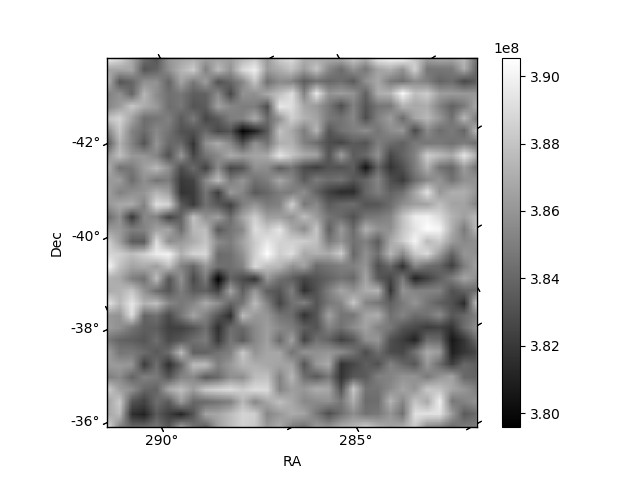
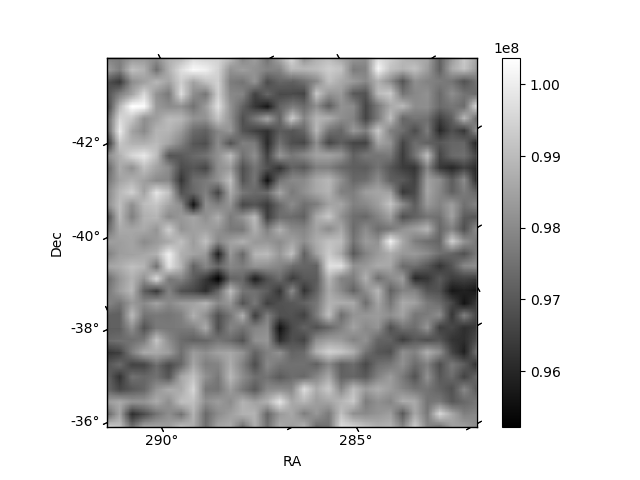
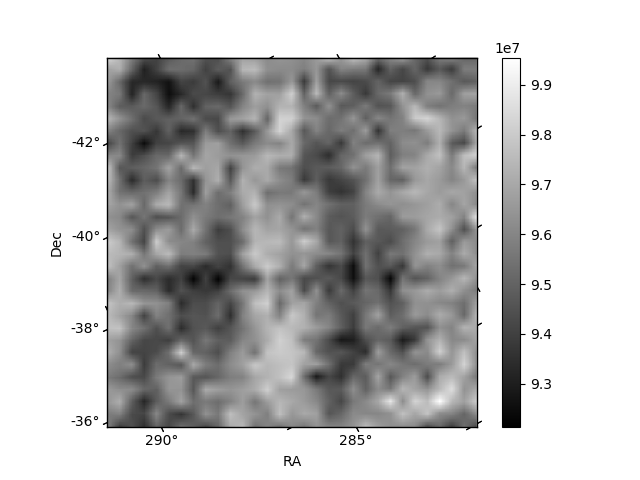
Histogram calculated using DETX and DETY for each event in the final _common_clean file
| Quadrant A | 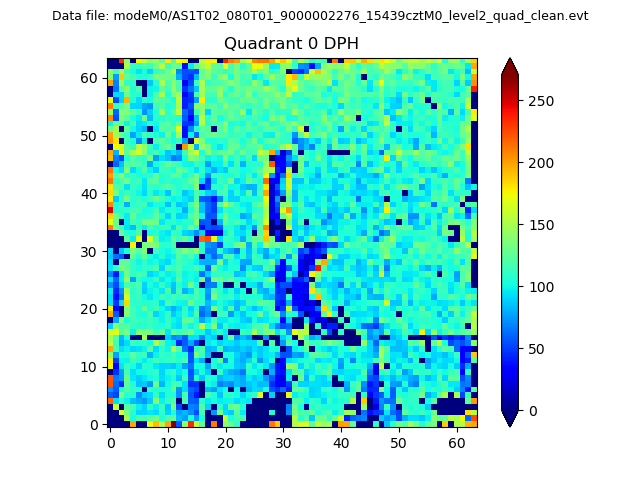 |
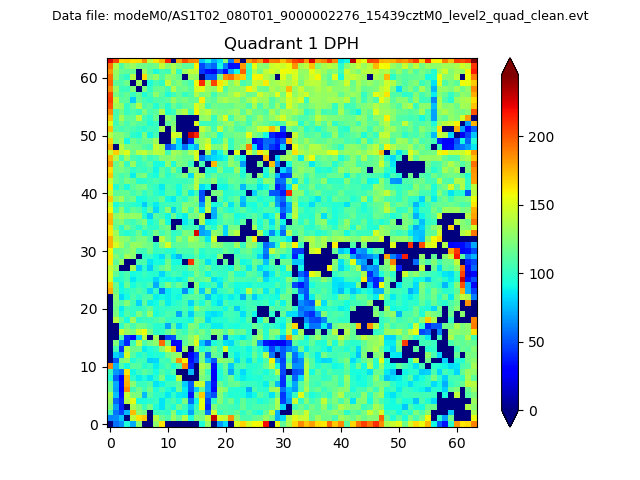 |
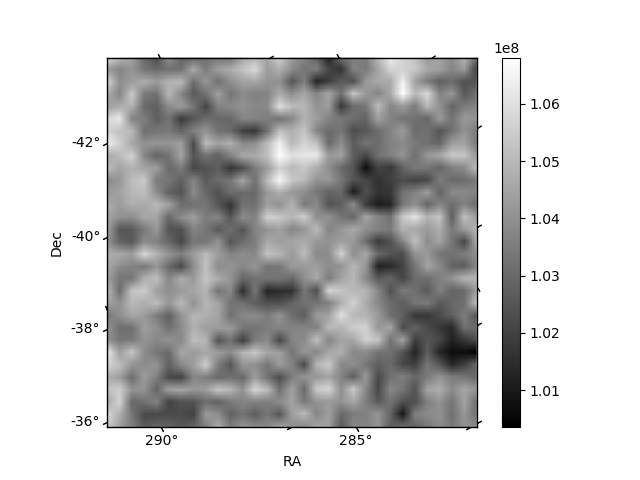
Quadrant B |
|---|---|---|---|
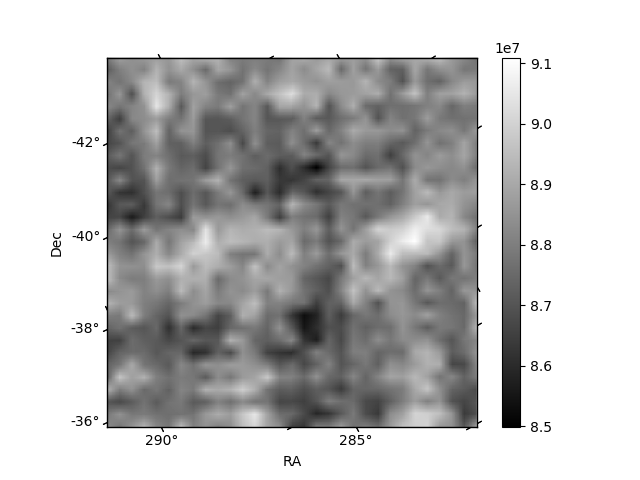
| Quadrant D | 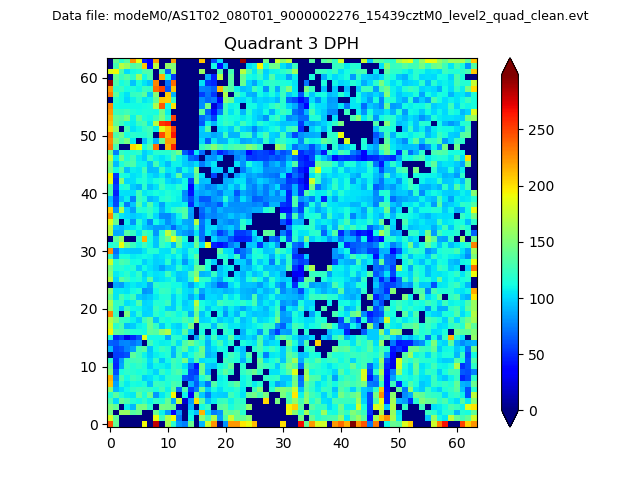 |
 |
Quadrant C |
| Plot type | Count rate plots | Images |
|---|---|---|
| Comparison with Poisson distribution Blue bars denote a histogram of data divided into 1 sec bins. Red curve is a Poisson curve with rate = median count rate of data. |
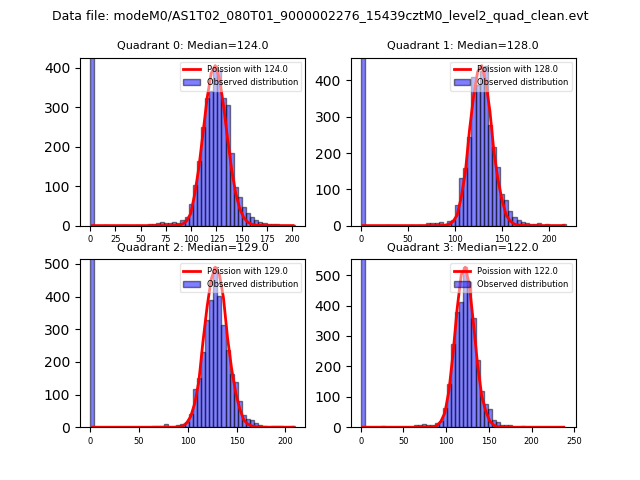 |
 |
| Quadrant-wise count rates Data is divided into 100 sec bins |
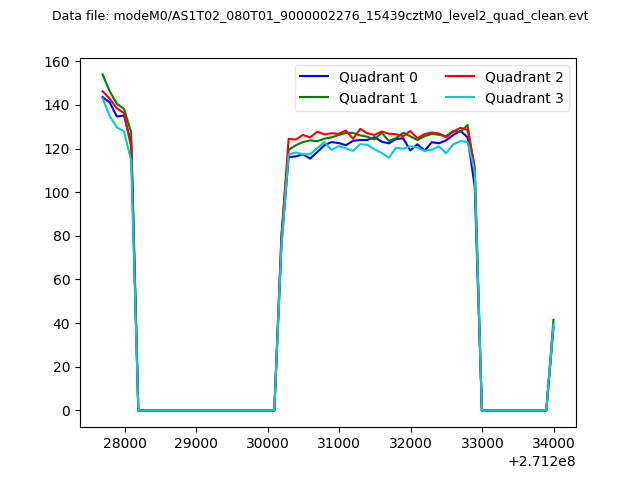 |
|
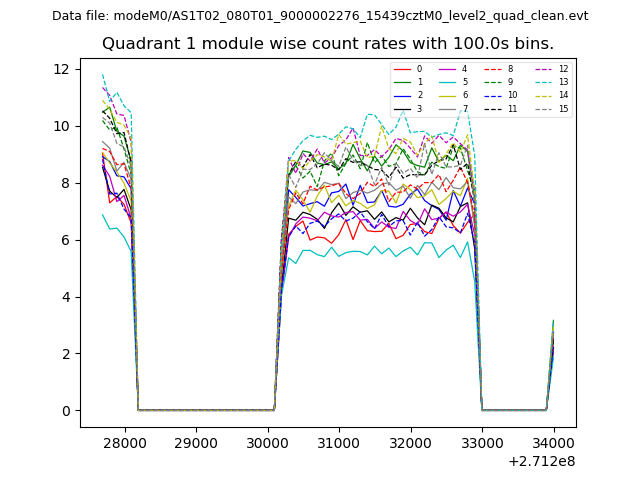
| Module-wise count rates for Quadrant A Data is divided into 100 sec bins |
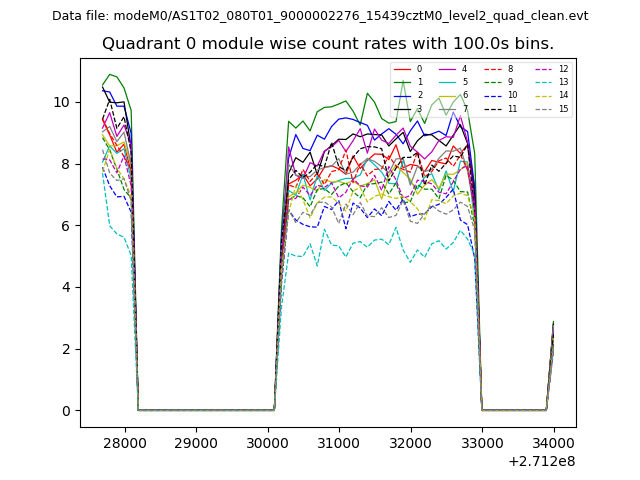 |
 |
| Module-wise count rates for Quadrant B Data is divided into 100 sec bins |
 |
 |
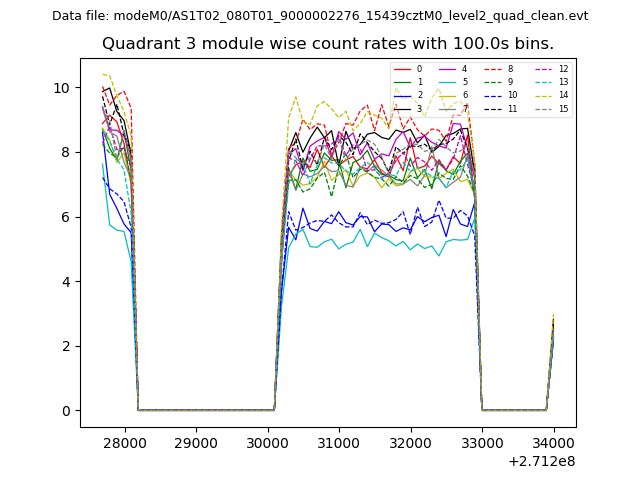
| Module-wise count rates for Quadrant C Data is divided into 100 sec bins |
 |
 |
| Module-wise count rates for Quadrant D Data is divided into 100 sec bins |
 |
 |
| Parameter | Plot |
|---|---|
| CZT HV Monitor |  |
| D_VDD | 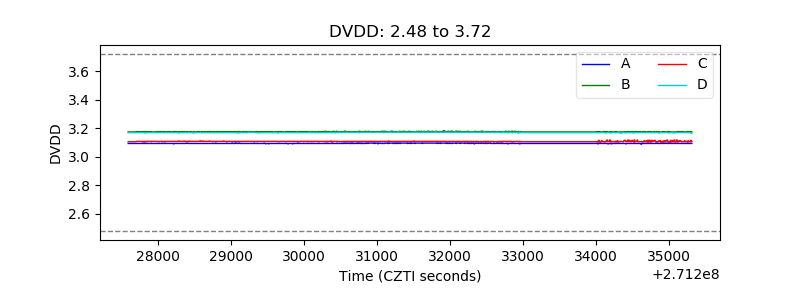 |
| Temperature 1 | 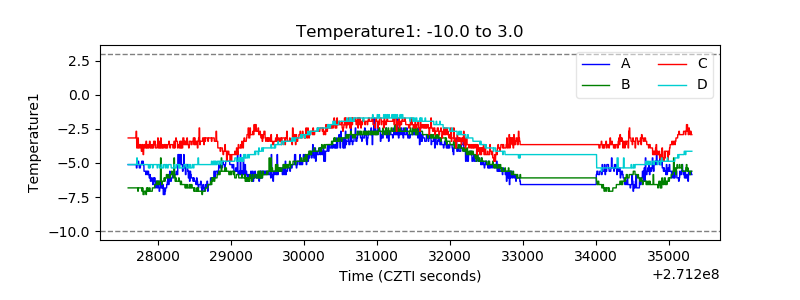 |
| Veto HV Monitor | 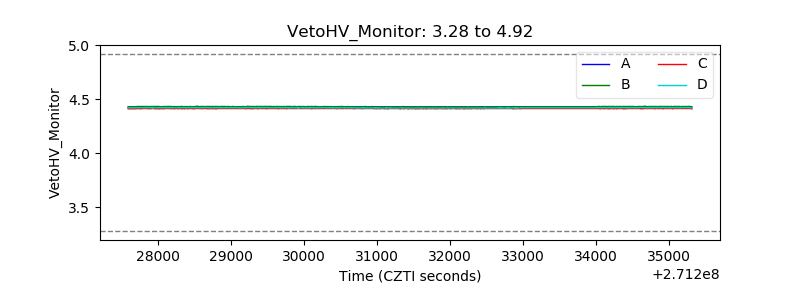 |
| Veto LLD | 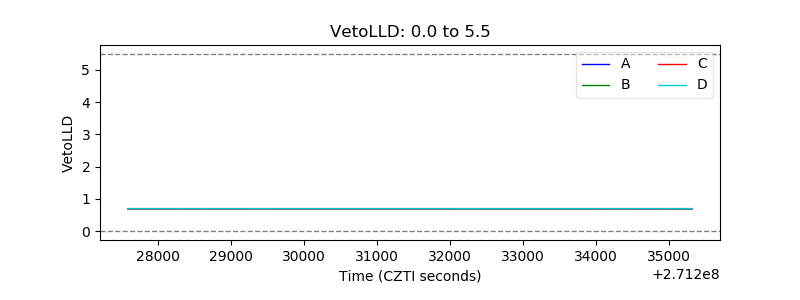 |
| Alpha Counter | 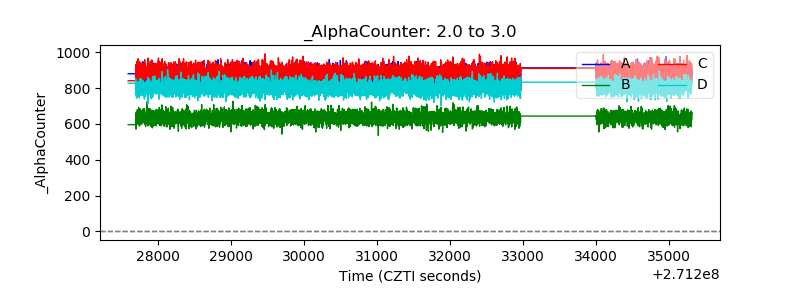 |
| _CPM_Rate | 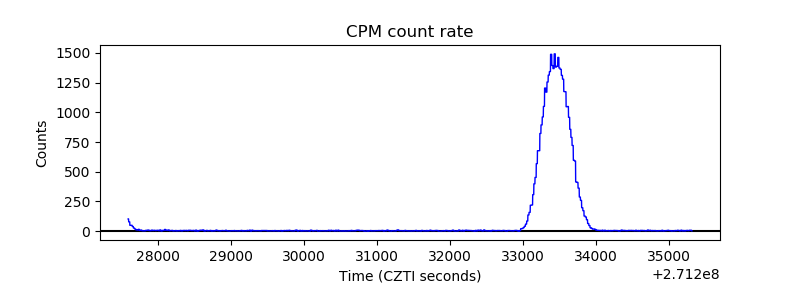 |
| CZT Counter | 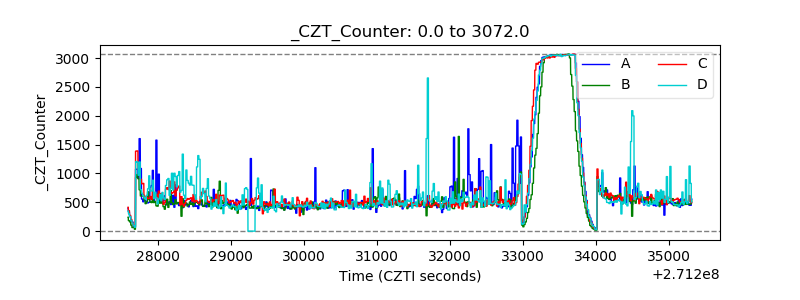 |
| +2.5 Volts monitor | 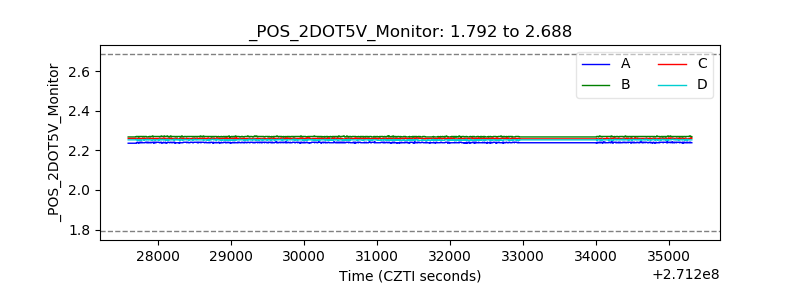 |
| +5 Volts monitor |  |
| _ROLL_ROT | 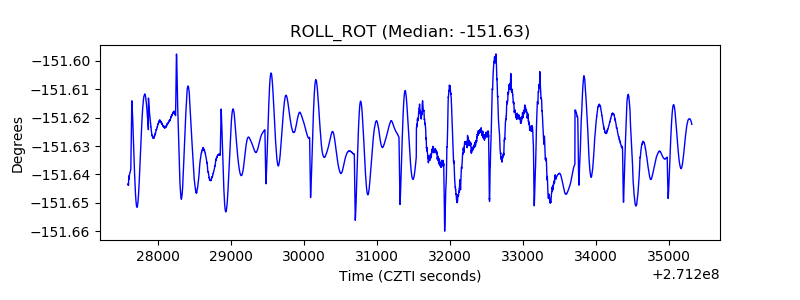 |
| _Roll_DEC | 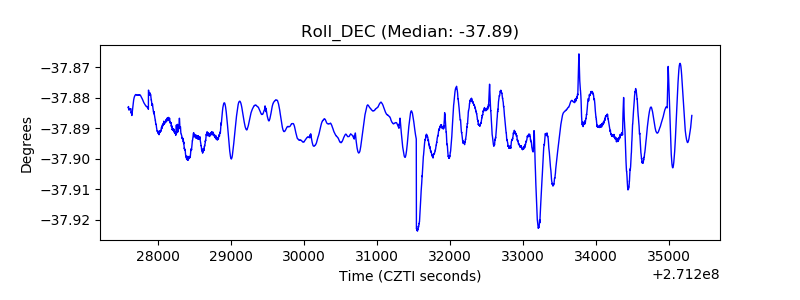 |
| _Roll_RA | 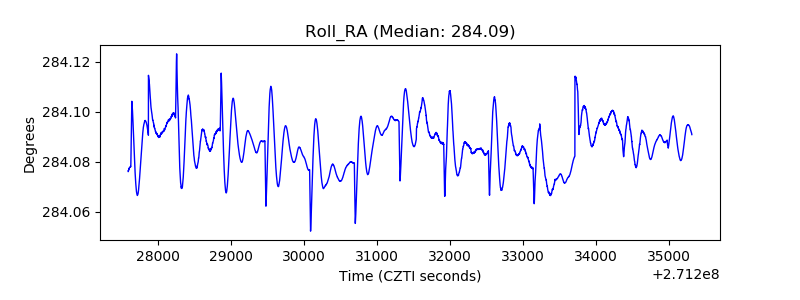 |
| Veto Counter |  |