| Param | Original file | Final file |
|---|---|---|
| Filename | modeM0/AS1T02_080T01_9000002276_15441cztM0_level2.evt | modeM0/AS1T02_080T01_9000002276_15441cztM0_level2_quad_clean.evt |
| Size (bytes) | 486,380,160 | 69,984,000 |
| Size | 463.8 MB | 66.7 MB |
| Events in quadrant A | 3,536,539 | 410,056 |
| Events in quadrant B | 3,445,647 | 420,502 |
| Events in quadrant C | 3,762,565 | 420,538 |
| Events in quadrant D | 3,535,135 | 405,350 |
| Mode SS | |||
|---|---|---|---|
| Quadrant | BADHDUFLAG | Total packets | Discarded packets |
| A | 0 | 136 | 0 |
| B | 0 | 136 | 0 |
| C | 0 | 136 | 0 |
| D | 0 | 136 | 0 |
| Mode M0 | |||
|---|---|---|---|
| Quadrant | BADHDUFLAG | Total packets | Discarded packets |
| A | 0 | 14754 | 0 |
| B | 0 | 14327 | 0 |
| C | 0 | 15284 | 0 |
| D | 0 | 14952 | 0 |
| Mode M9 | |||
|---|---|---|---|
| Quadrant | BADHDUFLAG | Total packets | Discarded packets |
| A | 0 | 22 | 0 |
| B | 0 | 22 | 0 |
| C | 0 | 22 | 0 |
| D | 0 | 22 | 0 |
| Quadrant | Total seconds | Saturated seconds | Saturation percentage |
|---|---|---|---|
| A | 6636 | 97 | 1.461724% |
| B | 6637 | 105 | 1.582040% |
| C | 6636 | 79 | 1.190476% |
| D | 6636 | 99 | 1.491863% |
Noise dominated data is calculated using 1-second bins in cleaned event files. If a bin has >2000 counts, and if more than 50% of those come from <1% of pixels, then it is considered to be noise-dominated and hence unusable.
| Quadrant | # 1 sec bins | Bins with >0 counts | Bins with >2000 counts | High rate bins dominated by noise | Noise dominated (total time) | Noise dominated (detector-on time) | Marked lightcurve |
|---|---|---|---|---|---|---|---|
| A | 8801 | 6636 | 6 | 6 | 0.07% | 0.09% | 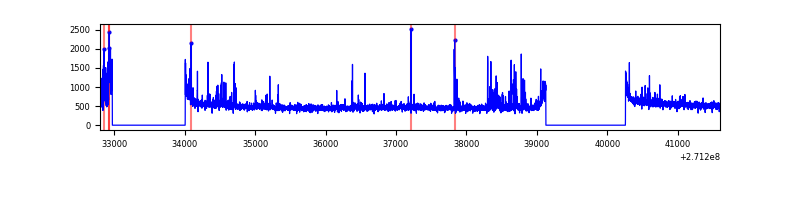 |
| B | 8802 | 6638 | 10 | 10 | 0.11% | 0.15% | 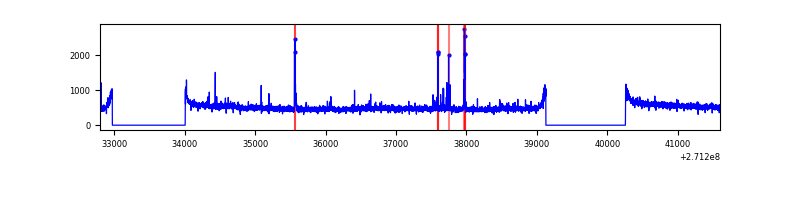 |
| C | 8801 | 6637 | 0 | 0 | 0.00% | 0.00% | 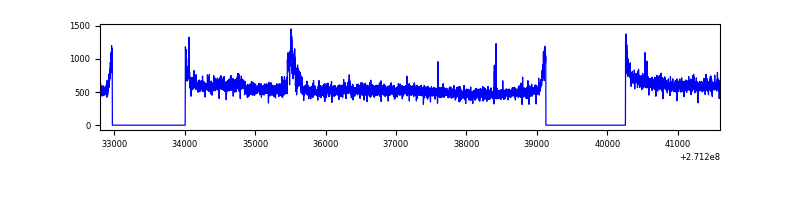 |
| D | 8801 | 6638 | 30 | 30 | 0.34% | 0.45% | 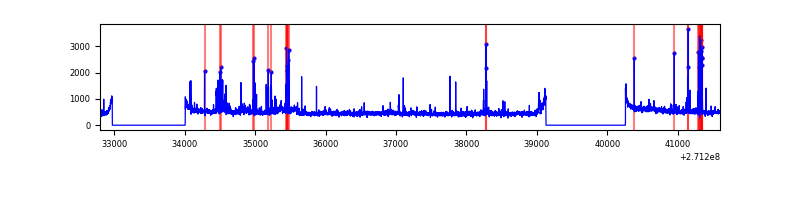 |
Top three noisy pixels from each quadrant. If the there are fewer than three noisy pixels in the level2.evt file, extra rows are filled as -1
| Pixel properties | Quadrant properties | ||||||
|---|---|---|---|---|---|---|---|
| Quadrant | DetID | PixID | Counts | Sigma | Mean | Median | Sigma |
| A | 14 | 238 | 125387 | 734.86 | 844 | 829 | 169.5 |
| A | 15 | 249 | 108468 | 635.04 | 844 | 829 | 169.5 |
| A | 14 | 237 | 39145 | 226.05 | 844 | 829 | 169.5 |
| B | 0 | 189 | 27622 | 167.56 | 851 | 830 | 159.9 |
| B | 0 | 213 | 23396 | 141.13 | 851 | 830 | 159.9 |
| B | 15 | 222 | 22732 | 136.98 | 851 | 830 | 159.9 |
| C | 3 | 233 | 495042 | 2609.19 | 831 | 836 | 189.4 |
| C | 8 | 128 | 11068 | 54.02 | 831 | 836 | 189.4 |
| C | 13 | 61 | 5801 | 26.21 | 831 | 836 | 189.4 |
| D | 5 | 222 | 180753 | 899.13 | 829 | 805 | 200.1 |
| D | 10 | 70 | 121089 | 601.01 | 829 | 805 | 200.1 |
| D | 1 | 52 | 48740 | 239.51 | 829 | 805 | 200.1 |
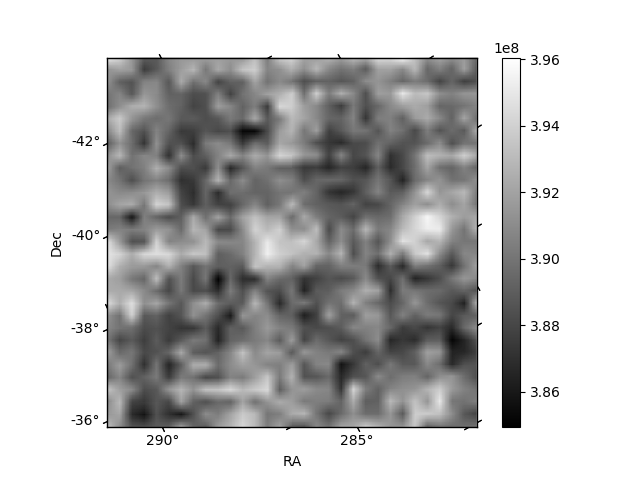
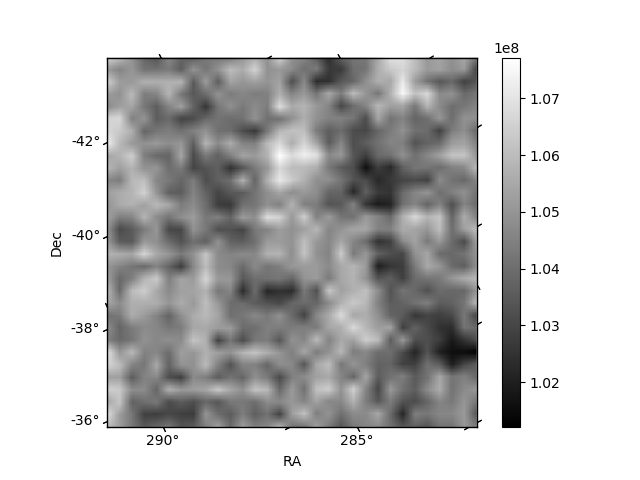
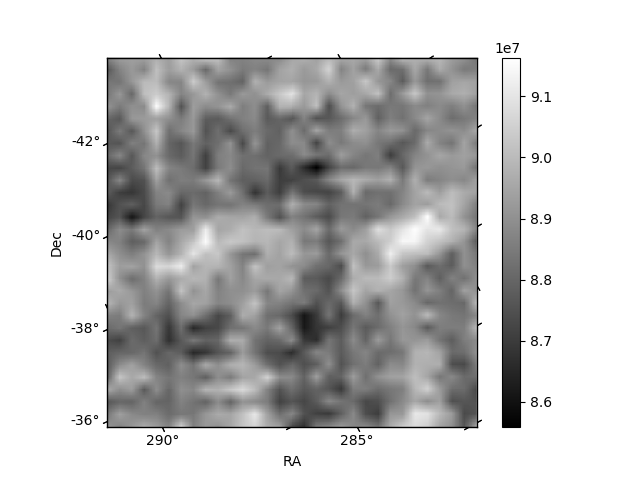
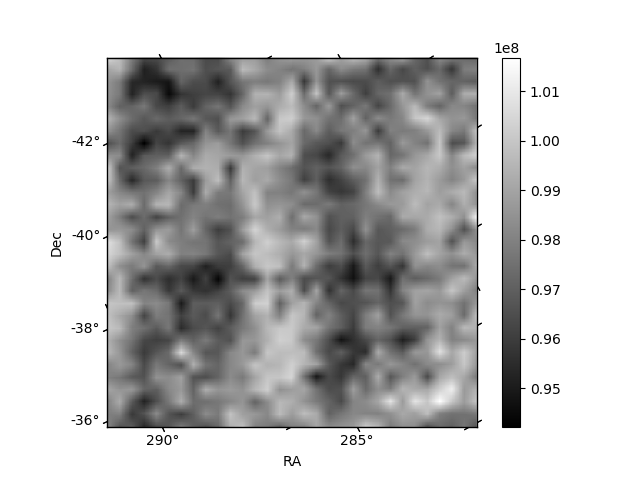
Histogram calculated using DETX and DETY for each event in the final _common_clean file
| Quadrant A | 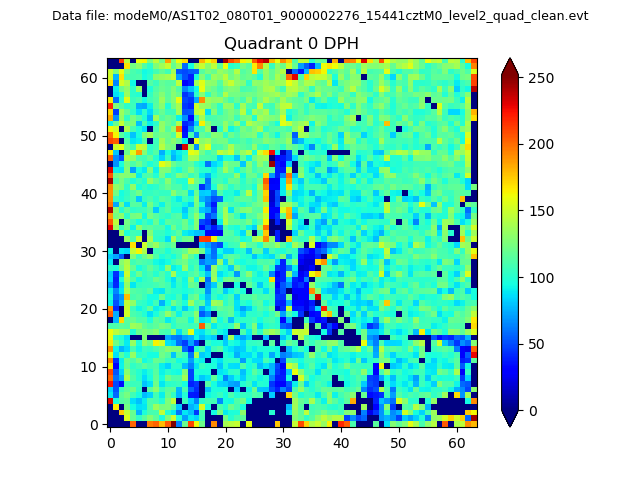 |
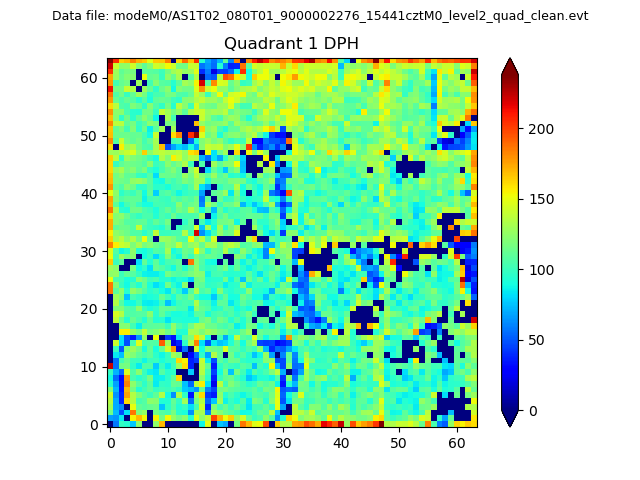 |
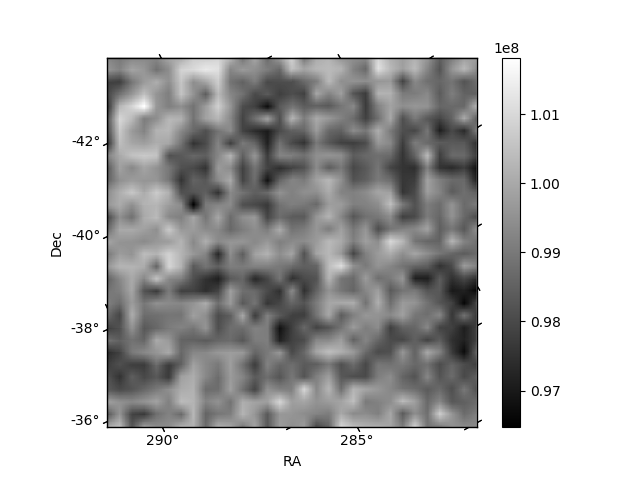
Quadrant B |
|---|---|---|---|
| Quadrant D |  |
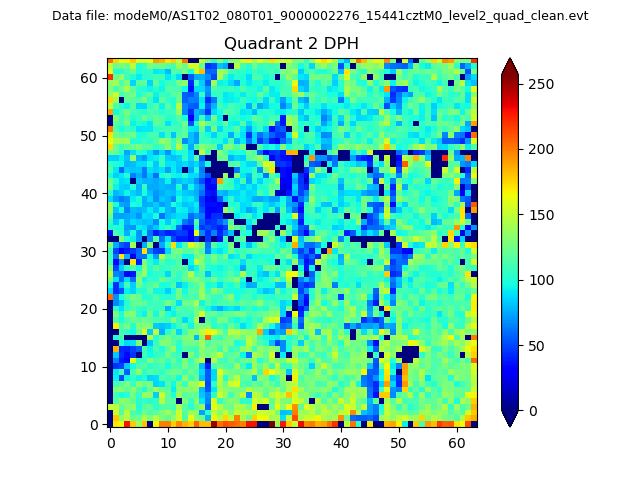 |
Quadrant C |
| Plot type | Count rate plots | Images |
|---|---|---|
| Comparison with Poisson distribution Blue bars denote a histogram of data divided into 1 sec bins. Red curve is a Poisson curve with rate = median count rate of data. |
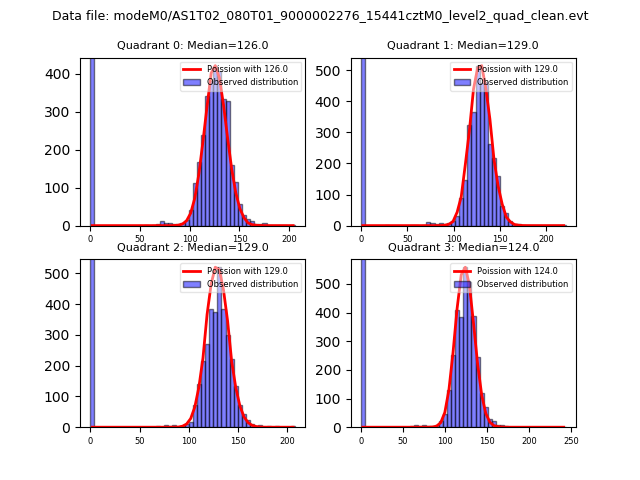 |
 |
| Quadrant-wise count rates Data is divided into 100 sec bins |
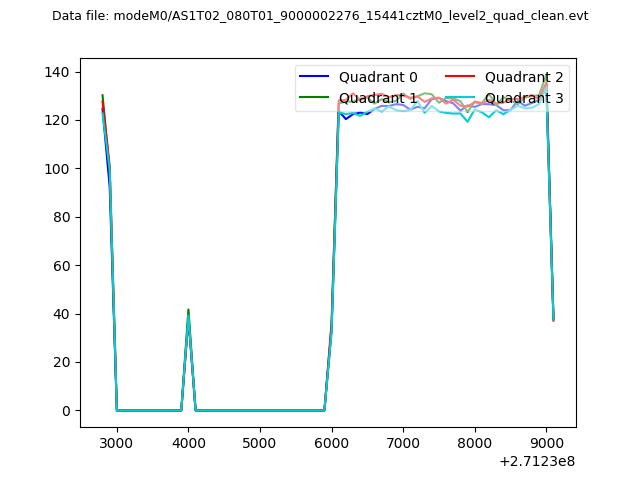 |
|
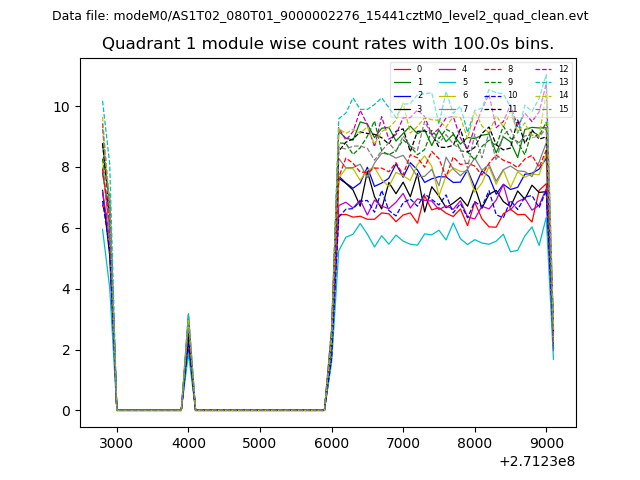
| Module-wise count rates for Quadrant A Data is divided into 100 sec bins |
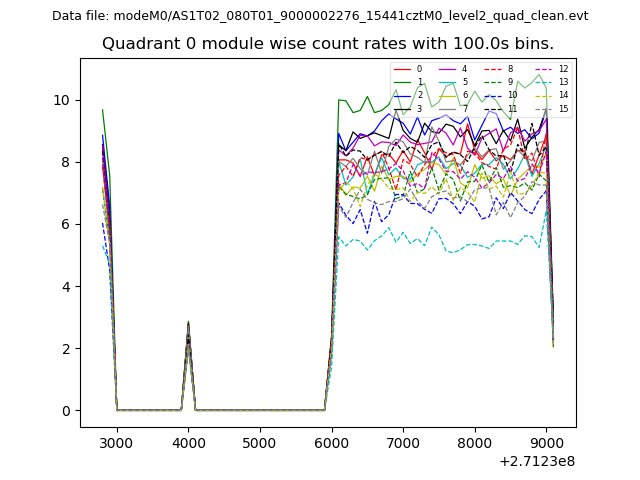 |
 |
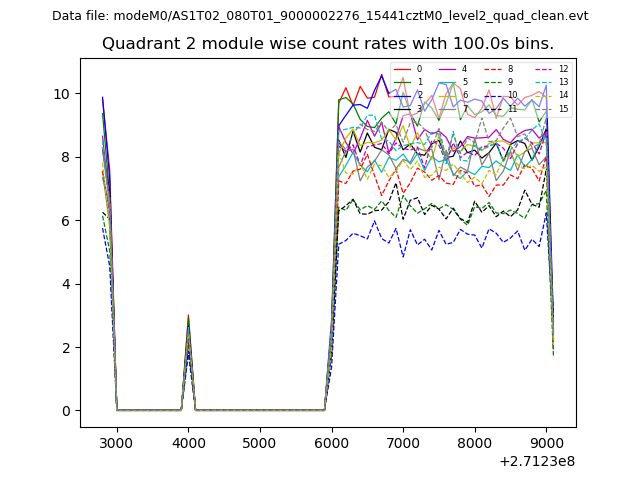
| Module-wise count rates for Quadrant B Data is divided into 100 sec bins |
 |
 |
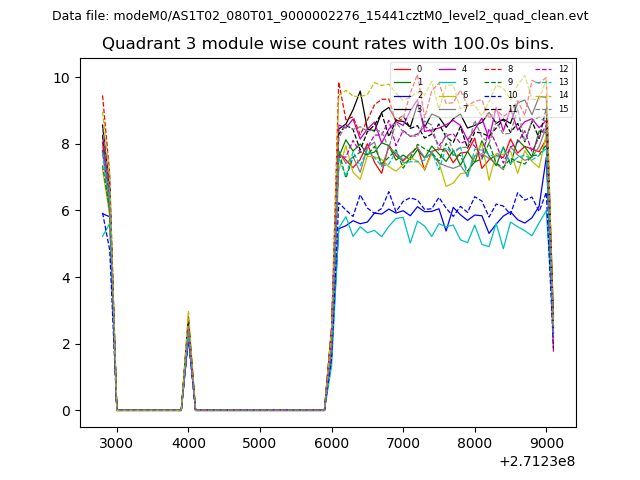
| Module-wise count rates for Quadrant C Data is divided into 100 sec bins |
 |
 |
| Module-wise count rates for Quadrant D Data is divided into 100 sec bins |
 |
 |
| Parameter | Plot |
|---|---|
| CZT HV Monitor | 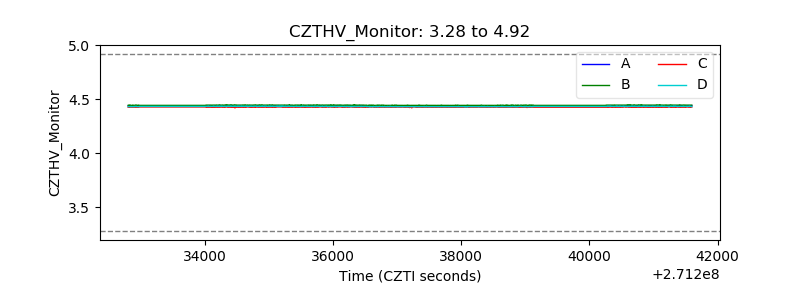 |
| D_VDD | 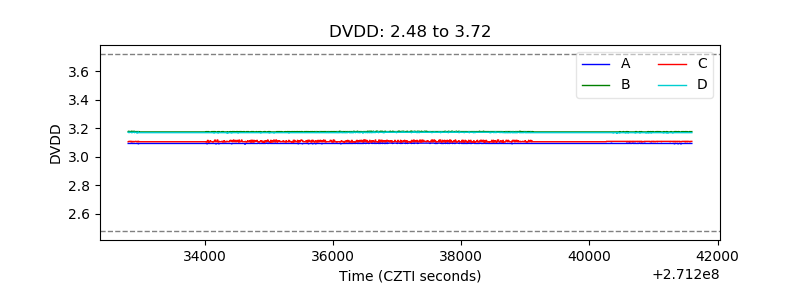 |
| Temperature 1 | 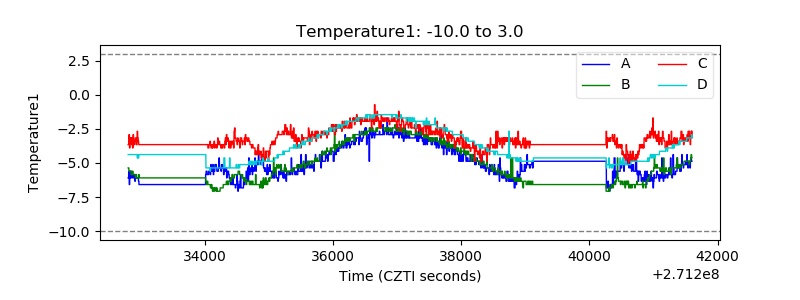 |
| Veto HV Monitor | 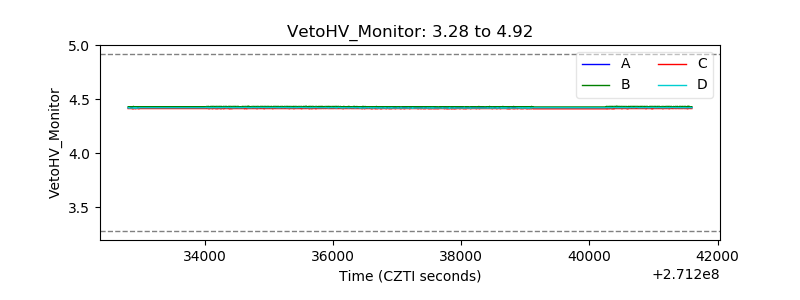 |
| Veto LLD | 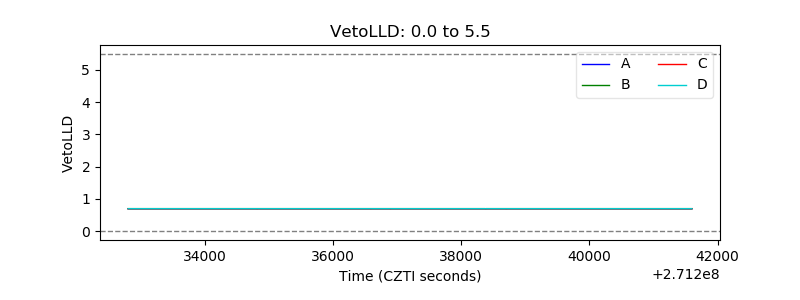 |
| Alpha Counter | 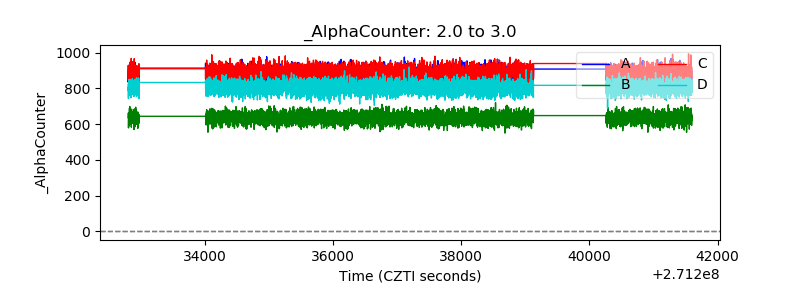 |
| _CPM_Rate |  |
| CZT Counter | 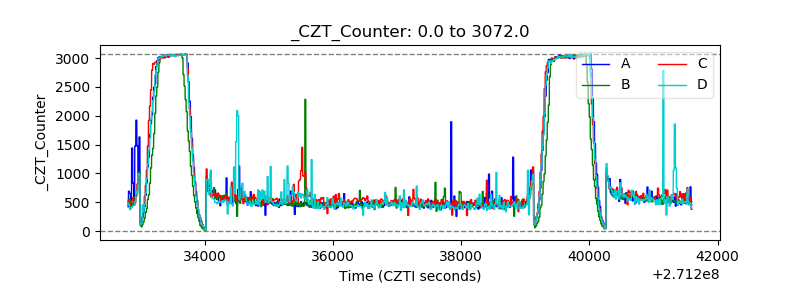 |
| +2.5 Volts monitor | 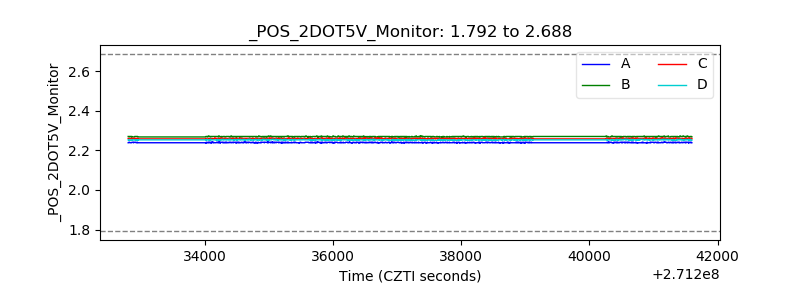 |
| +5 Volts monitor | 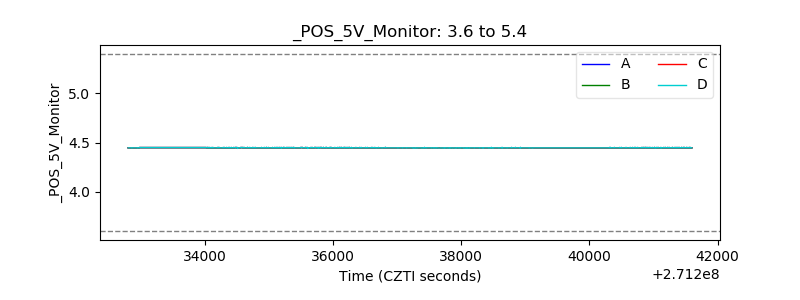 |
| _ROLL_ROT | 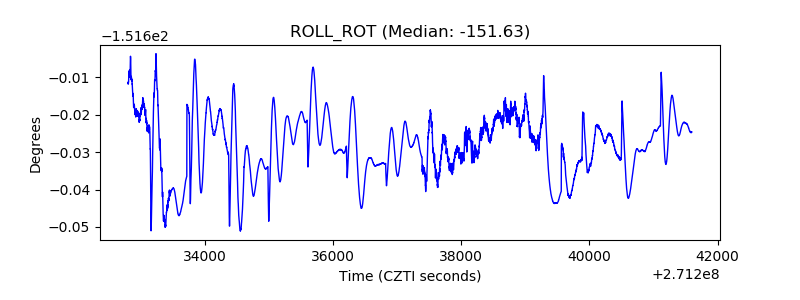 |
| _Roll_DEC | 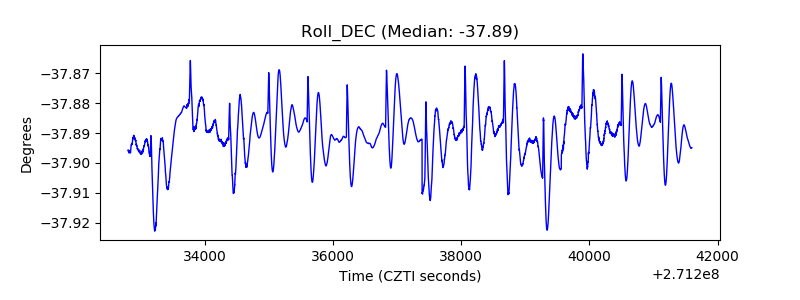 |
| _Roll_RA | 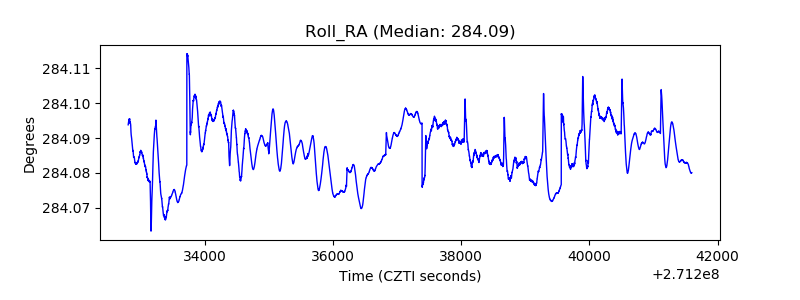 |
| Veto Counter | 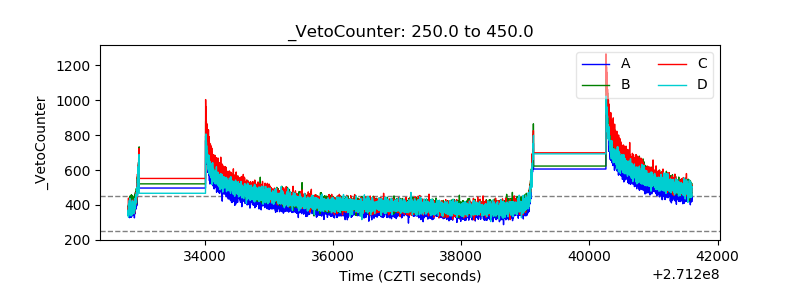 |