| Param | Original file | Final file |
|---|---|---|
| Filename | modeM0/AS1T02_080T01_9000002276_15444cztM0_level2.evt | modeM0/AS1T02_080T01_9000002276_15444cztM0_level2_quad_clean.evt |
| Size (bytes) | 378,838,080 | 67,420,800 |
| Size | 361.3 MB | 64.3 MB |
| Events in quadrant A | 1,907,607 | 466,661 |
| Events in quadrant B | 1,918,038 | 473,644 |
| Events in quadrant C | 1,959,986 | 468,223 |
| Events in quadrant D | 5,443,757 | 379,166 |
| Mode SS | |||
|---|---|---|---|
| Quadrant | BADHDUFLAG | Total packets | Discarded packets |
| A | 0 | 72 | 0 |
| B | 0 | 72 | 0 |
| C | 0 | 72 | 0 |
| D | 0 | 72 | 0 |
| Mode M0 | |||
|---|---|---|---|
| Quadrant | BADHDUFLAG | Total packets | Discarded packets |
| A | 0 | 7884 | 0 |
| B | 0 | 7874 | 0 |
| C | 0 | 8032 | 0 |
| D | 0 | 18609 | 0 |
| Quadrant | Total seconds | Saturated seconds | Saturation percentage |
|---|---|---|---|
| A | 3578 | 28 | 0.782560% |
| B | 3578 | 10 | 0.279486% |
| C | 3578 | 2 | 0.055897% |
| D | 3578 | 1229 | 34.348798% |
Noise dominated data is calculated using 1-second bins in cleaned event files. If a bin has >2000 counts, and if more than 50% of those come from <1% of pixels, then it is considered to be noise-dominated and hence unusable.
| Quadrant | # 1 sec bins | Bins with >0 counts | Bins with >2000 counts | High rate bins dominated by noise | Noise dominated (total time) | Noise dominated (detector-on time) | Marked lightcurve |
|---|---|---|---|---|---|---|---|
| A | 3578 | 3578 | 15 | 15 | 0.42% | 0.42% |  |
| B | 3578 | 3578 | 2 | 2 | 0.06% | 0.06% |  |
| C | 3578 | 3578 | 0 | 0 | 0.00% | 0.00% |  |
| D | 3578 | 3578 | 1167 | 1167 | 32.62% | 32.62% | 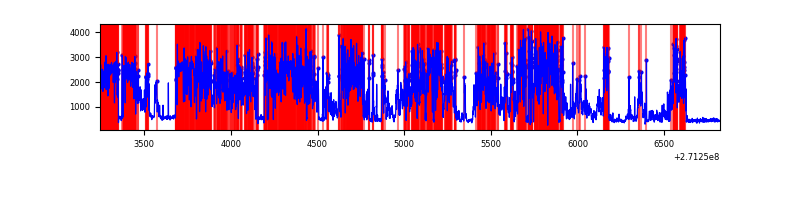 |
Top three noisy pixels from each quadrant. If the there are fewer than three noisy pixels in the level2.evt file, extra rows are filled as -1
| Pixel properties | Quadrant properties | ||||||
|---|---|---|---|---|---|---|---|
| Quadrant | DetID | PixID | Counts | Sigma | Mean | Median | Sigma |
| A | 14 | 238 | 96321 | 1030.27 | 458 | 450 | 93.1 |
| A | 14 | 237 | 38189 | 405.56 | 458 | 450 | 93.1 |
| A | 9 | 143 | 7555 | 76.35 | 458 | 450 | 93.1 |
| B | 4 | 142 | 73781 | 859.1 | 454 | 445 | 85.4 |
| B | 3 | 209 | 14930 | 169.69 | 454 | 445 | 85.4 |
| B | 0 | 189 | 10372 | 116.29 | 454 | 445 | 85.4 |
| C | 3 | 233 | 259803 | 2596.02 | 435 | 439 | 99.9 |
| C | 13 | 61 | 3199 | 27.63 | 435 | 439 | 99.9 |
| C | 10 | 22 | 1618 | 11.8 | 435 | 439 | 99.9 |
| D | 1 | 52 | 3910236 | 41418.33 | 386 | 375 | 94.4 |
| D | 7 | 38 | 26397 | 275.66 | 386 | 375 | 94.4 |
| D | 5 | 222 | 18364 | 190.56 | 386 | 375 | 94.4 |
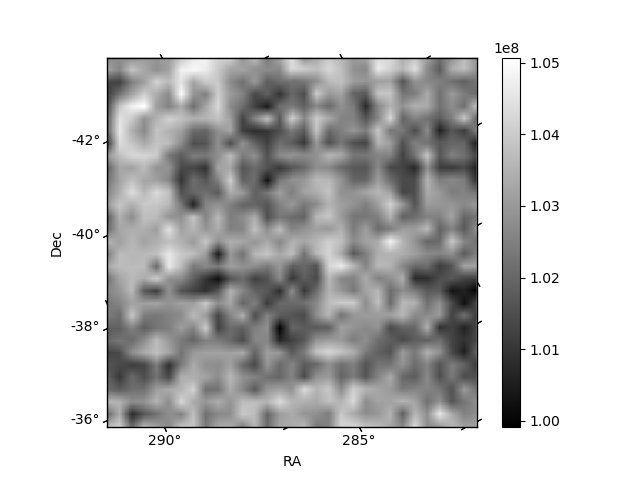
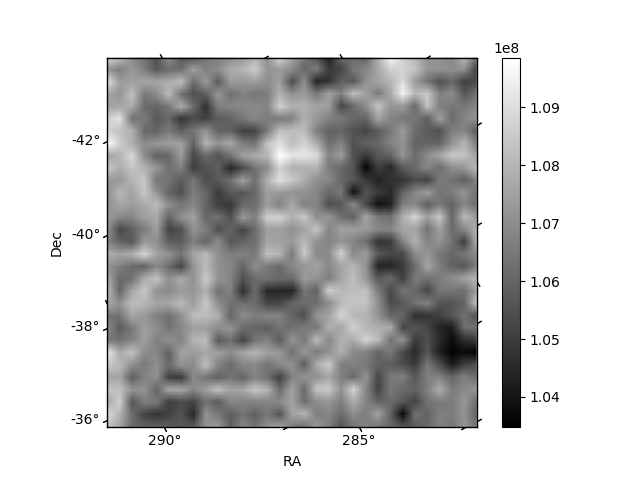
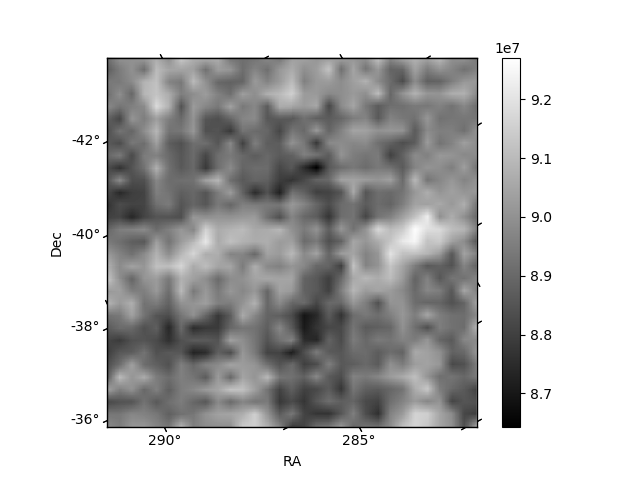
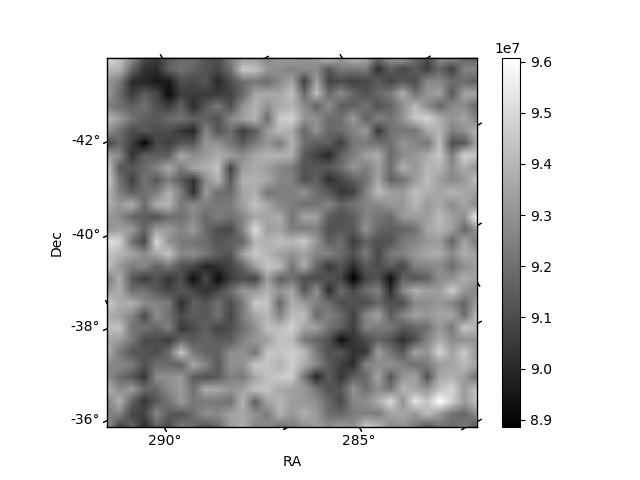
Histogram calculated using DETX and DETY for each event in the final _common_clean file
| Quadrant A |  |
 |
Quadrant B |
|---|---|---|---|
| Quadrant D |  |
 |
Quadrant C |
| Plot type | Count rate plots | Images |
|---|---|---|
| Comparison with Poisson distribution Blue bars denote a histogram of data divided into 1 sec bins. Red curve is a Poisson curve with rate = median count rate of data. |
 |
 |
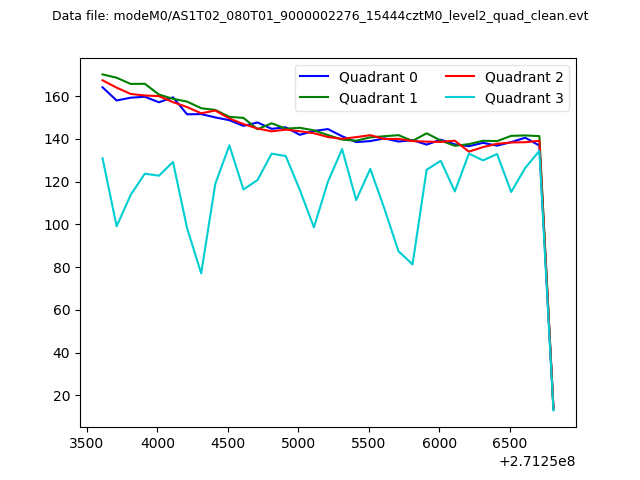
| Quadrant-wise count rates Data is divided into 100 sec bins |
 |
|
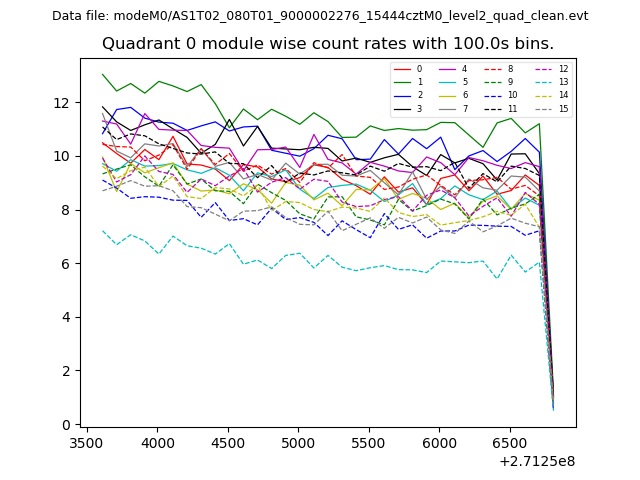
| Module-wise count rates for Quadrant A Data is divided into 100 sec bins |
 |
 |
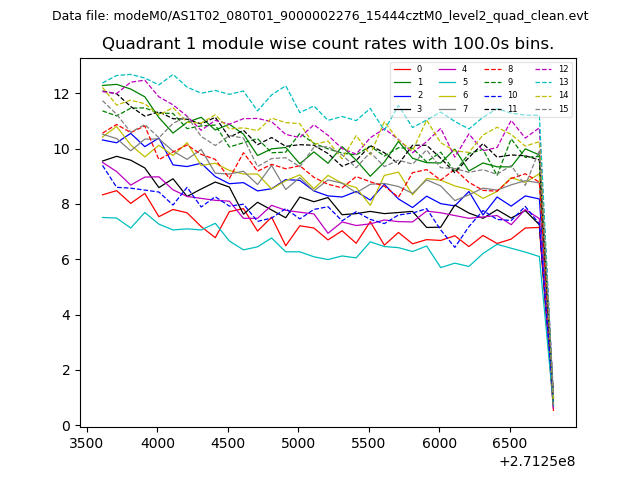
| Module-wise count rates for Quadrant B Data is divided into 100 sec bins |
 |
 |
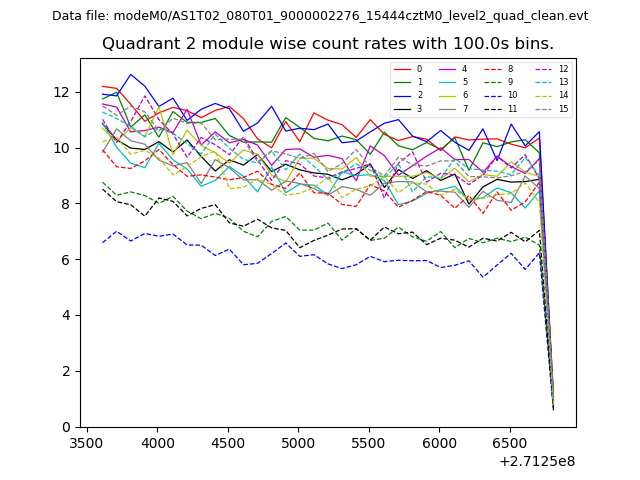
| Module-wise count rates for Quadrant C Data is divided into 100 sec bins |
 |
 |
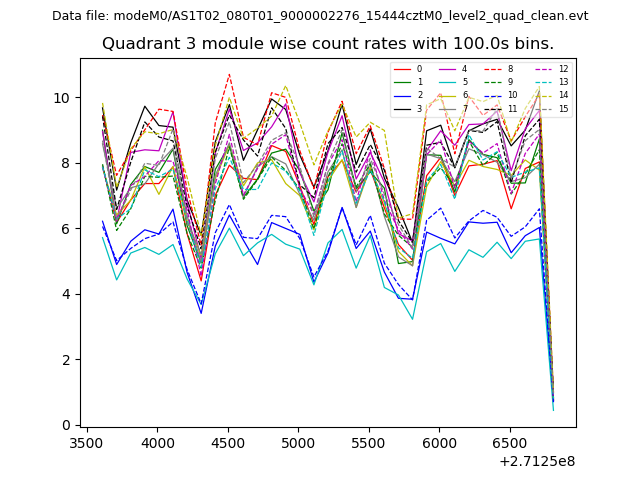
| Module-wise count rates for Quadrant D Data is divided into 100 sec bins |
 |
 |
| Parameter | Plot |
|---|---|
| CZT HV Monitor | 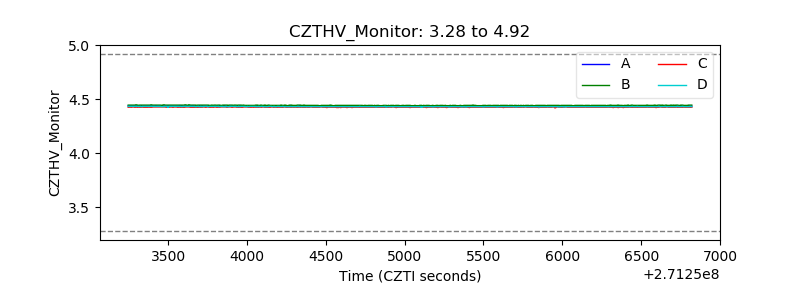 |
| D_VDD | 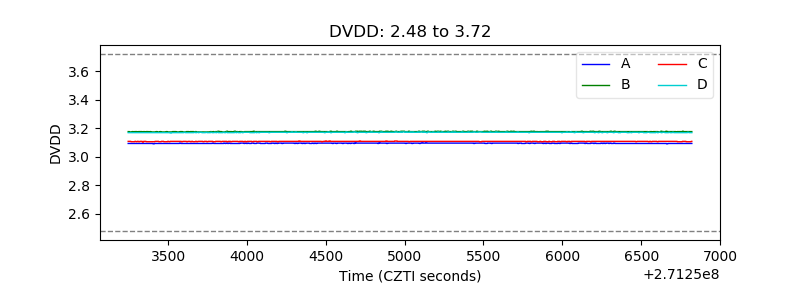 |
| Temperature 1 | 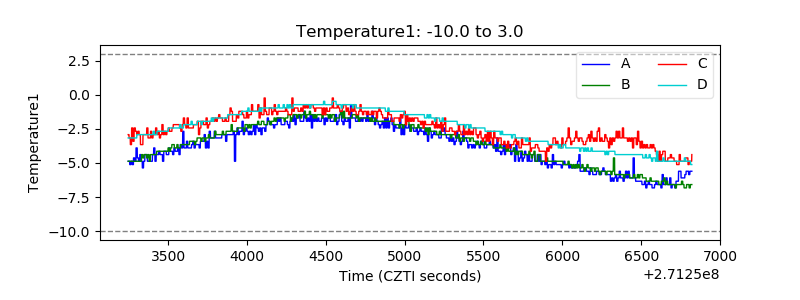 |
| Veto HV Monitor |  |
| Veto LLD | 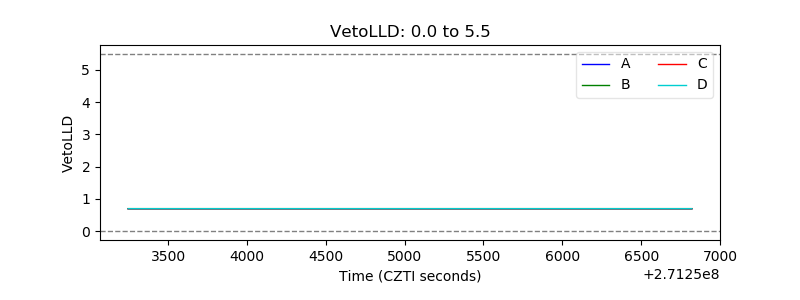 |
| Alpha Counter | 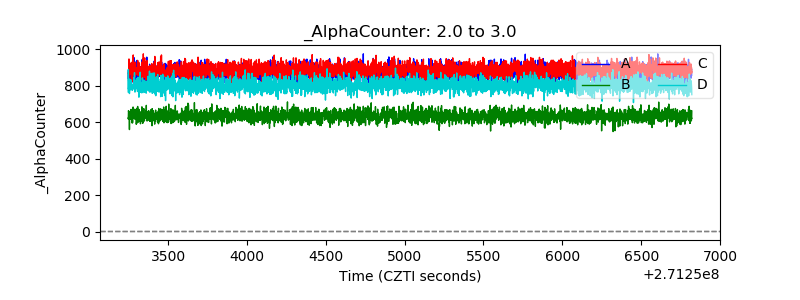 |
| _CPM_Rate | 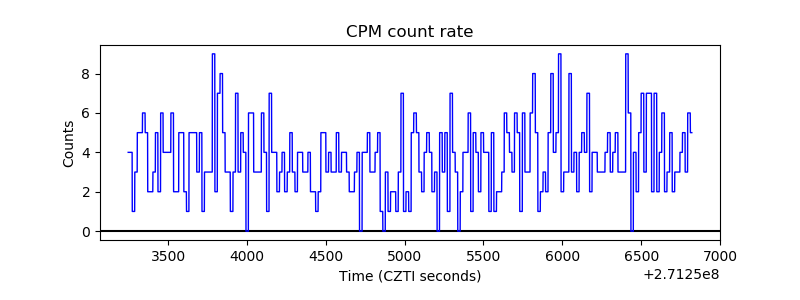 |
| CZT Counter |  |
| +2.5 Volts monitor |  |
| +5 Volts monitor | 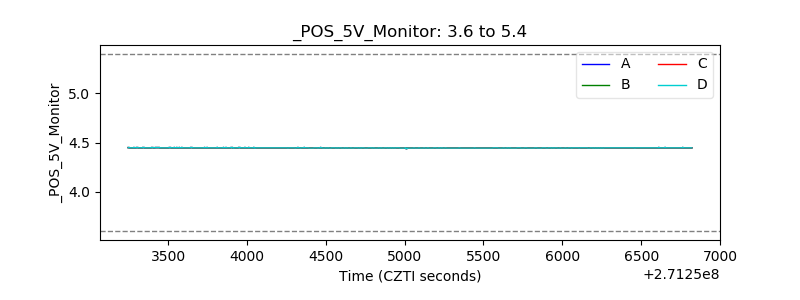 |
| _ROLL_ROT | 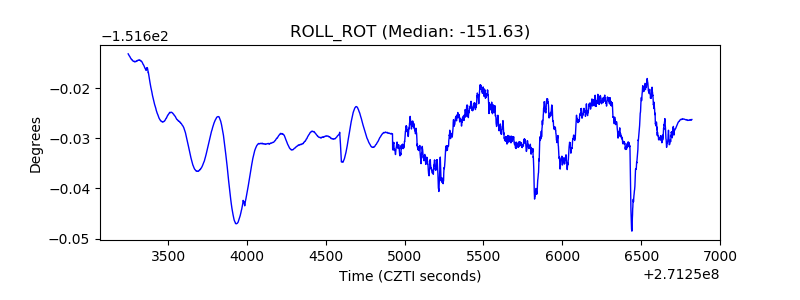 |
| _Roll_DEC |  |
| _Roll_RA |  |
| Veto Counter | 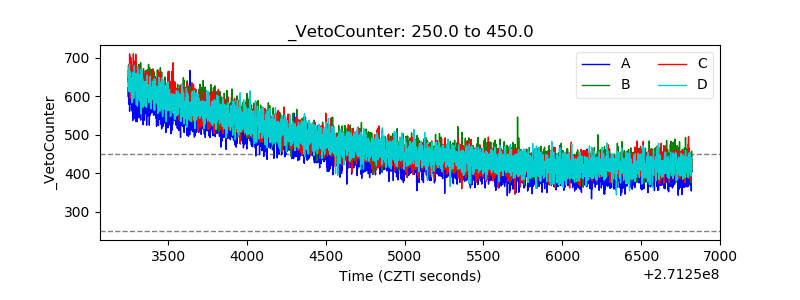 |