| Param | Original file | Final file |
|---|---|---|
| Filename | modeM0/AS1G08_032T01_9000002280cztM0_level2.fits | modeM0/AS1G08_032T01_9000002280cztM0_level2_quad_clean.evt |
| Size (bytes) | 330,975,360 | 305,481,600 |
| Size | 315.6 MB | 291.3 MB |
| Events in quadrant A | 1,997,636 | 1,774,577 |
| Events in quadrant B | 1,922,052 | 1,790,084 |
| Events in quadrant C | 1,956,728 | 1,680,690 |
| Events in quadrant D | 1,706,854 | 1,565,011 |
| Mode SS | |||
|---|---|---|---|
| Quadrant | BADHDUFLAG | Total packets | Discarded packets |
| A | 0 | 722 | 0 |
| B | 0 | 722 | 0 |
| C | 0 | 722 | 0 |
| D | 0 | 722 | 0 |
| Mode M9 | |||
|---|---|---|---|
| Quadrant | BADHDUFLAG | Total packets | Discarded packets |
| A | 0 | 35 | 0 |
| B | 0 | 35 | 0 |
| C | 0 | 35 | 0 |
| D | 0 | 35 | 0 |
| Mode M0 | |||
|---|---|---|---|
| Quadrant | BADHDUFLAG | Total packets | Discarded packets |
| A | 0 | 75220 | 0 |
| B | 0 | 74788 | 0 |
| C | 0 | 76669 | 0 |
| D | 0 | 78001 | 0 |
| Quadrant | Total seconds | Saturated seconds | Saturation percentage |
|---|---|---|---|
| A | 35533 | 416 | 1.170743% |
| B | 35533 | 343 | 0.965300% |
| C | 35533 | 210 | 0.591000% |
| D | 35533 | 445 | 1.252357% |
Noise dominated data is calculated using 1-second bins in cleaned event files. If a bin has >2000 counts, and if more than 50% of those come from <1% of pixels, then it is considered to be noise-dominated and hence unusable.
| Quadrant | # 1 sec bins | Bins with >0 counts | Bins with >2000 counts | High rate bins dominated by noise | Noise dominated (total time) | Noise dominated (detector-on time) | Marked lightcurve |
|---|---|---|---|---|---|---|---|
| A | 38943 | 35532 | 0 | 0 | 0.00% | 0.00% |  |
| B | 38943 | 35532 | 0 | 0 | 0.00% | 0.00% | 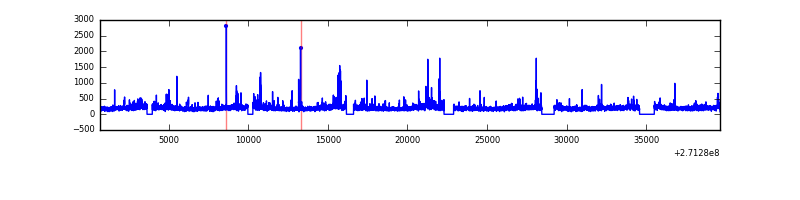 |
| C | 38943 | 35533 | 0 | 0 | 0.00% | 0.00% | 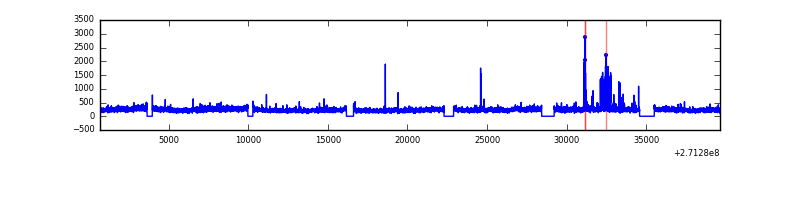 |
| D | 38943 | 35533 | 0 | 0 | 0.00% | 0.00% | 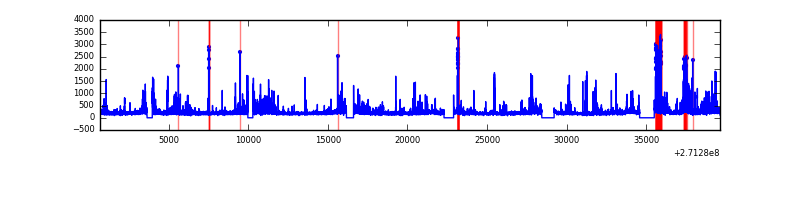 |
Top three noisy pixels from each quadrant. If the there are fewer than three noisy pixels in the level2.evt file, extra rows are filled as -1
| Pixel properties | Quadrant properties | ||||||
|---|---|---|---|---|---|---|---|
| Quadrant | DetID | PixID | Counts | Sigma | Mean | Median | Sigma |
| A | 14 | 188 | 2091 | 12.39 | 518 | 484 | 129.7 |
| A | 0 | 29 | 1874 | 10.72 | 518 | 484 | 129.7 |
| A | 14 | 204 | 1736 | 9.65 | 518 | 484 | 129.7 |
| B | 2 | 9 | 1587 | 10.85 | 507 | 481 | 101.9 |
| B | 14 | 254 | 1301 | 8.05 | 507 | 481 | 101.9 |
| B | 2 | 8 | 1296 | 8.0 | 507 | 481 | 101.9 |
| C | 1 | 80 | 1489 | 7.44 | 516 | 478 | 135.8 |
| C | 1 | 81 | 1405 | 6.83 | 516 | 478 | 135.8 |
| C | 7 | 111 | 1345 | 6.38 | 516 | 478 | 135.8 |
| D | 3 | 14 | 1247 | 6.15 | 487 | 442 | 130.9 |
| D | 6 | 231 | 1243 | 6.12 | 487 | 442 | 130.9 |
| D | 6 | 67 | 1220 | 5.94 | 487 | 442 | 130.9 |
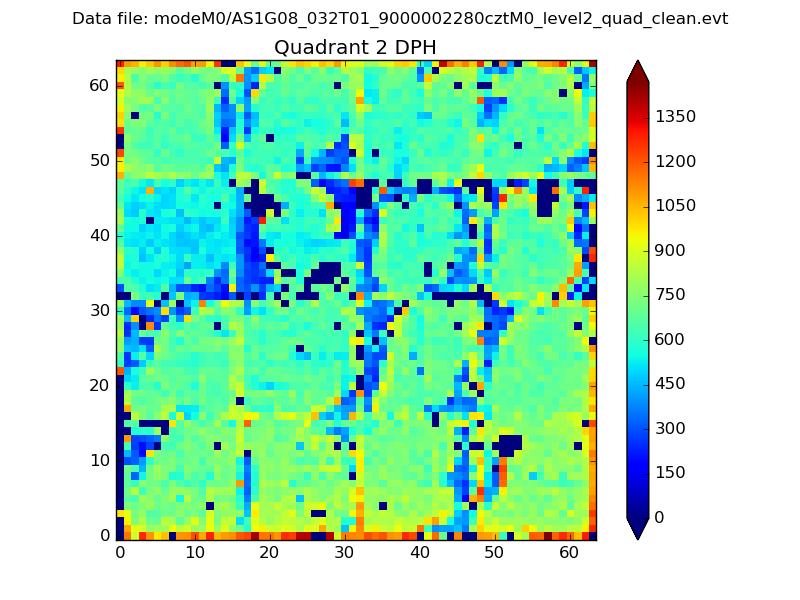
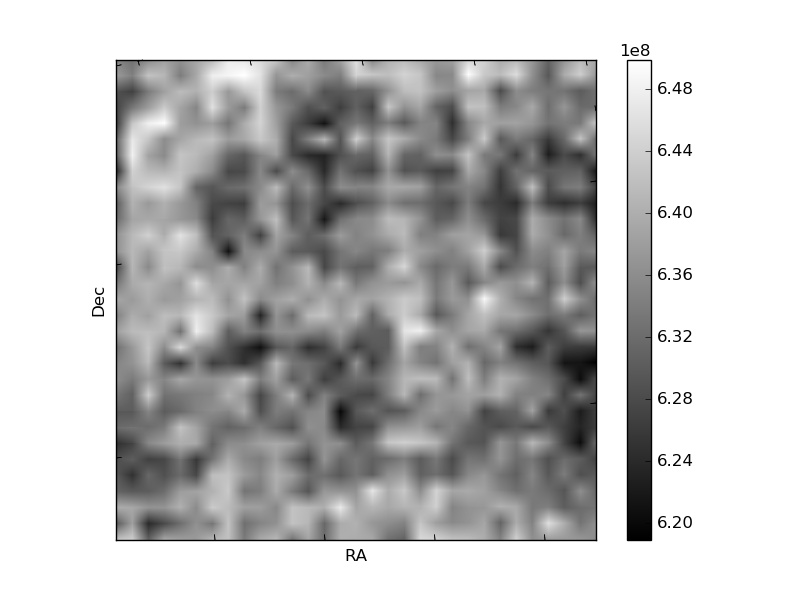
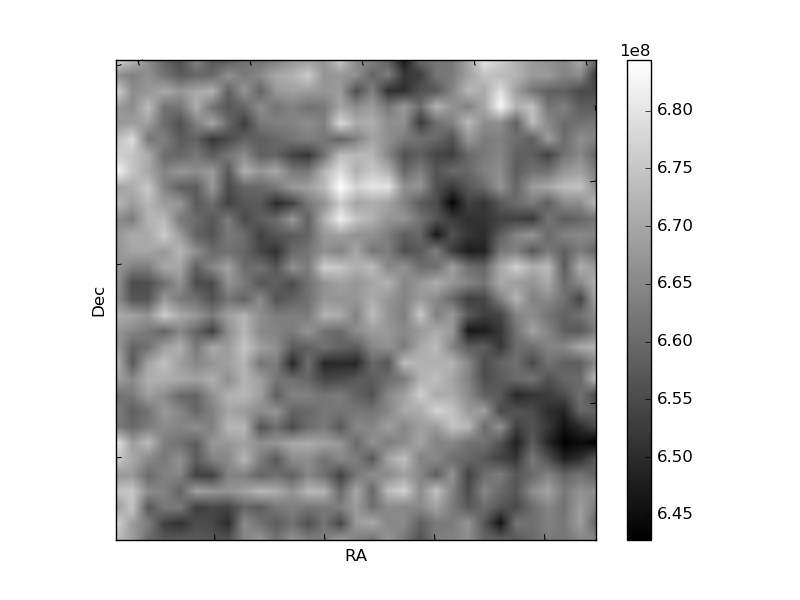
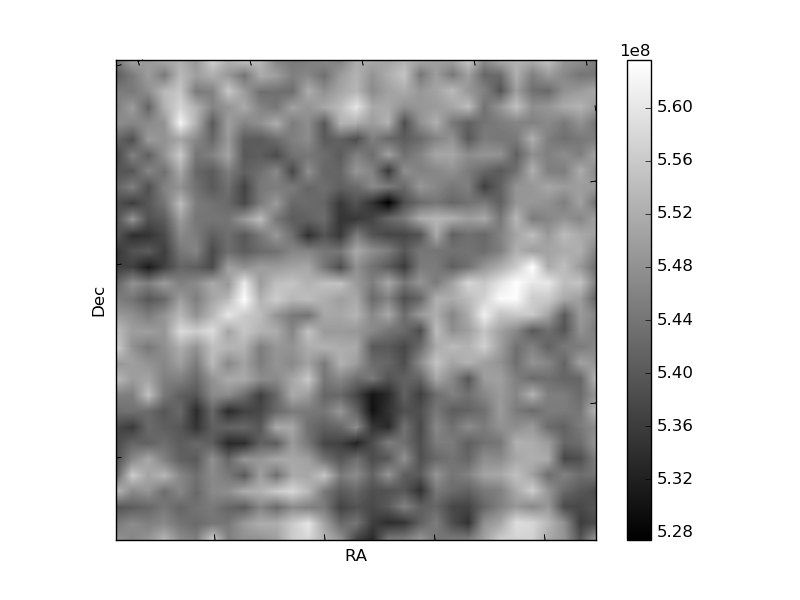
Histogram calculated using DETX and DETY for each event in the final _common_clean file
| Quadrant A |  |
 |
Quadrant B |
|---|---|---|---|
| Quadrant D | 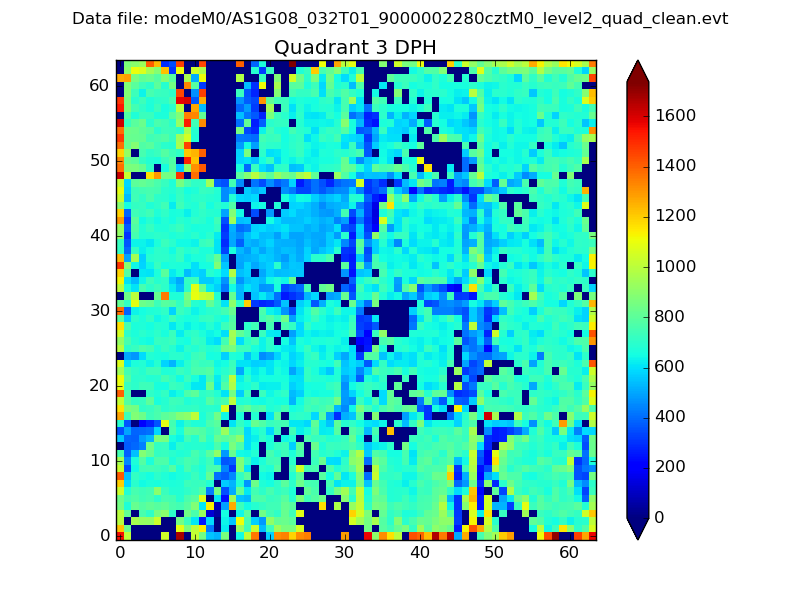 |
 |
Quadrant C |
| Plot type | Count rate plots | Images |
|---|---|---|
| Comparison with Poisson distribution Blue bars denote a histogram of data divided into 1 sec bins. Red curve is a Poisson curve with rate = median count rate of data. |
 |
 |
| Quadrant-wise count rates Data is divided into 100 sec bins |
 |
|
| Module-wise count rates for Quadrant A Data is divided into 100 sec bins |
 |
 |
| Module-wise count rates for Quadrant B Data is divided into 100 sec bins |
 |
 |
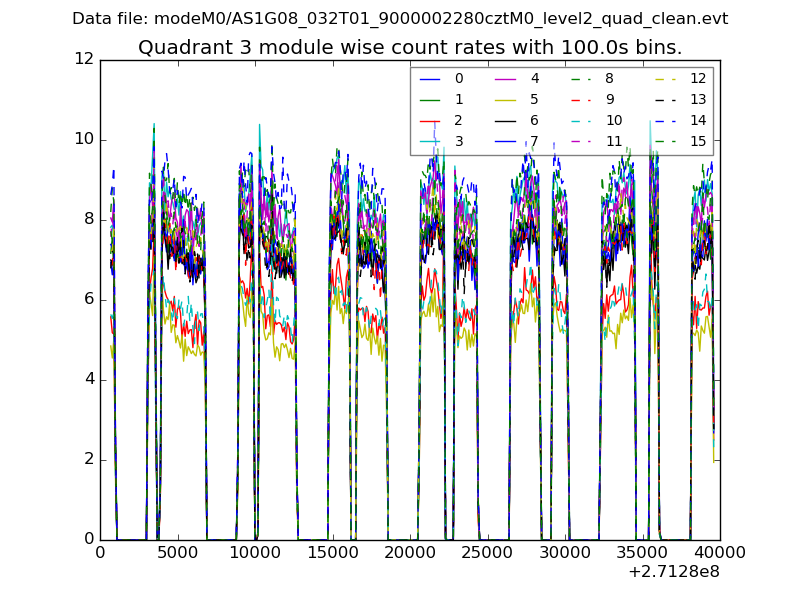
| Module-wise count rates for Quadrant C Data is divided into 100 sec bins |
 |
 |
| Module-wise count rates for Quadrant D Data is divided into 100 sec bins |
 |
 |
| Parameter | Plot |
|---|---|
| CZT HV Monitor |  |
| D_VDD | 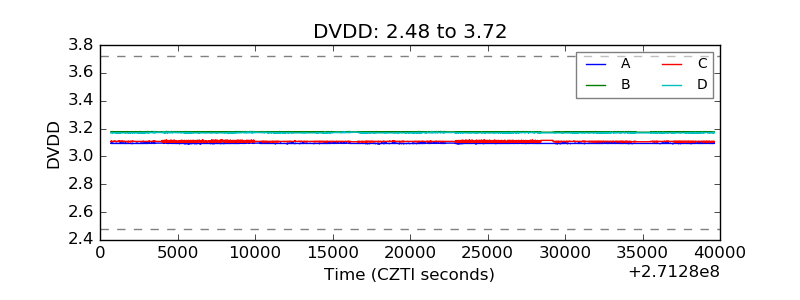 |
| Temperature 1 |  |
| Veto HV Monitor |  |
| Veto LLD |  |
| Alpha Counter |  |
| _CPM_Rate | 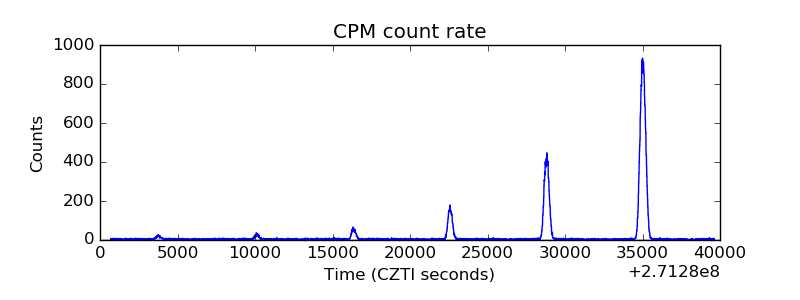 |
| CZT Counter | 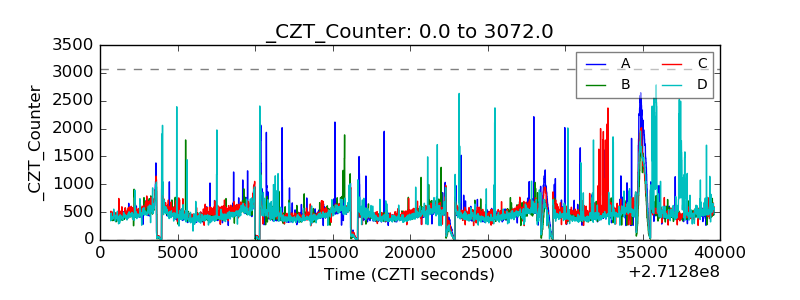 |
| +2.5 Volts monitor | 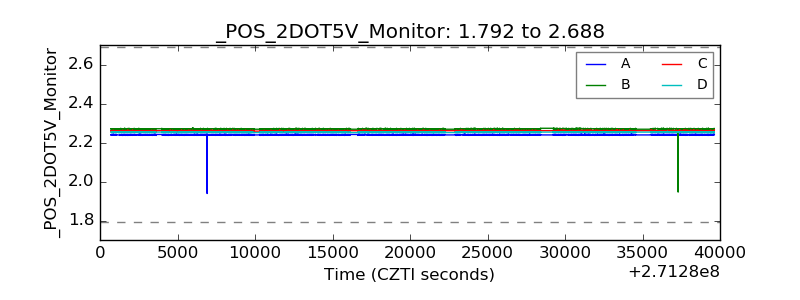 |
| +5 Volts monitor | 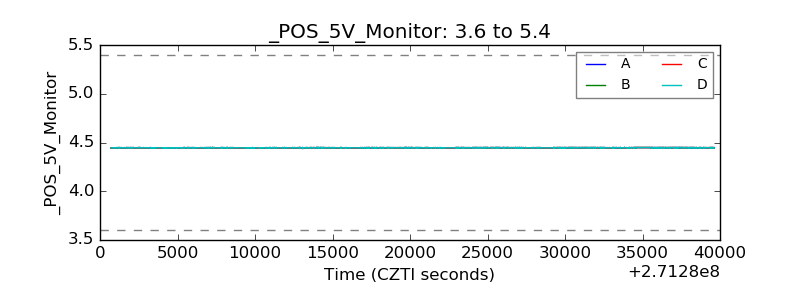 |
| _ROLL_ROT | 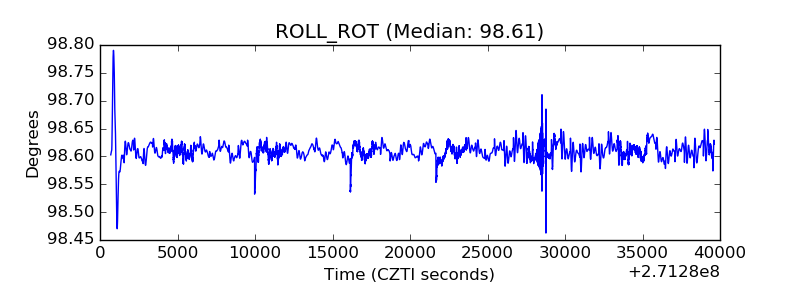 |
| _Roll_DEC | 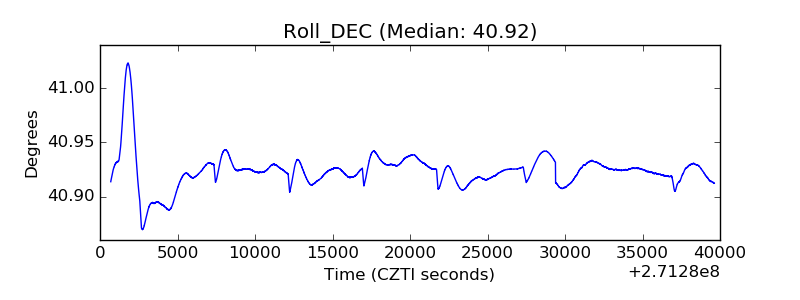 |
| _Roll_RA |  |
| Veto Counter |  |