| Param | Original file | Final file |
|---|---|---|
| Filename | modeM0/AS1G08_032T01_9000002280_15449cztM0_level2.evt | modeM0/AS1G08_032T01_9000002280_15449cztM0_level2_quad_clean.evt |
| Size (bytes) | 513,365,760 | 104,696,640 |
| Size | 489.6 MB | 99.8 MB |
| Events in quadrant A | 3,686,714 | 668,669 |
| Events in quadrant B | 3,633,919 | 683,270 |
| Events in quadrant C | 3,960,865 | 664,518 |
| Events in quadrant D | 3,759,479 | 635,321 |
| Mode SS | |||
|---|---|---|---|
| Quadrant | BADHDUFLAG | Total packets | Discarded packets |
| A | 0 | 152 | 0 |
| B | 0 | 152 | 0 |
| C | 0 | 152 | 0 |
| D | 0 | 152 | 0 |
| Mode M9 | |||
|---|---|---|---|
| Quadrant | BADHDUFLAG | Total packets | Discarded packets |
| A | 0 | 3 | 0 |
| B | 0 | 3 | 0 |
| C | 0 | 3 | 0 |
| D | 0 | 4 | 0 |
| Mode M0 | |||
|---|---|---|---|
| Quadrant | BADHDUFLAG | Total packets | Discarded packets |
| A | 0 | 16140 | 3 |
| B | 0 | 15842 | 2 |
| C | 0 | 16515 | 2 |
| D | 0 | 16530 | 2 |
| Quadrant | Total seconds | Saturated seconds | Saturation percentage |
|---|---|---|---|
| A | 7455 | 97 | 1.301140% |
| B | 7455 | 66 | 0.885312% |
| C | 7455 | 26 | 0.348759% |
| D | 7455 | 127 | 1.703555% |
Noise dominated data is calculated using 1-second bins in cleaned event files. If a bin has >2000 counts, and if more than 50% of those come from <1% of pixels, then it is considered to be noise-dominated and hence unusable.
| Quadrant | # 1 sec bins | Bins with >0 counts | Bins with >2000 counts | High rate bins dominated by noise | Noise dominated (total time) | Noise dominated (detector-on time) | Marked lightcurve |
|---|---|---|---|---|---|---|---|
| A | 7771 | 7457 | 36 | 36 | 0.46% | 0.48% | 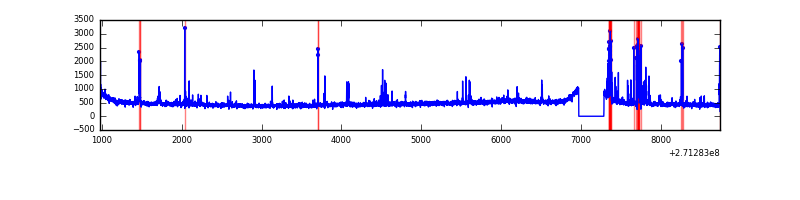 |
| B | 7771 | 7457 | 3 | 3 | 0.04% | 0.04% | 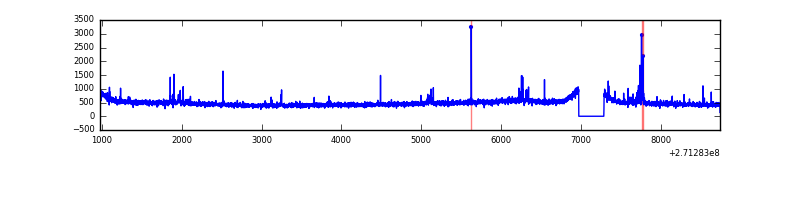 |
| C | 7771 | 7457 | 0 | 0 | 0.00% | 0.00% | 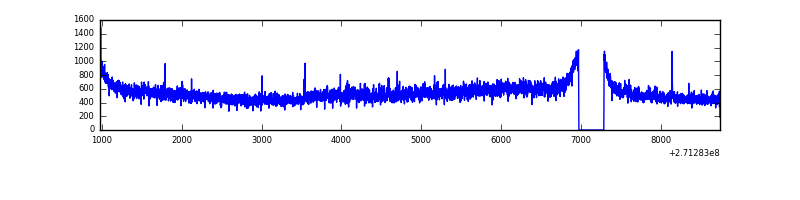 |
| D | 7771 | 7457 | 52 | 52 | 0.67% | 0.70% | 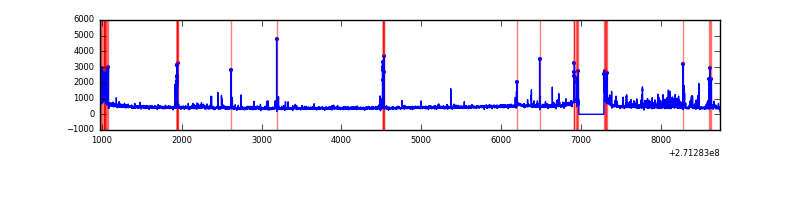 |
Top three noisy pixels from each quadrant. If the there are fewer than three noisy pixels in the level2.evt file, extra rows are filled as -1
| Pixel properties | Quadrant properties | ||||||
|---|---|---|---|---|---|---|---|
| Quadrant | DetID | PixID | Counts | Sigma | Mean | Median | Sigma |
| A | 14 | 238 | 158963 | 874.71 | 886 | 867 | 180.7 |
| A | 14 | 237 | 67543 | 368.91 | 886 | 867 | 180.7 |
| A | 9 | 143 | 24814 | 132.49 | 886 | 867 | 180.7 |
| B | 0 | 189 | 42210 | 239.11 | 892 | 867 | 172.9 |
| B | 0 | 197 | 33357 | 187.91 | 892 | 867 | 172.9 |
| B | 12 | 111 | 20255 | 112.13 | 892 | 867 | 172.9 |
| C | 3 | 233 | 547276 | 2688.51 | 871 | 875 | 203.2 |
| C | 8 | 128 | 11407 | 51.82 | 871 | 875 | 203.2 |
| C | 13 | 61 | 6149 | 25.95 | 871 | 875 | 203.2 |
| D | 5 | 222 | 179748 | 851.95 | 863 | 837 | 210.0 |
| D | 7 | 38 | 143062 | 677.25 | 863 | 837 | 210.0 |
| D | 10 | 70 | 37681 | 175.44 | 863 | 837 | 210.0 |
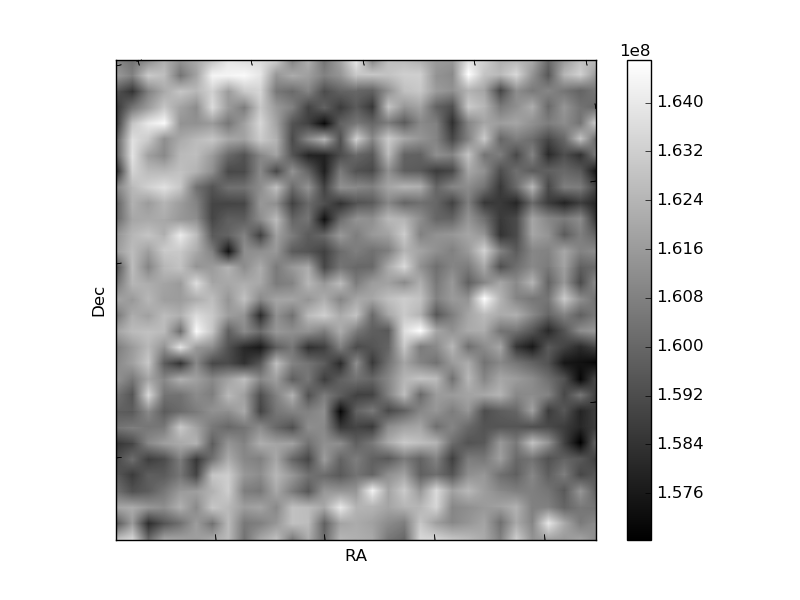
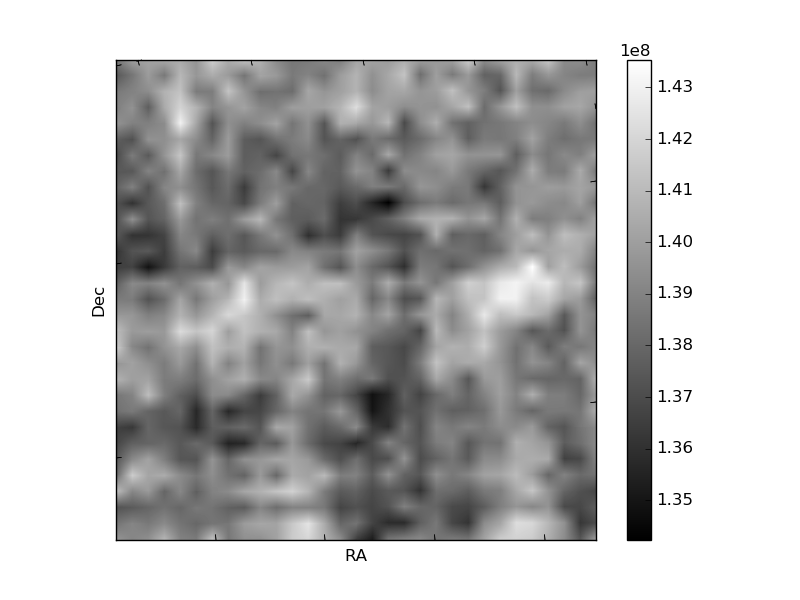
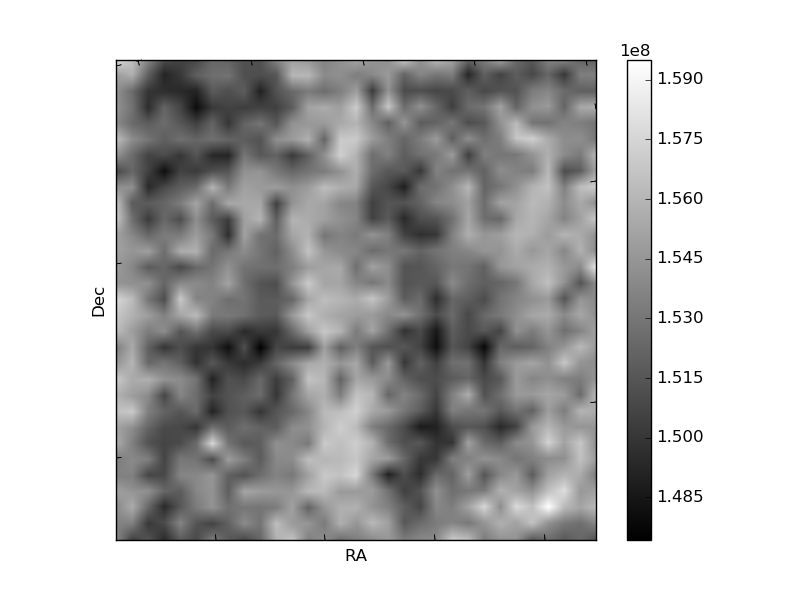
Histogram calculated using DETX and DETY for each event in the final _common_clean file
| Quadrant A | 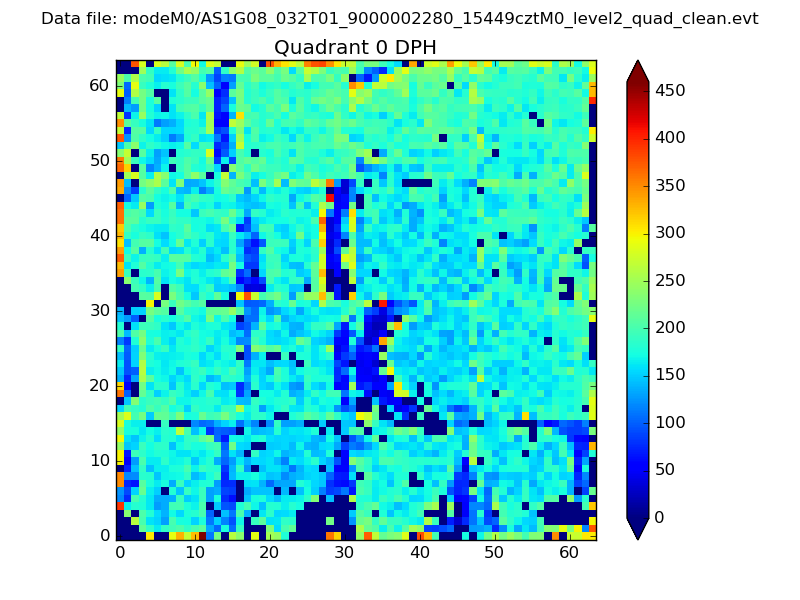 |
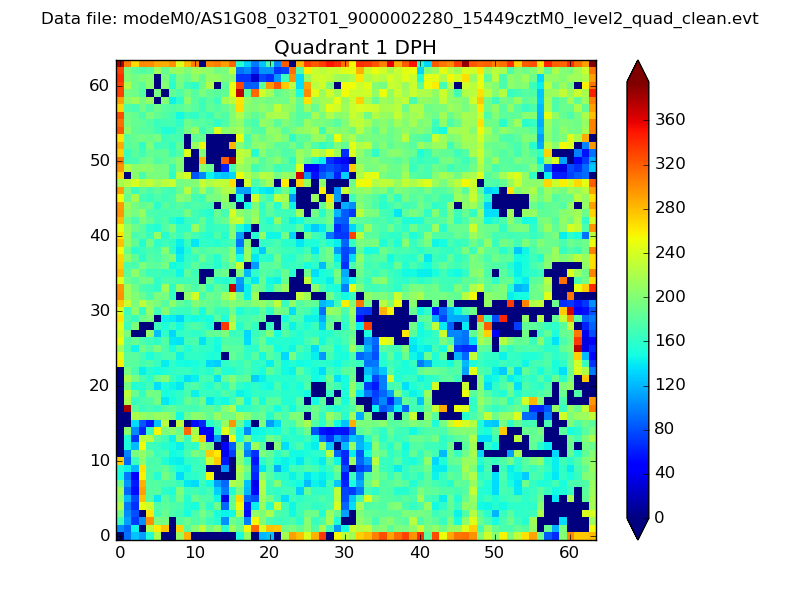 |
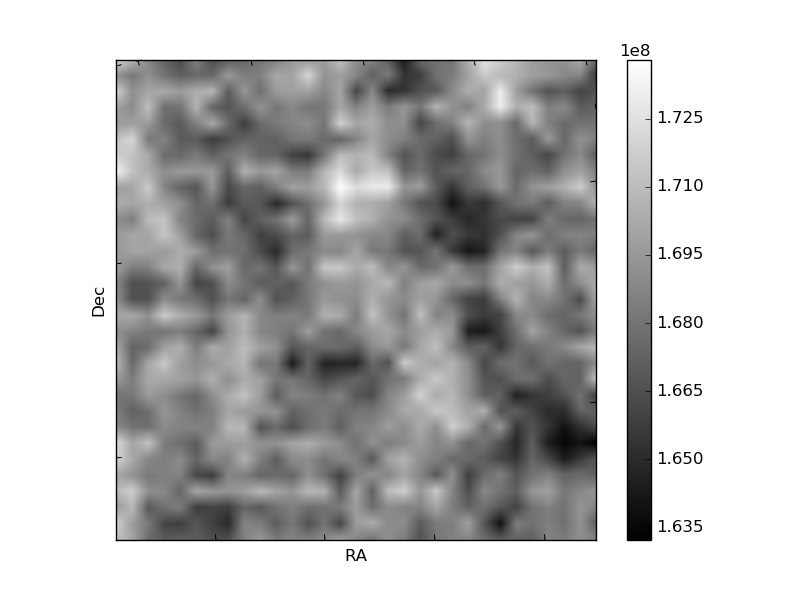
Quadrant B |
|---|---|---|---|
| Quadrant D |  |
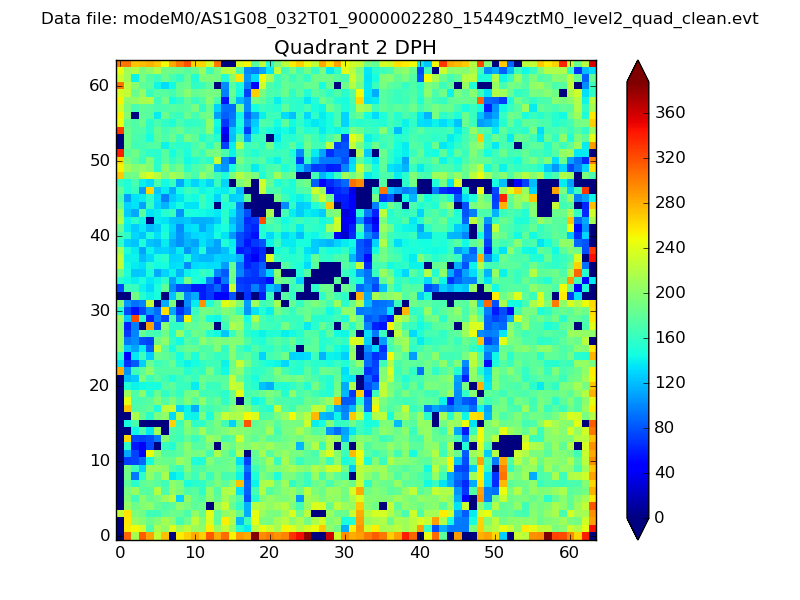 |
Quadrant C |
| Plot type | Count rate plots | Images |
|---|---|---|
| Comparison with Poisson distribution Blue bars denote a histogram of data divided into 1 sec bins. Red curve is a Poisson curve with rate = median count rate of data. |
 |
 |
| Quadrant-wise count rates Data is divided into 100 sec bins |
 |
|
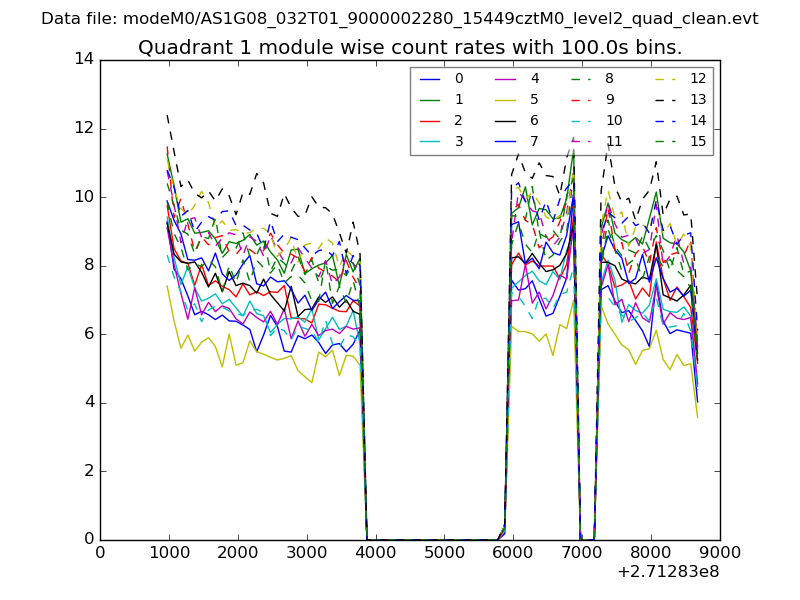
| Module-wise count rates for Quadrant A Data is divided into 100 sec bins |
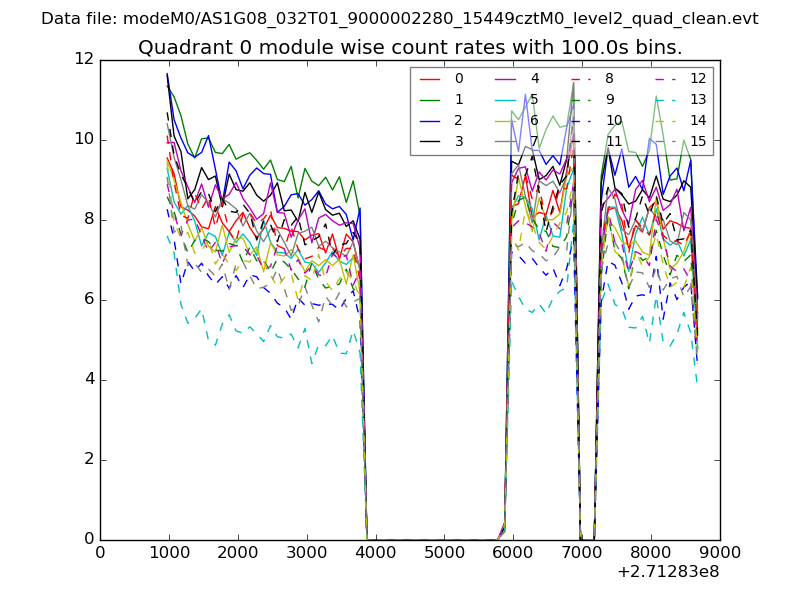 |
 |
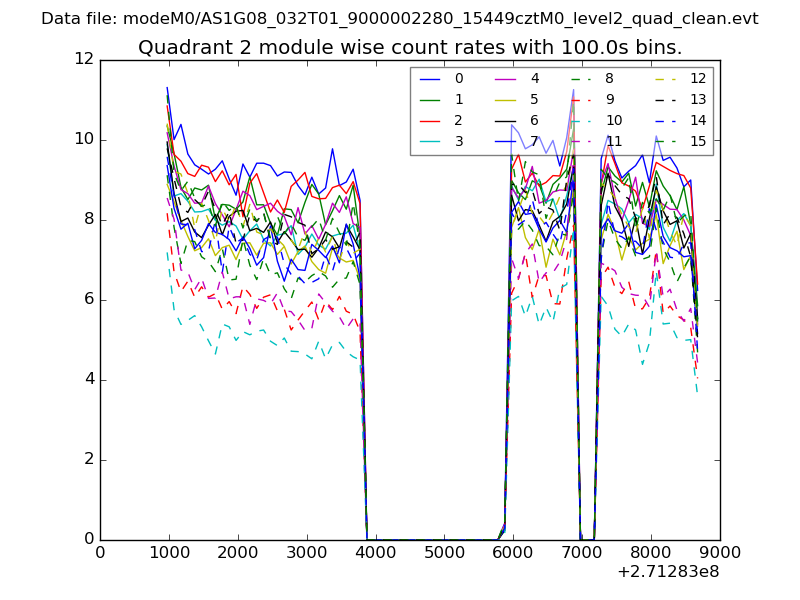
| Module-wise count rates for Quadrant B Data is divided into 100 sec bins |
 |
 |
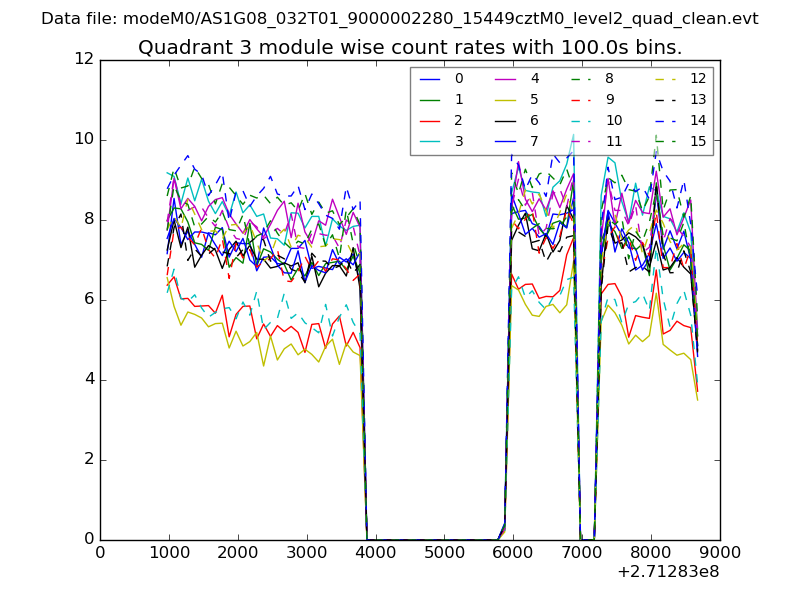
| Module-wise count rates for Quadrant C Data is divided into 100 sec bins |
 |
 |
| Module-wise count rates for Quadrant D Data is divided into 100 sec bins |
 |
 |
| Parameter | Plot |
|---|---|
| CZT HV Monitor | 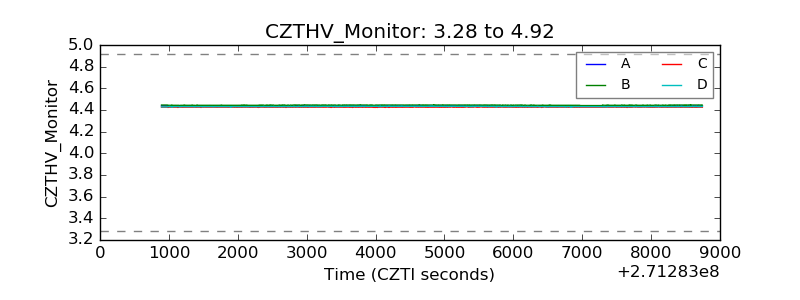 |
| D_VDD | 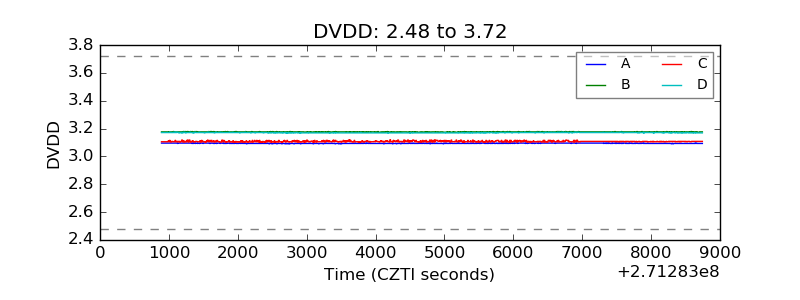 |
| Temperature 1 | 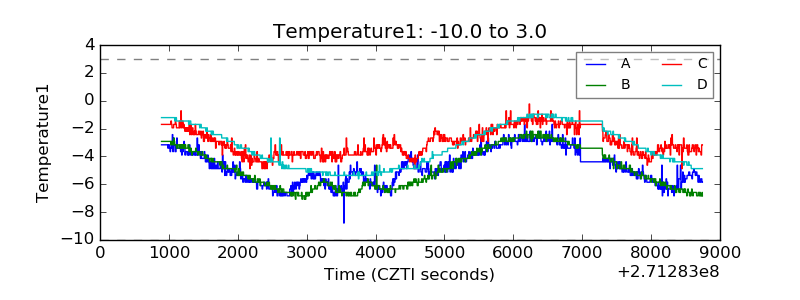 |
| Veto HV Monitor |  |
| Veto LLD | 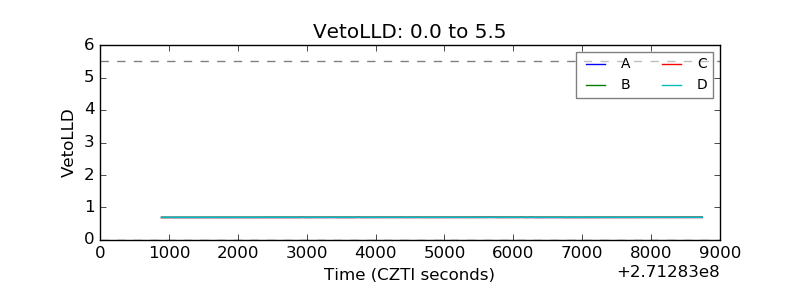 |
| Alpha Counter | 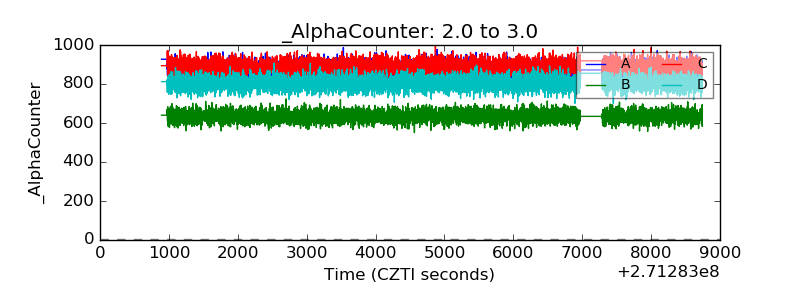 |
| _CPM_Rate |  |
| CZT Counter | 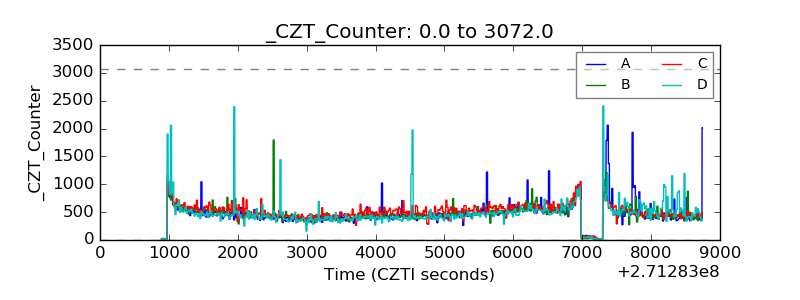 |
| +2.5 Volts monitor | 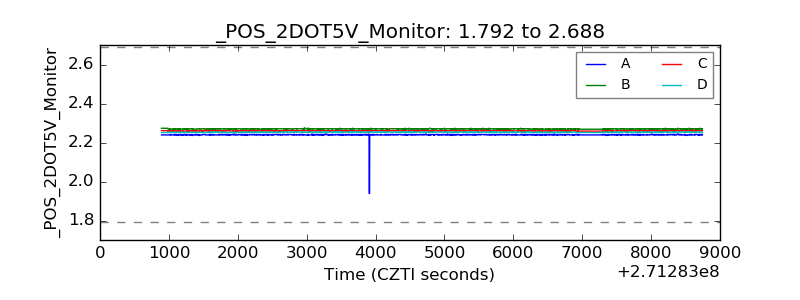 |
| +5 Volts monitor |  |
| _ROLL_ROT | 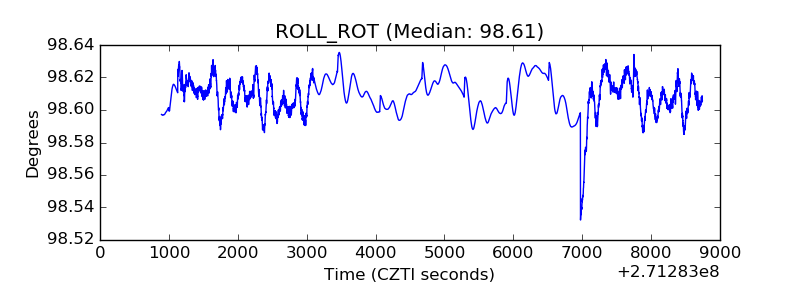 |
| _Roll_DEC | 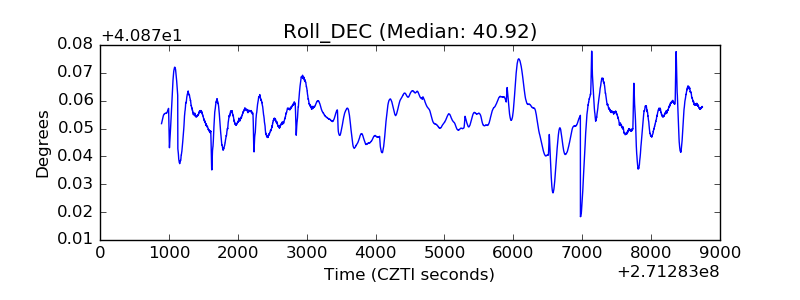 |
| _Roll_RA | 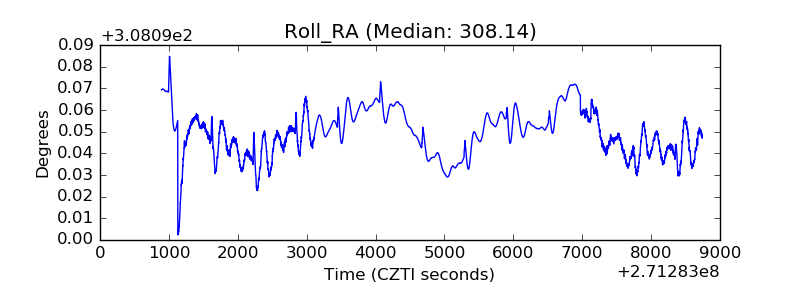 |
| Veto Counter | 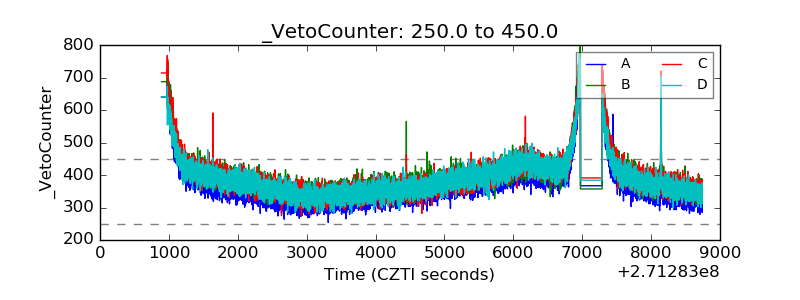 |