| Param | Original file | Final file |
|---|---|---|
| Filename | modeM0/AS1G08_032T01_9000002280_15450cztM0_level2.evt | modeM0/AS1G08_032T01_9000002280_15450cztM0_level2_quad_clean.evt |
| Size (bytes) | 551,266,560 | 116,017,920 |
| Size | 525.7 MB | 110.6 MB |
| Events in quadrant A | 4,070,633 | 741,718 |
| Events in quadrant B | 4,018,239 | 757,283 |
| Events in quadrant C | 4,029,404 | 742,323 |
| Events in quadrant D | 4,030,562 | 713,060 |
| Mode SS | |||
|---|---|---|---|
| Quadrant | BADHDUFLAG | Total packets | Discarded packets |
| A | 0 | 164 | 0 |
| B | 0 | 164 | 0 |
| C | 0 | 164 | 0 |
| D | 0 | 164 | 0 |
| Mode M9 | |||
|---|---|---|---|
| Quadrant | BADHDUFLAG | Total packets | Discarded packets |
| A | 0 | 8 | 0 |
| B | 0 | 8 | 0 |
| C | 0 | 8 | 0 |
| D | 0 | 8 | 0 |
| Mode M0 | |||
|---|---|---|---|
| Quadrant | BADHDUFLAG | Total packets | Discarded packets |
| A | 0 | 17680 | 3 |
| B | 0 | 17490 | 2 |
| C | 0 | 17255 | 2 |
| D | 0 | 17727 | 2 |
| Quadrant | Total seconds | Saturated seconds | Saturation percentage |
|---|---|---|---|
| A | 8051 | 150 | 1.863123% |
| B | 8051 | 117 | 1.453236% |
| C | 8051 | 51 | 0.633462% |
| D | 8051 | 96 | 1.192398% |
Noise dominated data is calculated using 1-second bins in cleaned event files. If a bin has >2000 counts, and if more than 50% of those come from <1% of pixels, then it is considered to be noise-dominated and hence unusable.
| Quadrant | # 1 sec bins | Bins with >0 counts | Bins with >2000 counts | High rate bins dominated by noise | Noise dominated (total time) | Noise dominated (detector-on time) | Marked lightcurve |
|---|---|---|---|---|---|---|---|
| A | 8817 | 8054 | 51 | 51 | 0.58% | 0.63% | 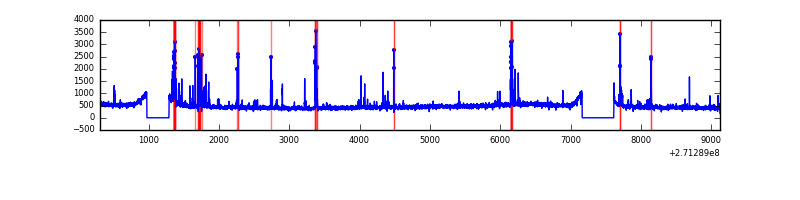 |
| B | 8817 | 8054 | 12 | 12 | 0.14% | 0.15% | 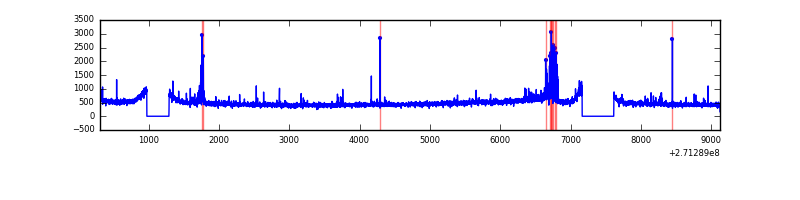 |
| C | 8817 | 8054 | 0 | 0 | 0.00% | 0.00% | 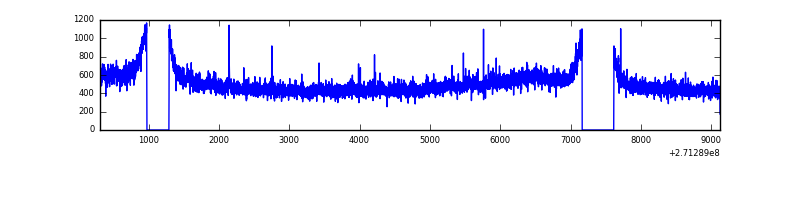 |
| D | 8817 | 8054 | 30 | 30 | 0.34% | 0.37% | 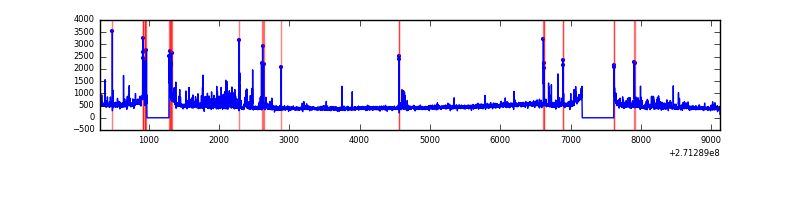 |
Top three noisy pixels from each quadrant. If the there are fewer than three noisy pixels in the level2.evt file, extra rows are filled as -1
| Pixel properties | Quadrant properties | ||||||
|---|---|---|---|---|---|---|---|
| Quadrant | DetID | PixID | Counts | Sigma | Mean | Median | Sigma |
| A | 14 | 238 | 223245 | 1138.2 | 958 | 936 | 195.3 |
| A | 14 | 237 | 84841 | 429.58 | 958 | 936 | 195.3 |
| A | 9 | 143 | 51256 | 257.63 | 958 | 936 | 195.3 |
| B | 0 | 197 | 86480 | 458.71 | 967 | 942 | 186.5 |
| B | 4 | 142 | 69882 | 369.7 | 967 | 942 | 186.5 |
| B | 0 | 189 | 35977 | 187.88 | 967 | 942 | 186.5 |
| C | 3 | 233 | 334088 | 1504.16 | 946 | 949 | 221.5 |
| C | 10 | 22 | 6679 | 25.87 | 946 | 949 | 221.5 |
| C | 13 | 61 | 6658 | 25.78 | 946 | 949 | 221.5 |
| D | 5 | 222 | 249379 | 1083.1 | 940 | 913 | 229.4 |
| D | 7 | 38 | 81686 | 352.1 | 940 | 913 | 229.4 |
| D | 2 | 234 | 34244 | 145.29 | 940 | 913 | 229.4 |
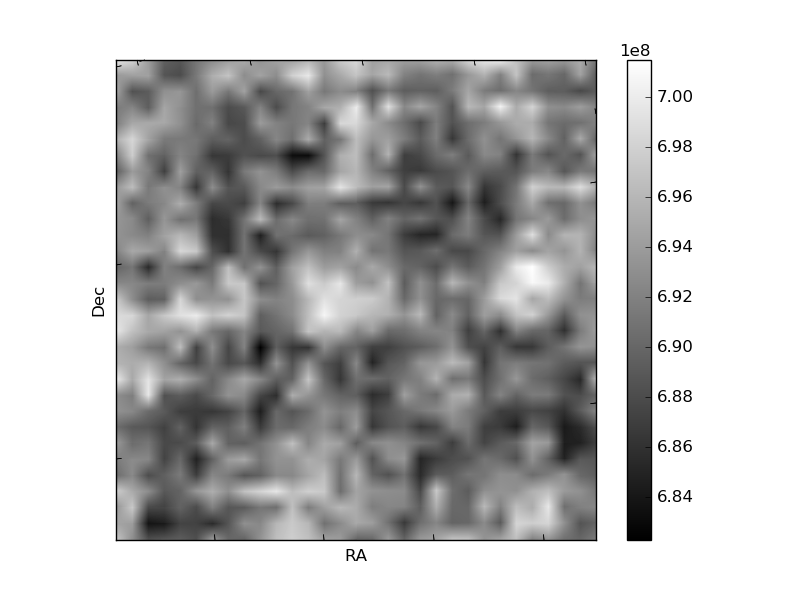
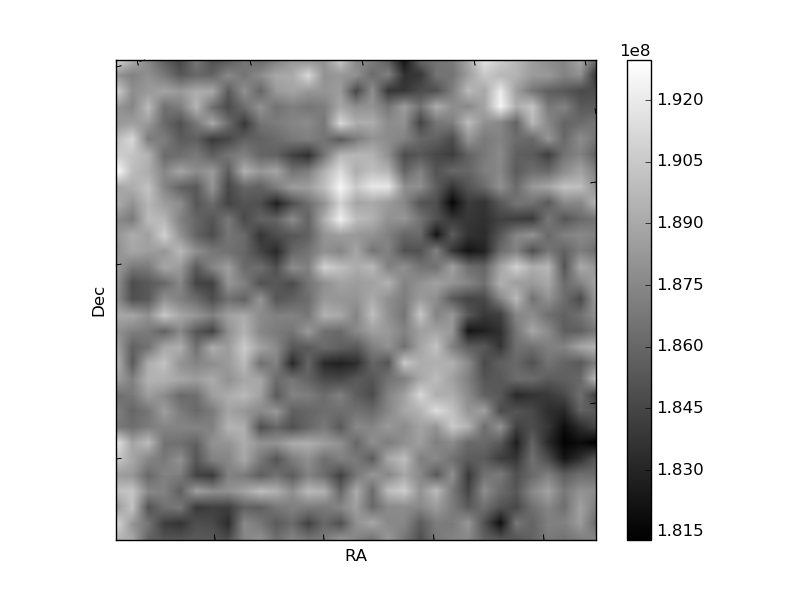
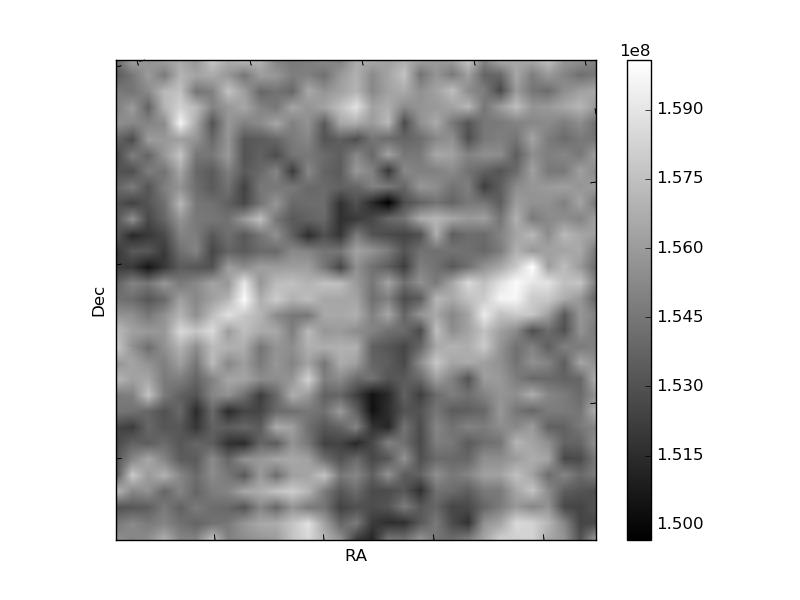
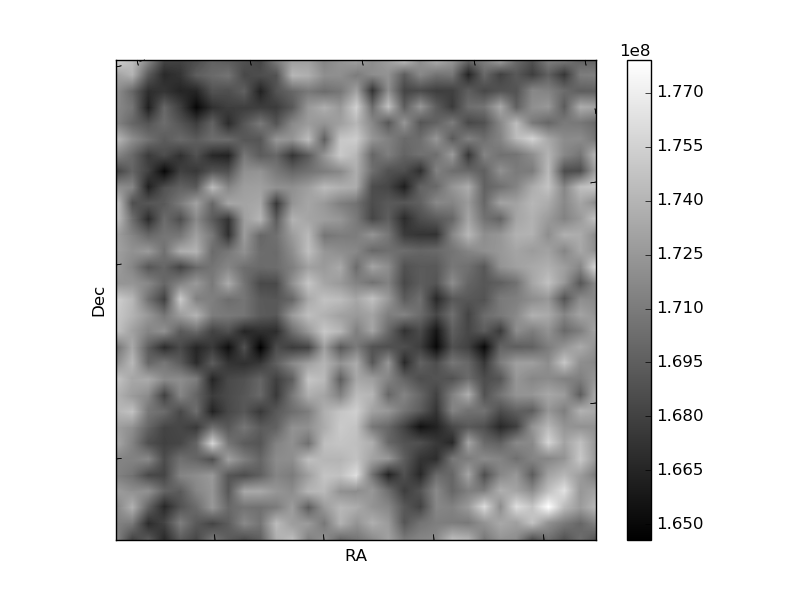
Histogram calculated using DETX and DETY for each event in the final _common_clean file
| Quadrant A | 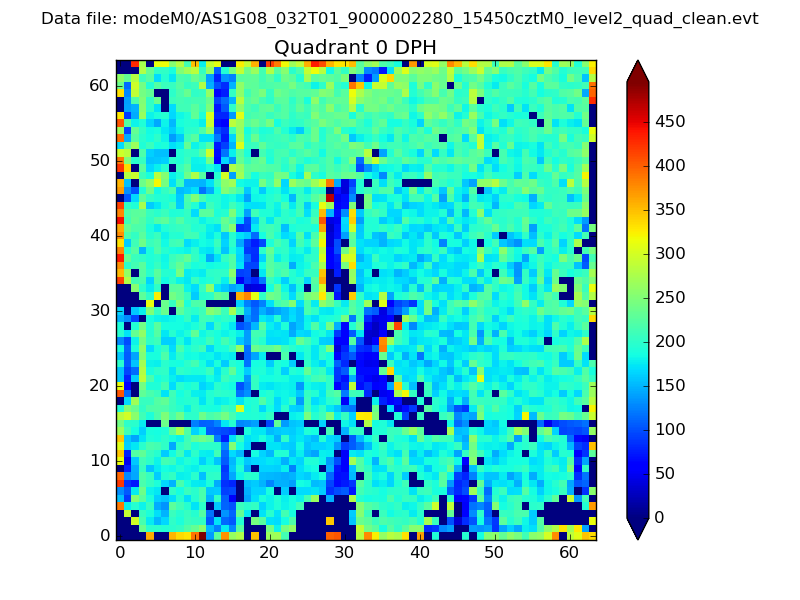 |
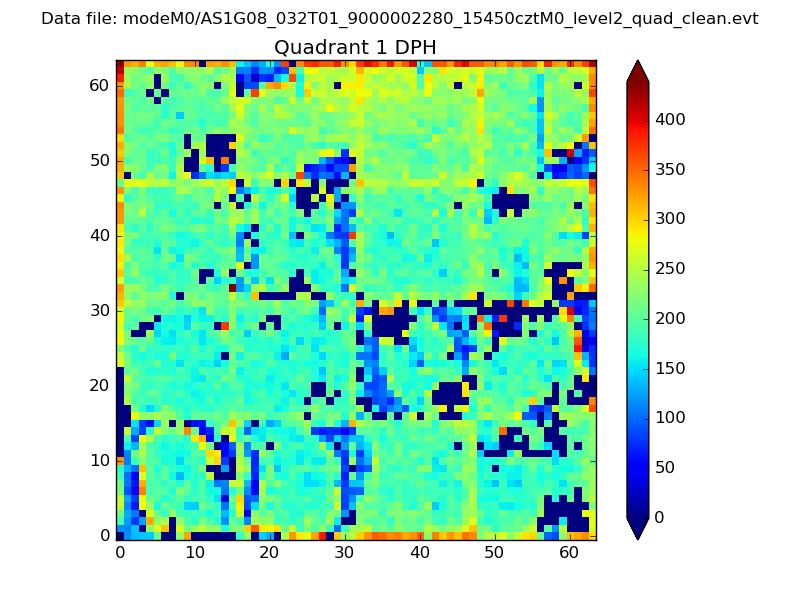 |
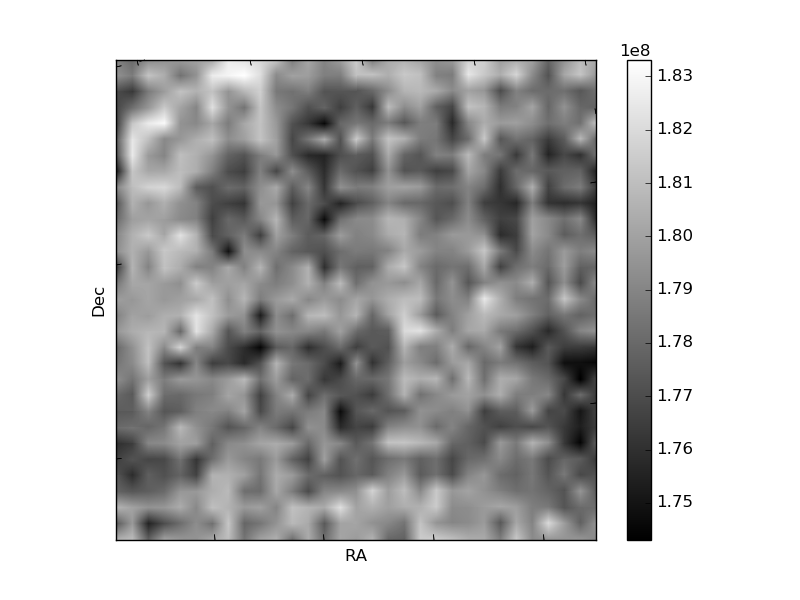
Quadrant B |
|---|---|---|---|
| Quadrant D | 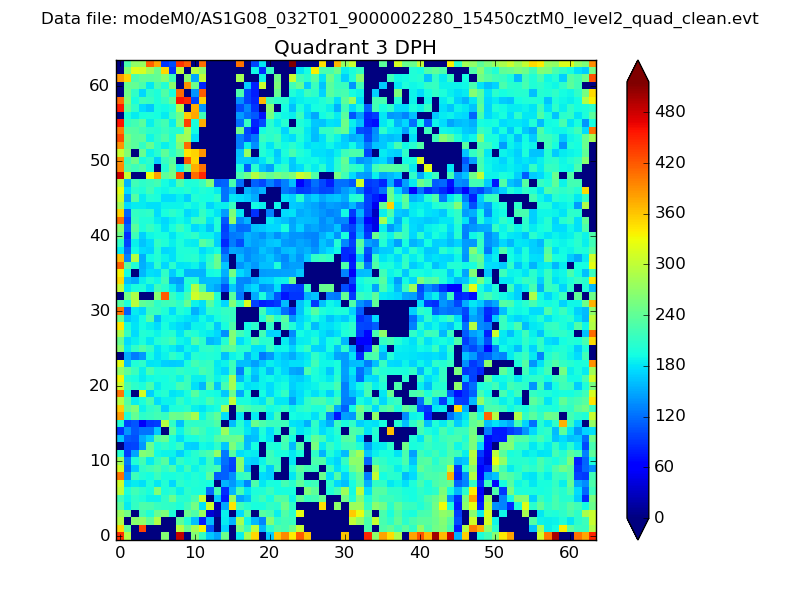 |
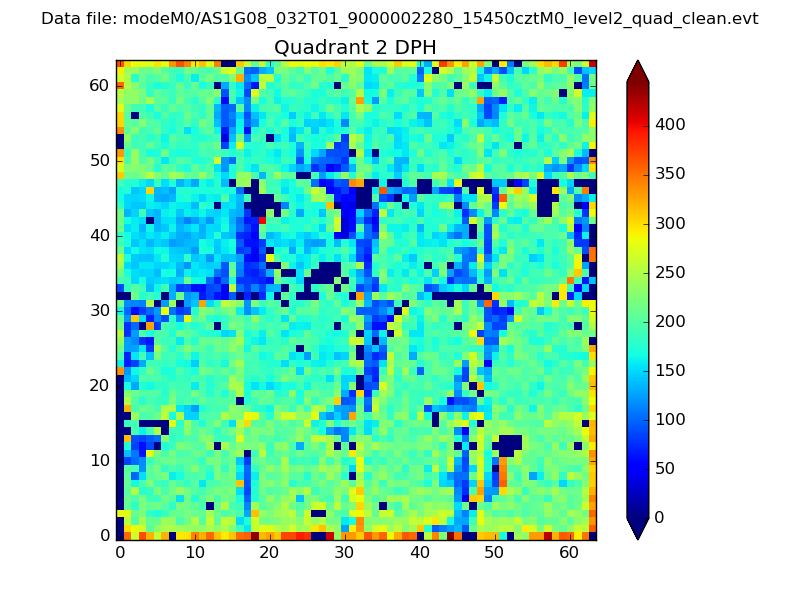 |
Quadrant C |
| Plot type | Count rate plots | Images |
|---|---|---|
| Comparison with Poisson distribution Blue bars denote a histogram of data divided into 1 sec bins. Red curve is a Poisson curve with rate = median count rate of data. |
 |
 |
| Quadrant-wise count rates Data is divided into 100 sec bins |
 |
|
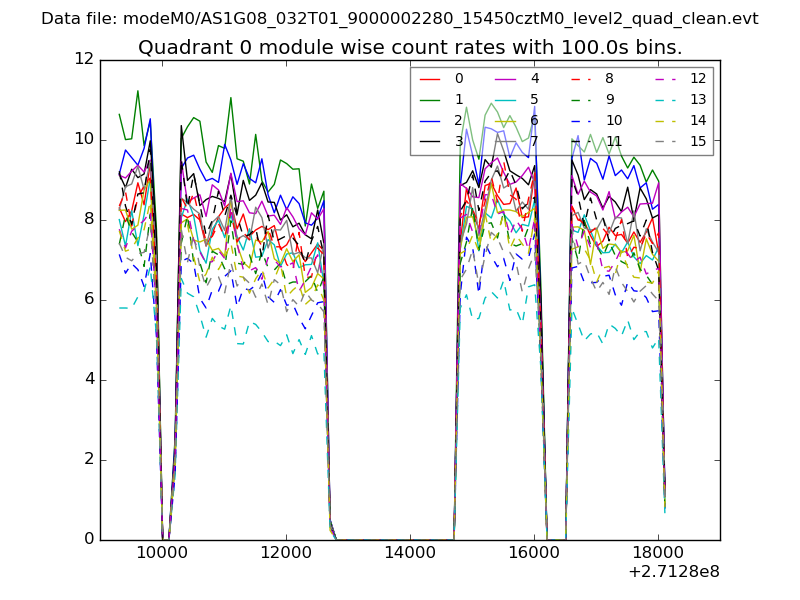
| Module-wise count rates for Quadrant A Data is divided into 100 sec bins |
 |
 |
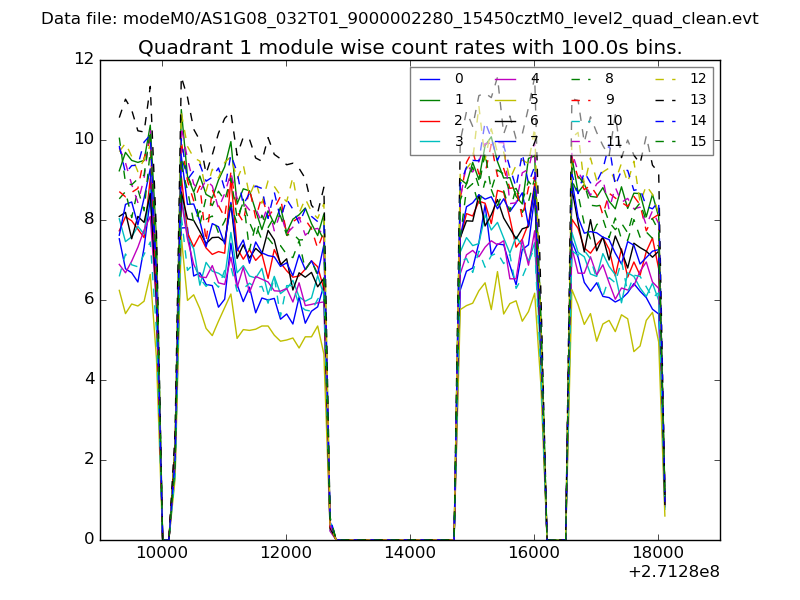
| Module-wise count rates for Quadrant B Data is divided into 100 sec bins |
 |
 |
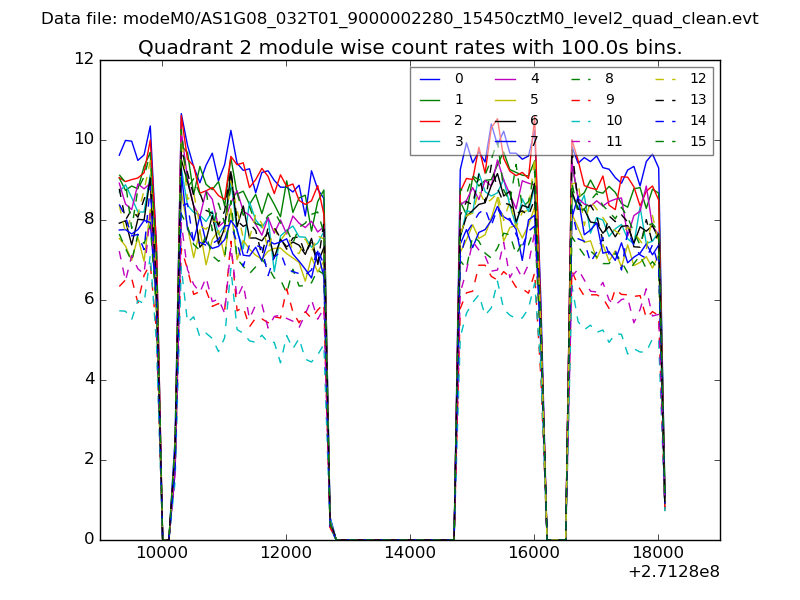
| Module-wise count rates for Quadrant C Data is divided into 100 sec bins |
 |
 |
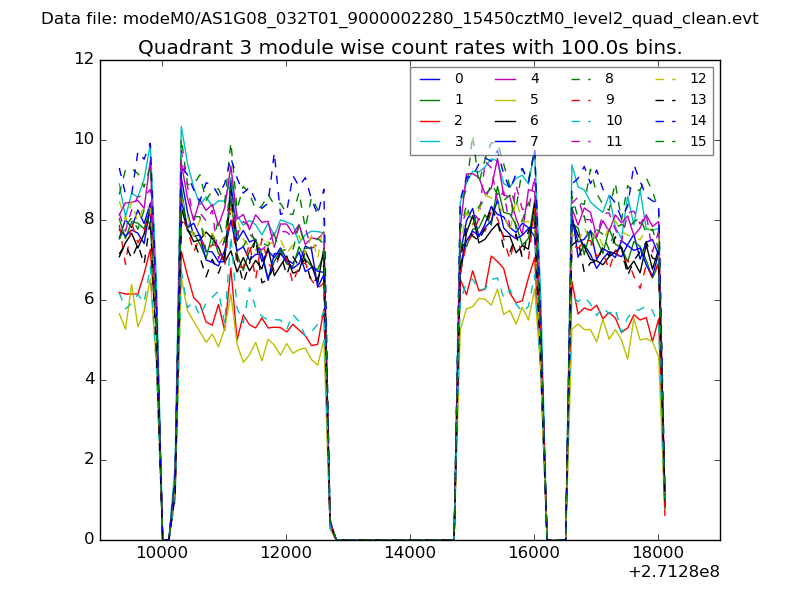
| Module-wise count rates for Quadrant D Data is divided into 100 sec bins |
 |
 |
| Parameter | Plot |
|---|---|
| CZT HV Monitor | 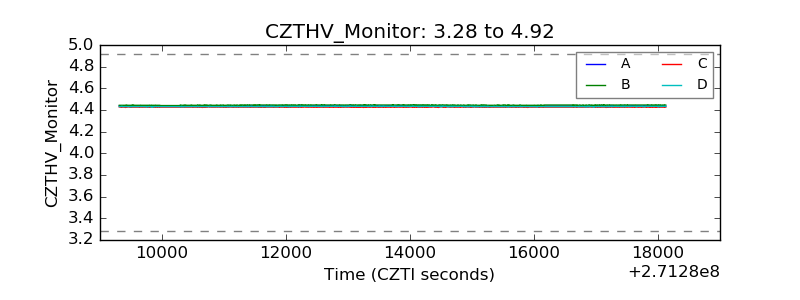 |
| D_VDD | 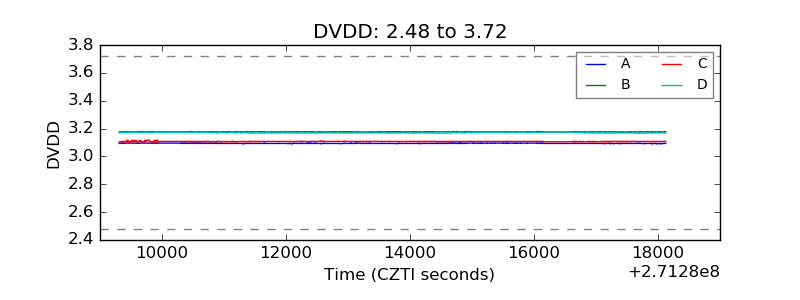 |
| Temperature 1 | 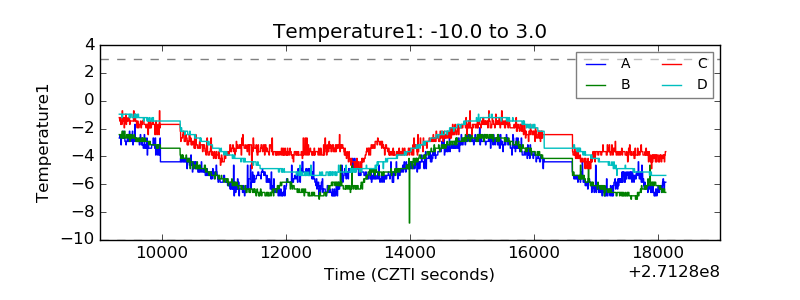 |
| Veto HV Monitor | 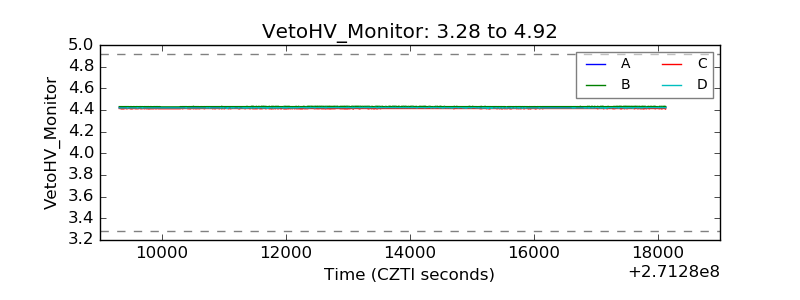 |
| Veto LLD | 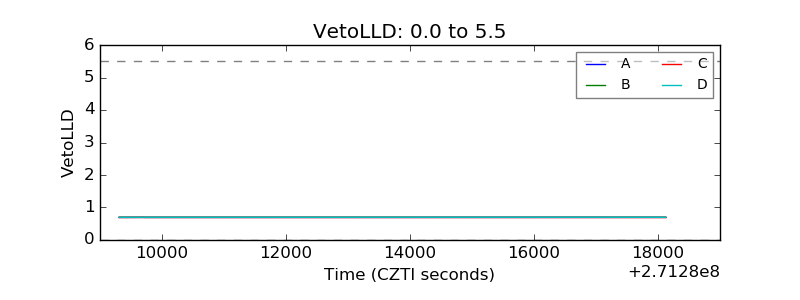 |
| Alpha Counter | 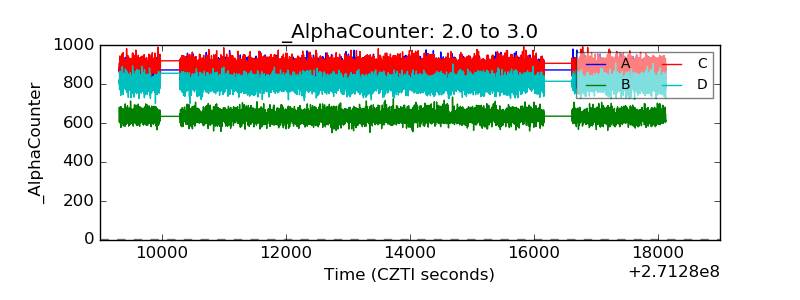 |
| _CPM_Rate |  |
| CZT Counter | 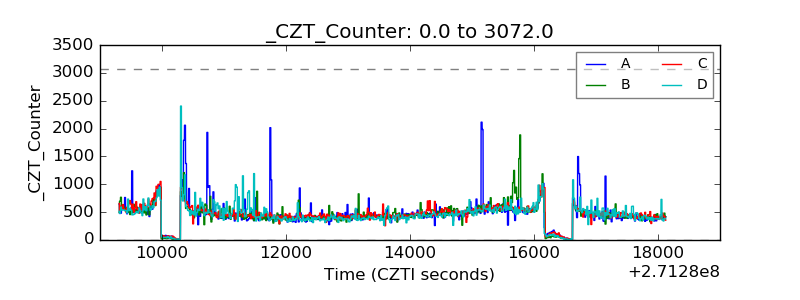 |
| +2.5 Volts monitor |  |
| +5 Volts monitor |  |
| _ROLL_ROT | 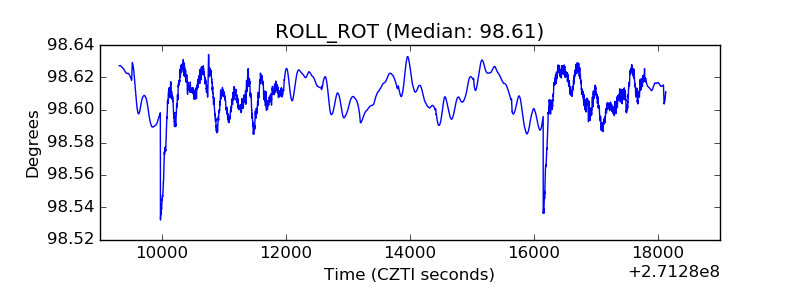 |
| _Roll_DEC |  |
| _Roll_RA | 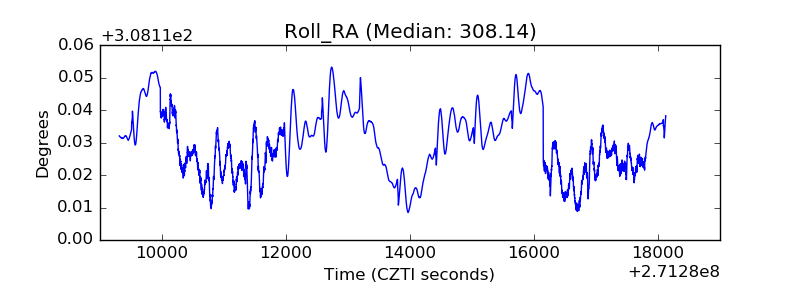 |
| Veto Counter | 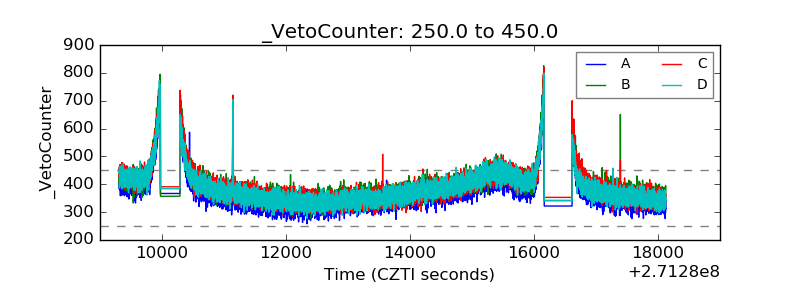 |