| Param | Original file | Final file |
|---|---|---|
| Filename | modeM0/AS1G08_032T01_9000002280_15452cztM0_level2.evt | modeM0/AS1G08_032T01_9000002280_15452cztM0_level2_quad_clean.evt |
| Size (bytes) | 868,112,640 | 169,649,280 |
| Size | 827.9 MB | 161.8 MB |
| Events in quadrant A | 6,205,723 | 1,066,612 |
| Events in quadrant B | 6,319,433 | 1,083,413 |
| Events in quadrant C | 6,649,109 | 1,060,196 |
| Events in quadrant D | 6,226,343 | 1,019,612 |
| Mode SS | |||
|---|---|---|---|
| Quadrant | BADHDUFLAG | Total packets | Discarded packets |
| A | 0 | 268 | 0 |
| B | 0 | 268 | 0 |
| C | 0 | 268 | 0 |
| D | 0 | 268 | 0 |
| Mode M9 | |||
|---|---|---|---|
| Quadrant | BADHDUFLAG | Total packets | Discarded packets |
| A | 0 | 19 | 0 |
| B | 0 | 19 | 0 |
| C | 0 | 19 | 0 |
| D | 0 | 19 | 0 |
| Mode M0 | |||
|---|---|---|---|
| Quadrant | BADHDUFLAG | Total packets | Discarded packets |
| A | 0 | 27449 | 4 |
| B | 0 | 27603 | 3 |
| C | 0 | 27852 | 3 |
| D | 0 | 27899 | 3 |
| Quadrant | Total seconds | Saturated seconds | Saturation percentage |
|---|---|---|---|
| A | 13146 | 142 | 1.080176% |
| B | 13146 | 149 | 1.133425% |
| C | 13146 | 76 | 0.578123% |
| D | 13146 | 113 | 0.859577% |
Noise dominated data is calculated using 1-second bins in cleaned event files. If a bin has >2000 counts, and if more than 50% of those come from <1% of pixels, then it is considered to be noise-dominated and hence unusable.
| Quadrant | # 1 sec bins | Bins with >0 counts | Bins with >2000 counts | High rate bins dominated by noise | Noise dominated (total time) | Noise dominated (detector-on time) | Marked lightcurve |
|---|---|---|---|---|---|---|---|
| A | 14982 | 13150 | 16 | 16 | 0.11% | 0.12% | 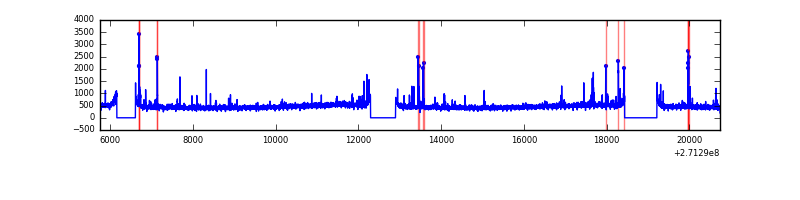 |
| B | 14982 | 13150 | 6 | 6 | 0.04% | 0.05% | 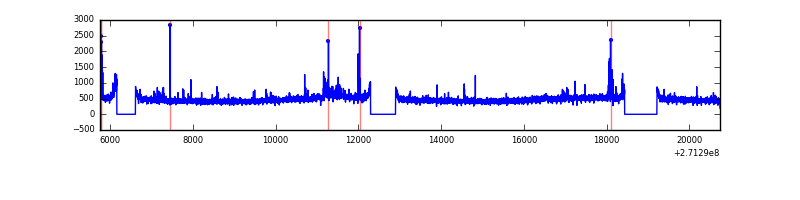 |
| C | 14982 | 13150 | 5 | 5 | 0.03% | 0.04% | 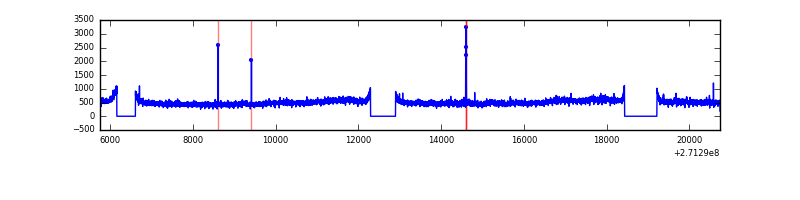 |
| D | 14982 | 13150 | 49 | 49 | 0.33% | 0.37% | 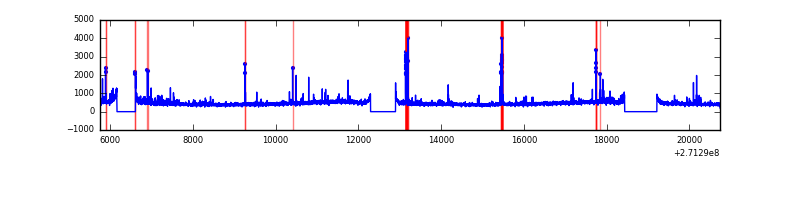 |
Top three noisy pixels from each quadrant. If the there are fewer than three noisy pixels in the level2.evt file, extra rows are filled as -1
| Pixel properties | Quadrant properties | ||||||
|---|---|---|---|---|---|---|---|
| Quadrant | DetID | PixID | Counts | Sigma | Mean | Median | Sigma |
| A | 14 | 238 | 158445 | 506.13 | 1548 | 1514 | 310.1 |
| A | 14 | 237 | 48608 | 151.89 | 1548 | 1514 | 310.1 |
| A | 9 | 143 | 34480 | 106.32 | 1548 | 1514 | 310.1 |
| B | 4 | 142 | 77969 | 258.3 | 1554 | 1515 | 296.0 |
| B | 0 | 229 | 43738 | 142.65 | 1554 | 1515 | 296.0 |
| B | 12 | 111 | 36012 | 116.55 | 1554 | 1515 | 296.0 |
| C | 3 | 233 | 649192 | 1854.38 | 1510 | 1519 | 349.3 |
| C | 4 | 206 | 50988 | 141.64 | 1510 | 1519 | 349.3 |
| C | 9 | 54 | 29474 | 80.04 | 1510 | 1519 | 349.3 |
| D | 5 | 222 | 159720 | 432.82 | 1507 | 1462 | 365.6 |
| D | 10 | 70 | 155012 | 419.95 | 1507 | 1462 | 365.6 |
| D | 1 | 52 | 53760 | 143.03 | 1507 | 1462 | 365.6 |
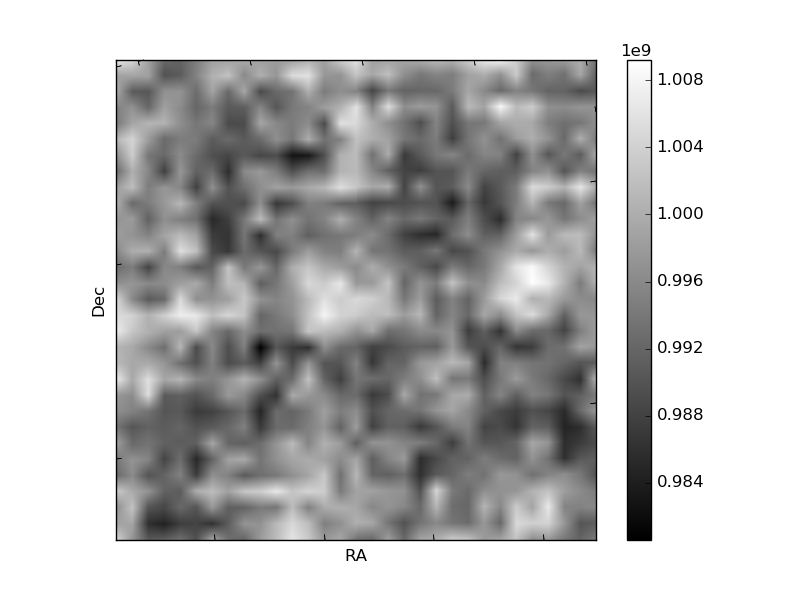
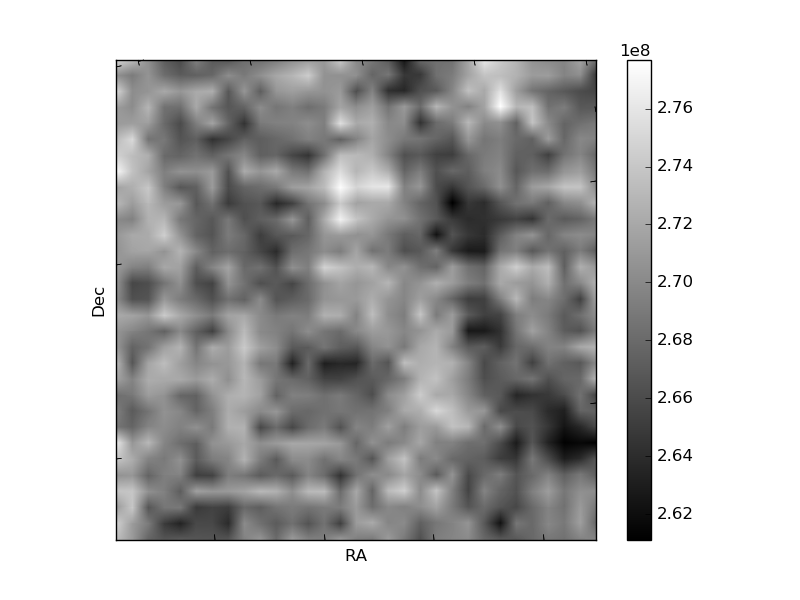
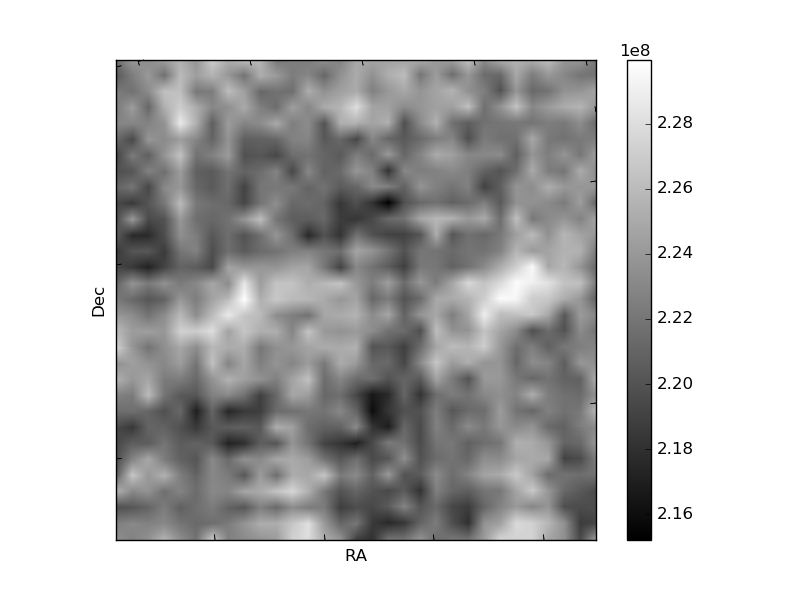
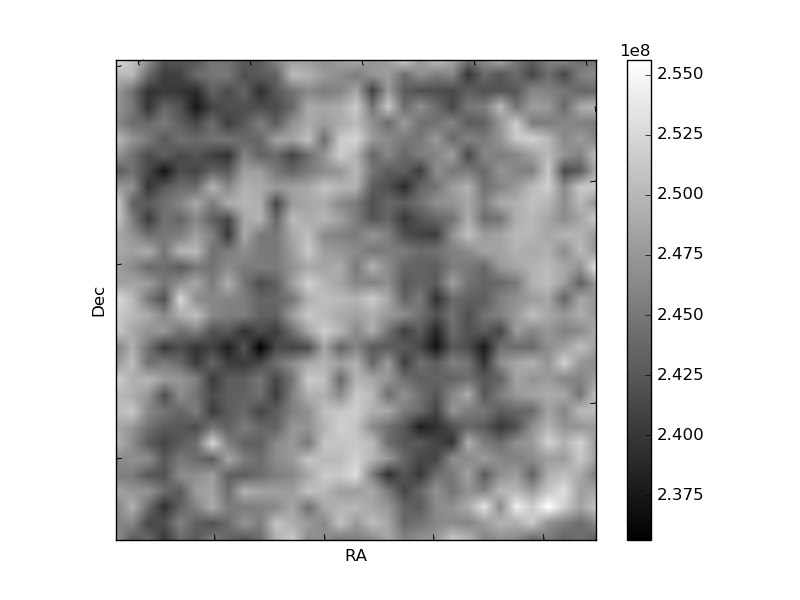
Histogram calculated using DETX and DETY for each event in the final _common_clean file
| Quadrant A | 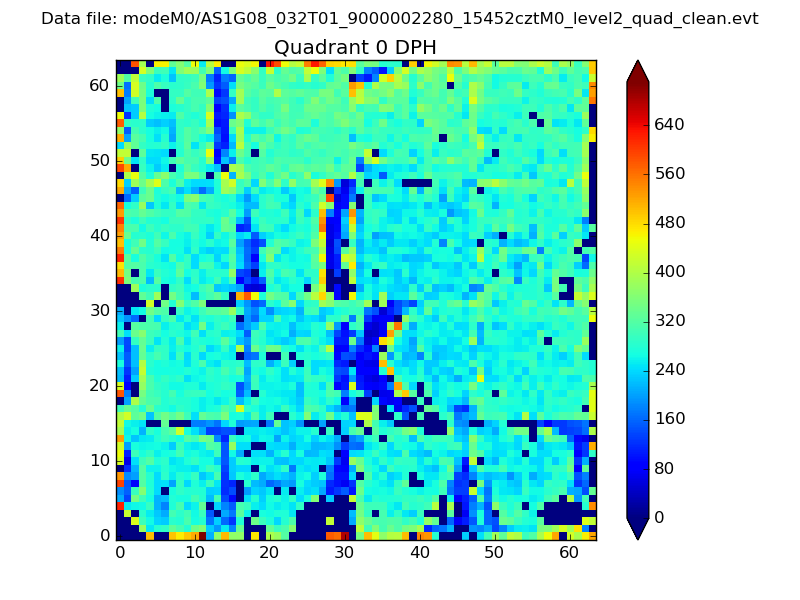 |
 |
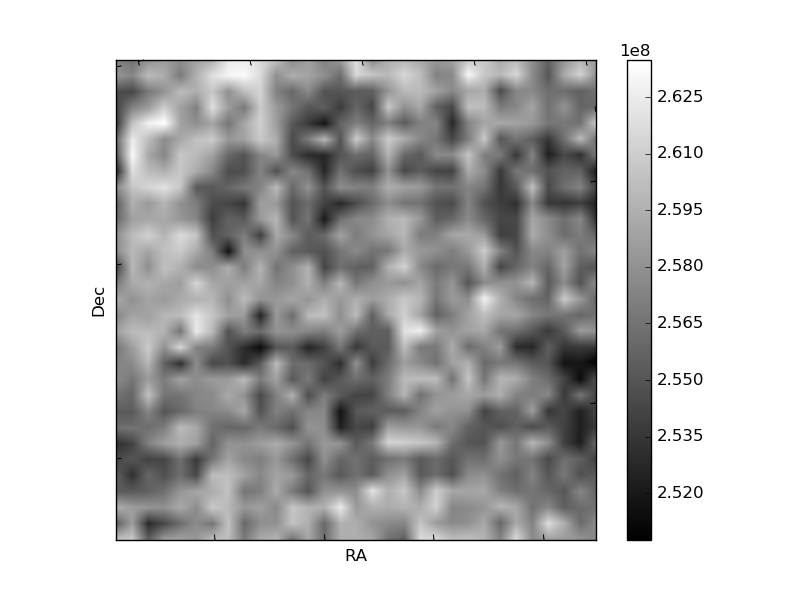
Quadrant B |
|---|---|---|---|
| Quadrant D | 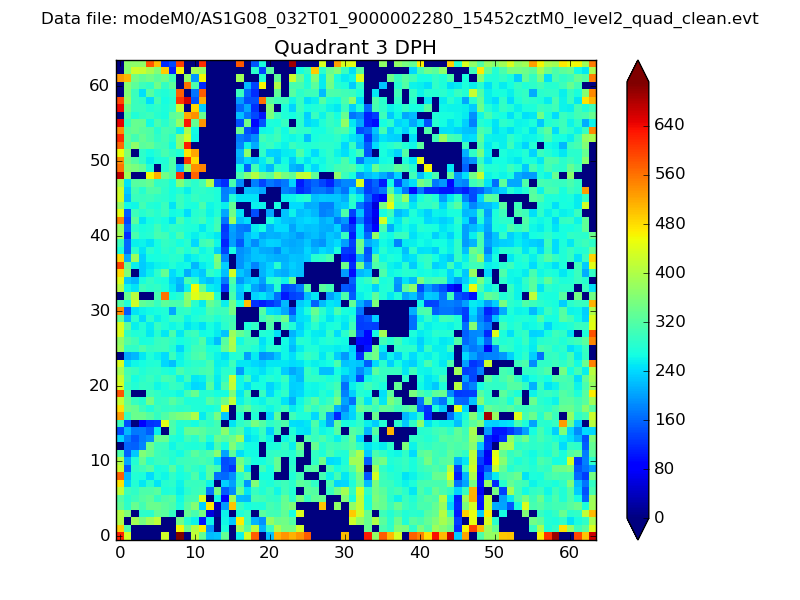 |
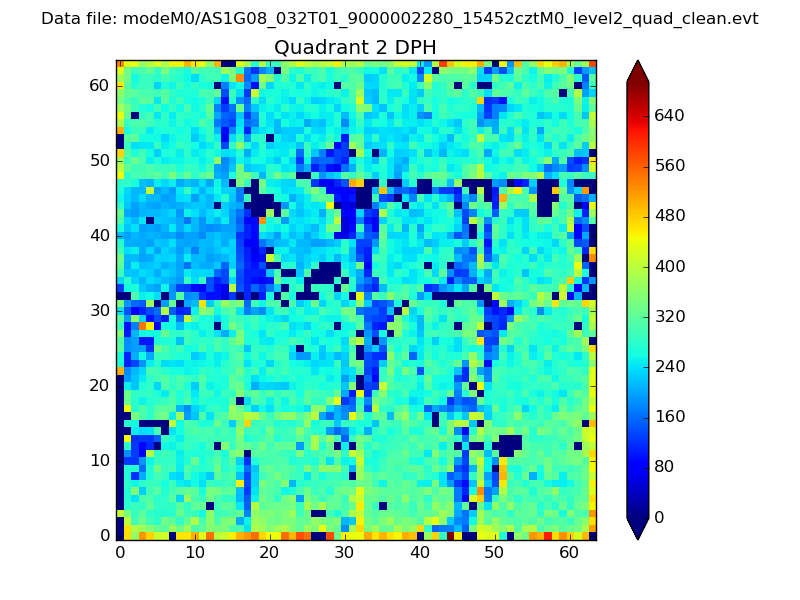 |
Quadrant C |
| Plot type | Count rate plots | Images |
|---|---|---|
| Comparison with Poisson distribution Blue bars denote a histogram of data divided into 1 sec bins. Red curve is a Poisson curve with rate = median count rate of data. |
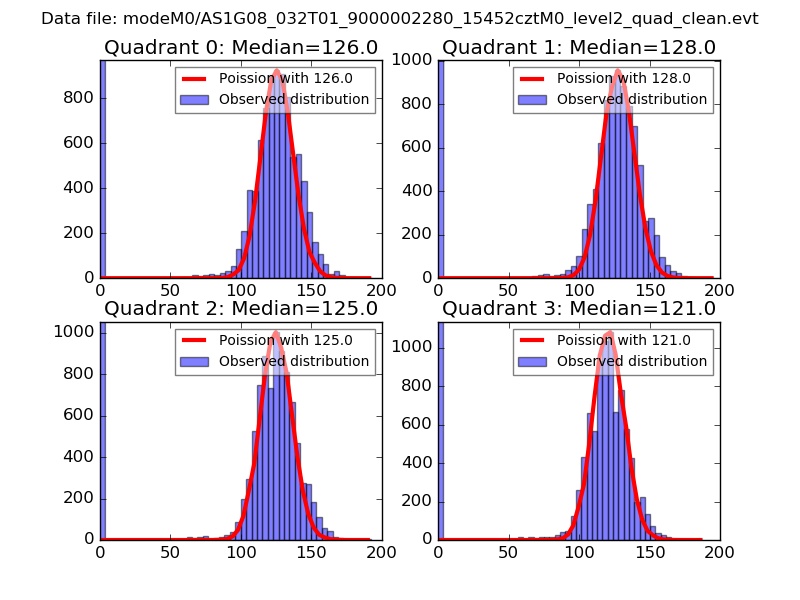 |
 |
| Quadrant-wise count rates Data is divided into 100 sec bins |
 |
|
| Module-wise count rates for Quadrant A Data is divided into 100 sec bins |
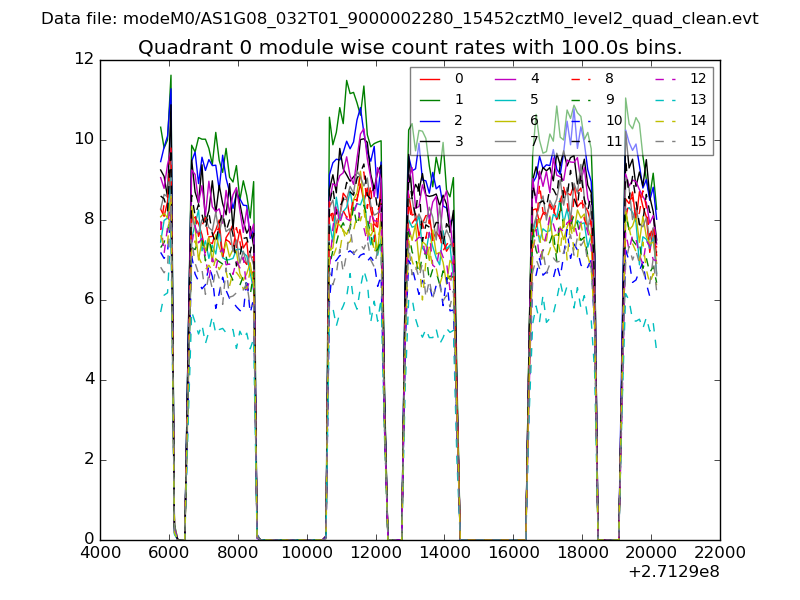 |
 |
| Module-wise count rates for Quadrant B Data is divided into 100 sec bins |
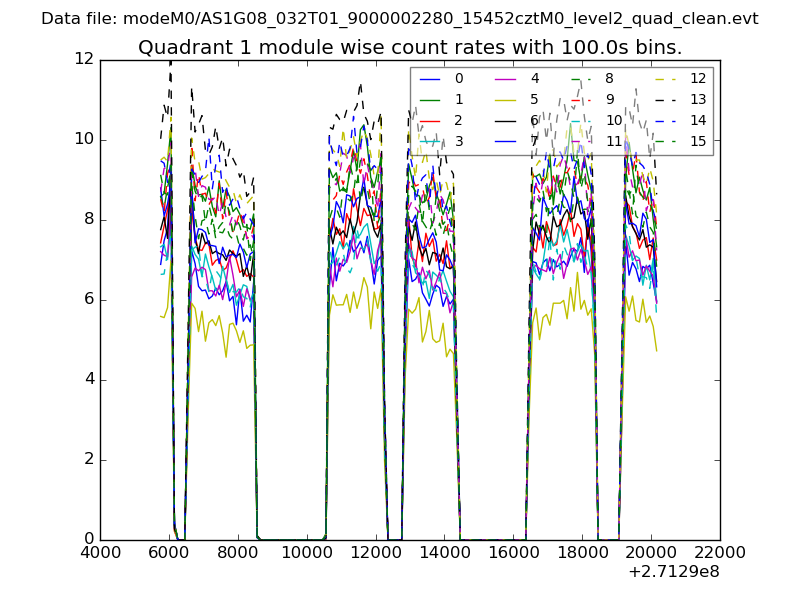 |
 |
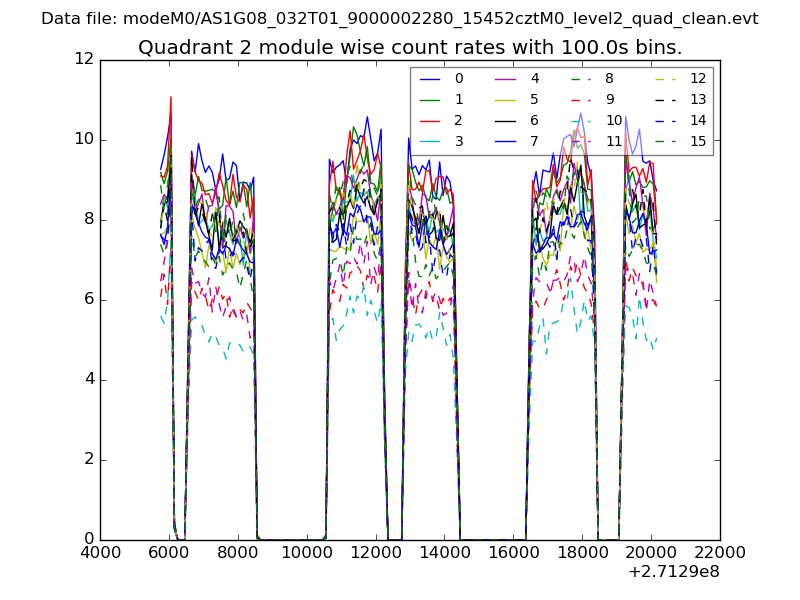
| Module-wise count rates for Quadrant C Data is divided into 100 sec bins |
 |
 |
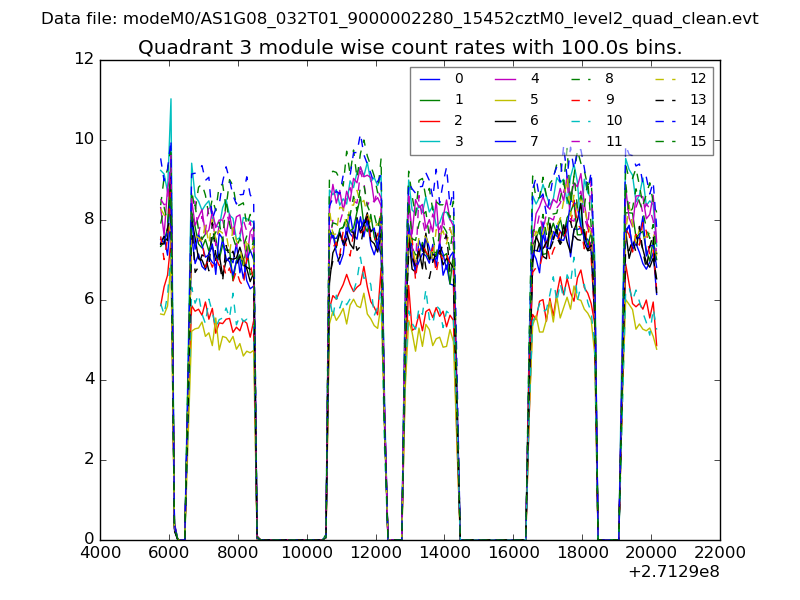
| Module-wise count rates for Quadrant D Data is divided into 100 sec bins |
 |
 |
| Parameter | Plot |
|---|---|
| CZT HV Monitor | 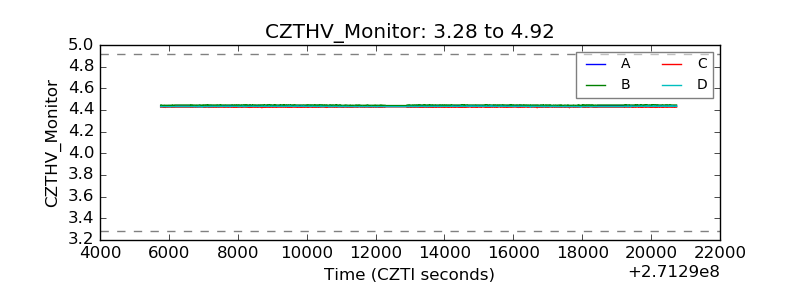 |
| D_VDD | 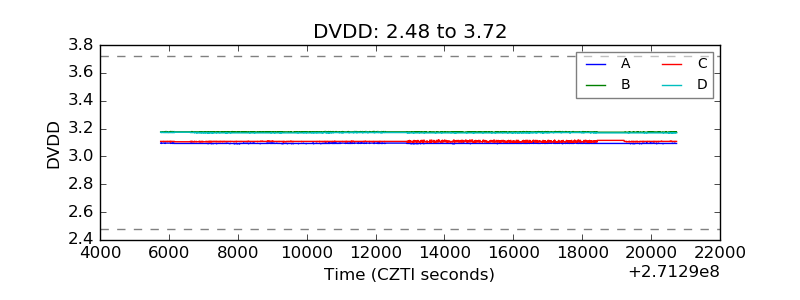 |
| Temperature 1 | 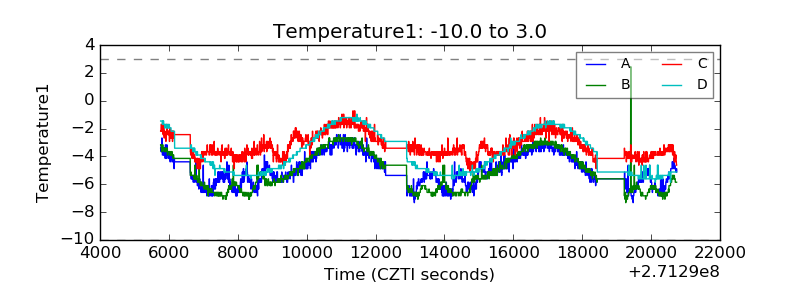 |
| Veto HV Monitor | 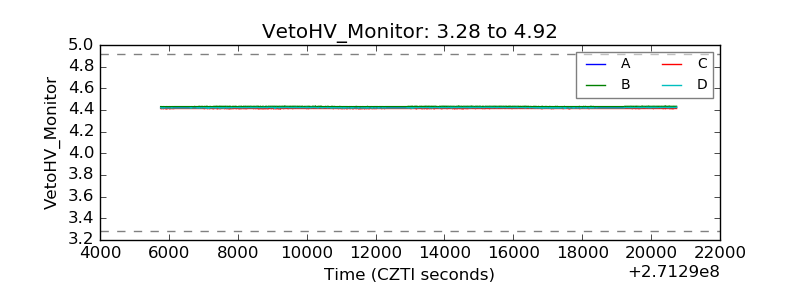 |
| Veto LLD | 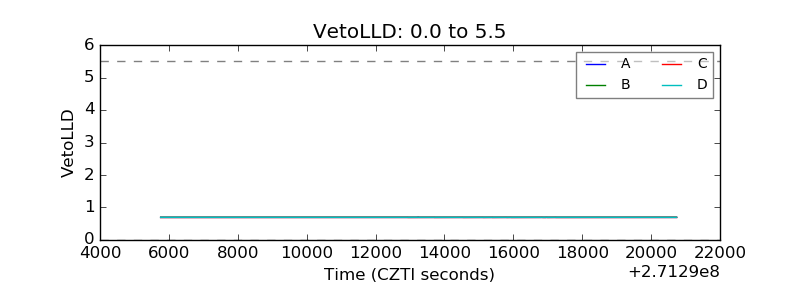 |
| Alpha Counter | 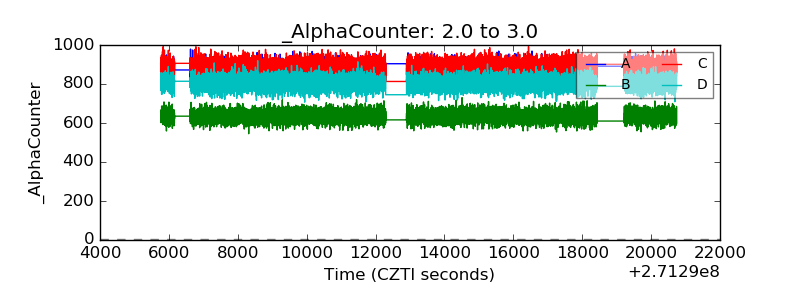 |
| _CPM_Rate | 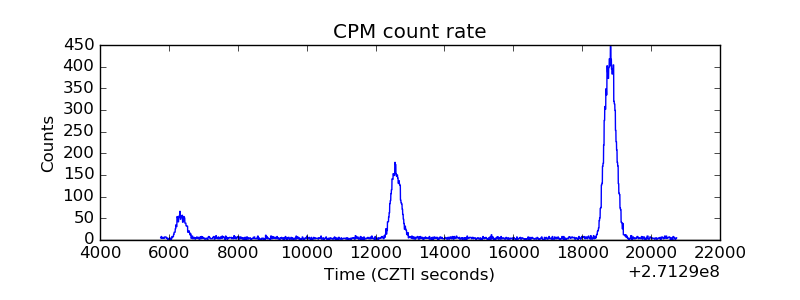 |
| CZT Counter | 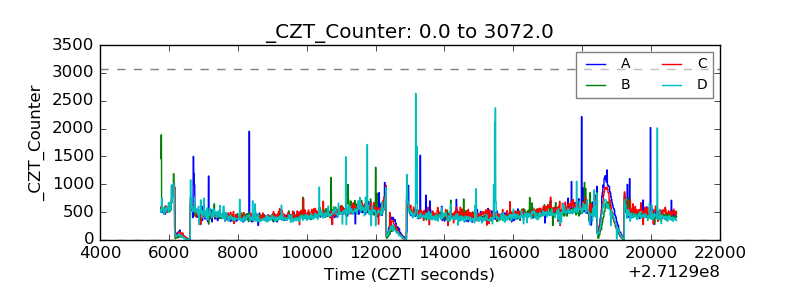 |
| +2.5 Volts monitor |  |
| +5 Volts monitor |  |
| _ROLL_ROT | 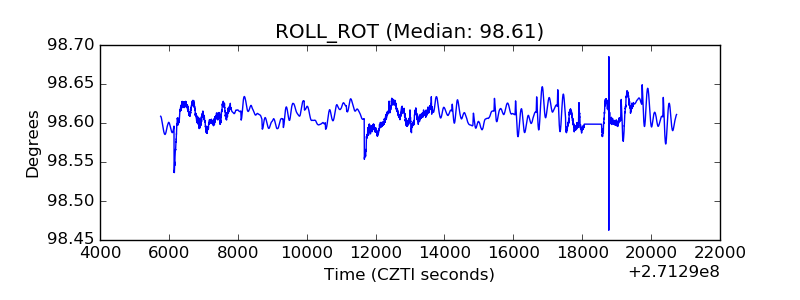 |
| _Roll_DEC | 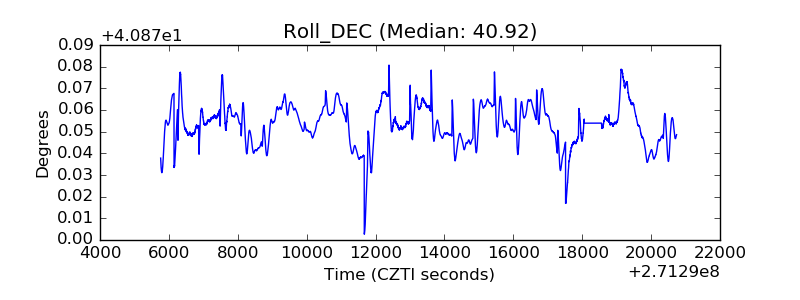 |
| _Roll_RA | 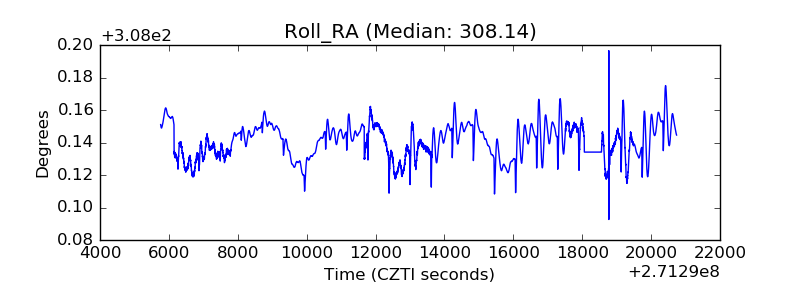 |
| Veto Counter | 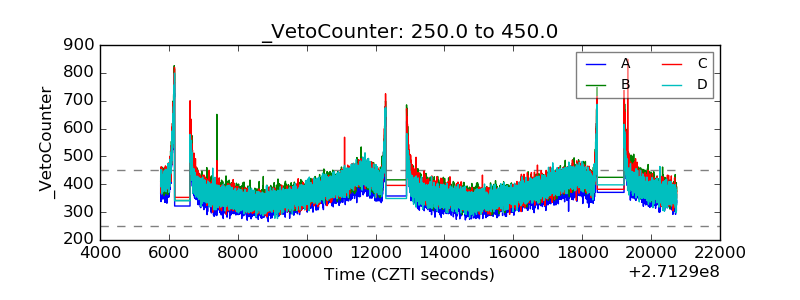 |