| Param | Original file | Final file |
|---|---|---|
| Filename | modeM0/AS1G08_032T01_9000002280_15453cztM0_level2.evt | modeM0/AS1G08_032T01_9000002280_15453cztM0_level2_quad_clean.evt |
| Size (bytes) | 496,293,120 | 87,482,880 |
| Size | 473.3 MB | 83.4 MB |
| Events in quadrant A | 3,518,952 | 545,144 |
| Events in quadrant B | 3,399,895 | 558,139 |
| Events in quadrant C | 3,924,274 | 541,015 |
| Events in quadrant D | 3,711,482 | 516,922 |
| Mode SS | |||
|---|---|---|---|
| Quadrant | BADHDUFLAG | Total packets | Discarded packets |
| A | 0 | 144 | 0 |
| B | 0 | 144 | 0 |
| C | 0 | 144 | 0 |
| D | 0 | 144 | 0 |
| Mode M9 | |||
|---|---|---|---|
| Quadrant | BADHDUFLAG | Total packets | Discarded packets |
| A | 0 | 18 | 0 |
| B | 0 | 18 | 0 |
| C | 0 | 18 | 0 |
| D | 0 | 18 | 0 |
| Mode M0 | |||
|---|---|---|---|
| Quadrant | BADHDUFLAG | Total packets | Discarded packets |
| A | 0 | 15055 | 3 |
| B | 0 | 14476 | 2 |
| C | 0 | 15643 | 2 |
| D | 0 | 15940 | 2 |
| Quadrant | Total seconds | Saturated seconds | Saturation percentage |
|---|---|---|---|
| A | 7002 | 157 | 2.242217% |
| B | 7002 | 116 | 1.656670% |
| C | 7002 | 109 | 1.556698% |
| D | 7002 | 154 | 2.199372% |
Noise dominated data is calculated using 1-second bins in cleaned event files. If a bin has >2000 counts, and if more than 50% of those come from <1% of pixels, then it is considered to be noise-dominated and hence unusable.
| Quadrant | # 1 sec bins | Bins with >0 counts | Bins with >2000 counts | High rate bins dominated by noise | Noise dominated (total time) | Noise dominated (detector-on time) | Marked lightcurve |
|---|---|---|---|---|---|---|---|
| A | 8708 | 7004 | 26 | 26 | 0.30% | 0.37% | 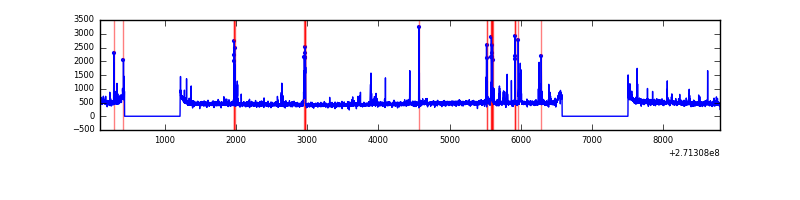 |
| B | 8708 | 7004 | 1 | 1 | 0.01% | 0.01% | 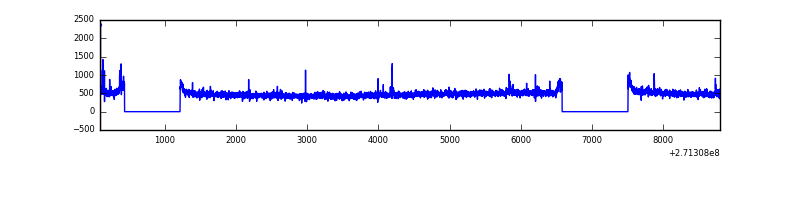 |
| C | 8708 | 7005 | 34 | 34 | 0.39% | 0.49% | 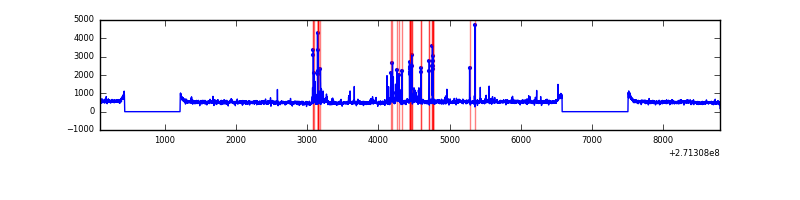 |
| D | 8708 | 7005 | 95 | 95 | 1.09% | 1.36% | 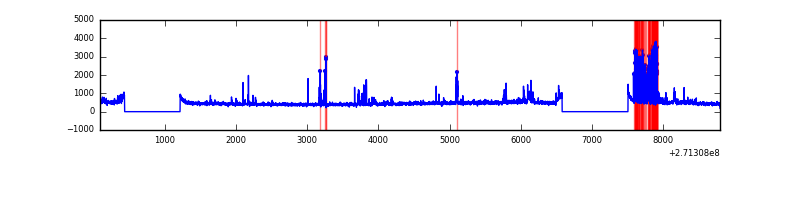 |
Top three noisy pixels from each quadrant. If the there are fewer than three noisy pixels in the level2.evt file, extra rows are filled as -1
| Pixel properties | Quadrant properties | ||||||
|---|---|---|---|---|---|---|---|
| Quadrant | DetID | PixID | Counts | Sigma | Mean | Median | Sigma |
| A | 14 | 238 | 192657 | 1125.22 | 844 | 825 | 170.5 |
| A | 14 | 237 | 71242 | 413.04 | 844 | 825 | 170.5 |
| A | 9 | 143 | 7612 | 39.81 | 844 | 825 | 170.5 |
| B | 0 | 213 | 20836 | 121.99 | 849 | 828 | 164.0 |
| B | 12 | 111 | 20025 | 117.04 | 849 | 828 | 164.0 |
| B | 0 | 214 | 17770 | 103.29 | 849 | 828 | 164.0 |
| C | 3 | 233 | 407865 | 2139.06 | 821 | 825 | 190.3 |
| C | 9 | 54 | 273892 | 1435.01 | 821 | 825 | 190.3 |
| C | 10 | 22 | 25550 | 129.93 | 821 | 825 | 190.3 |
| D | 1 | 52 | 460213 | 2285.91 | 819 | 792 | 201.0 |
| D | 5 | 222 | 71183 | 350.24 | 819 | 792 | 201.0 |
| D | 2 | 234 | 25933 | 125.09 | 819 | 792 | 201.0 |
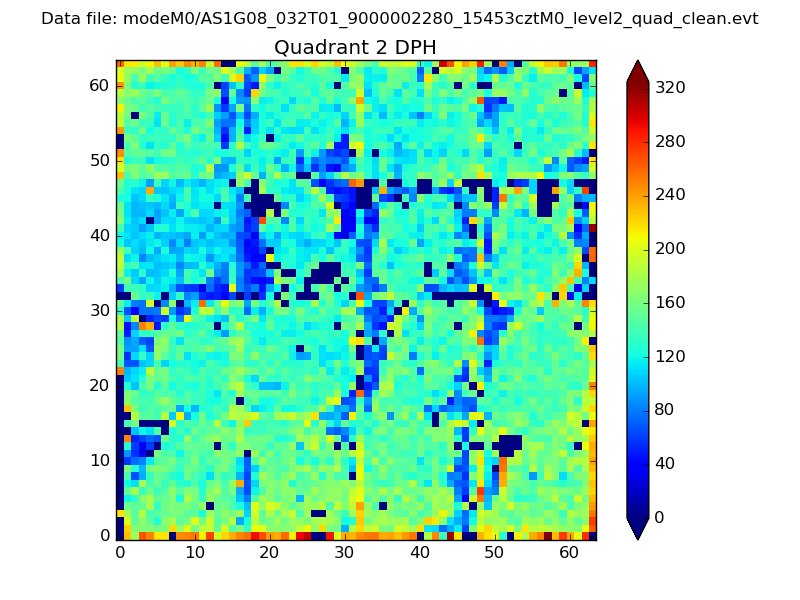
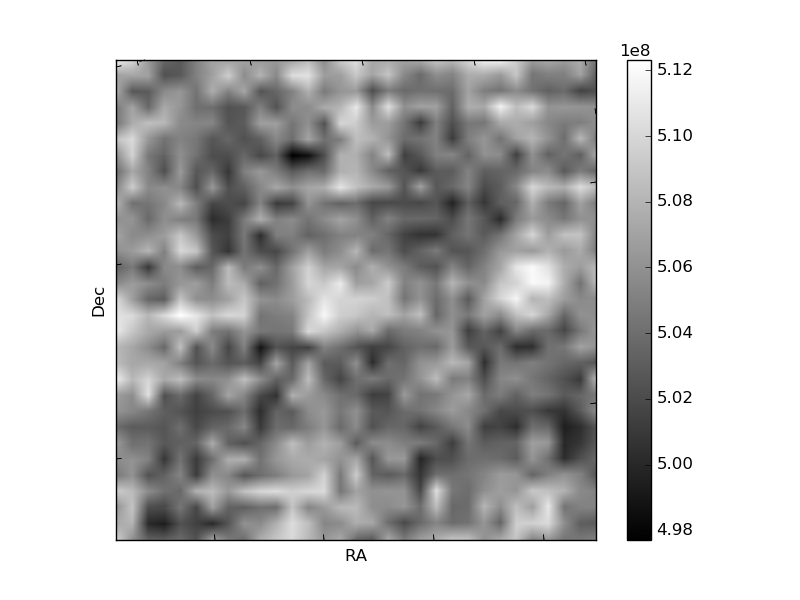
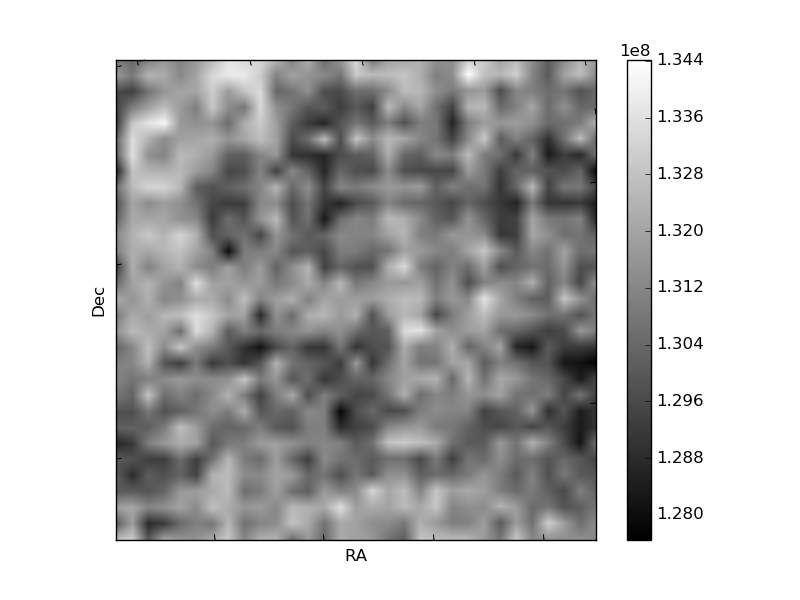
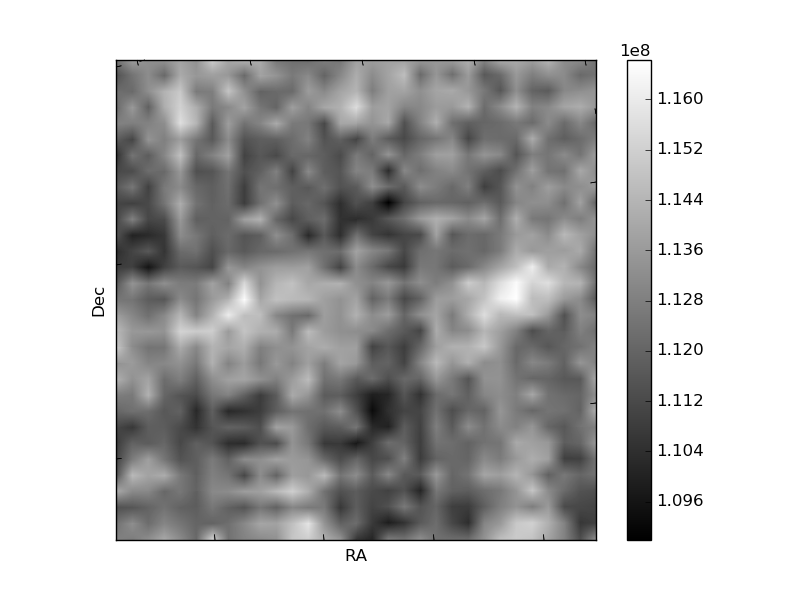
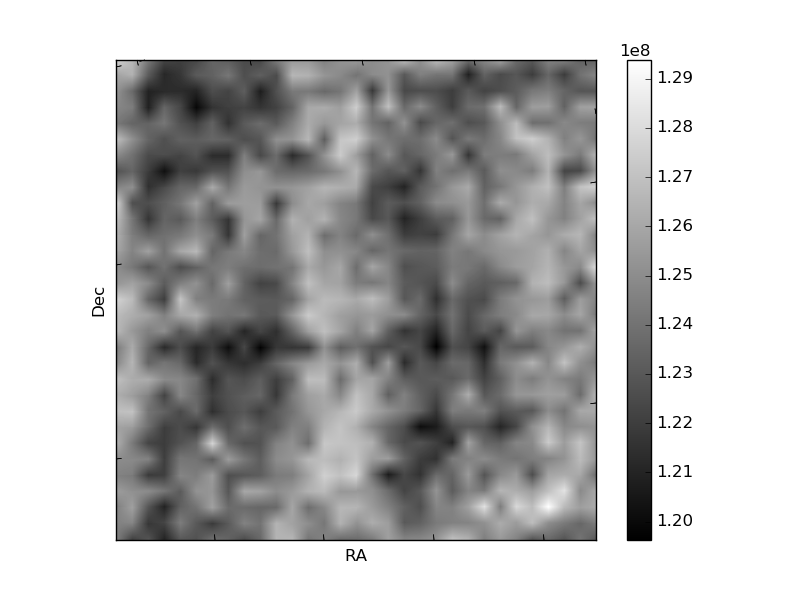
Histogram calculated using DETX and DETY for each event in the final _common_clean file
| Quadrant A | 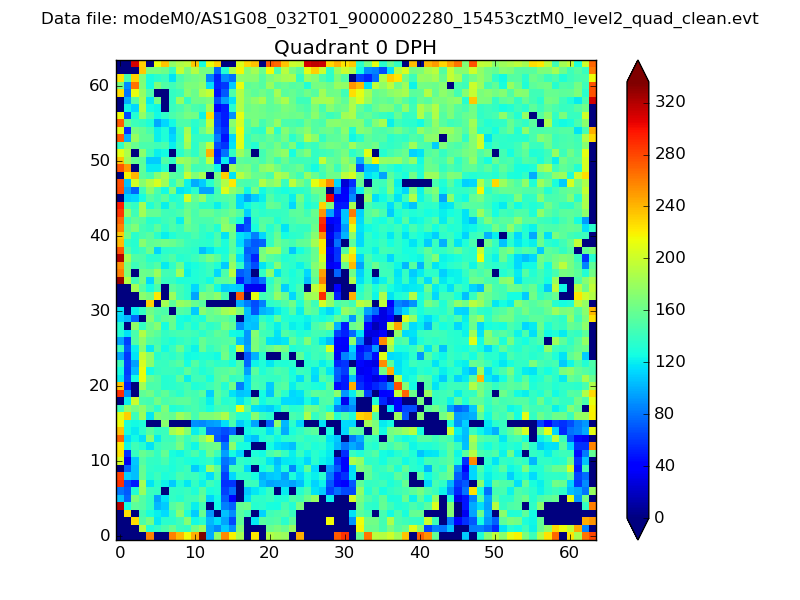 |
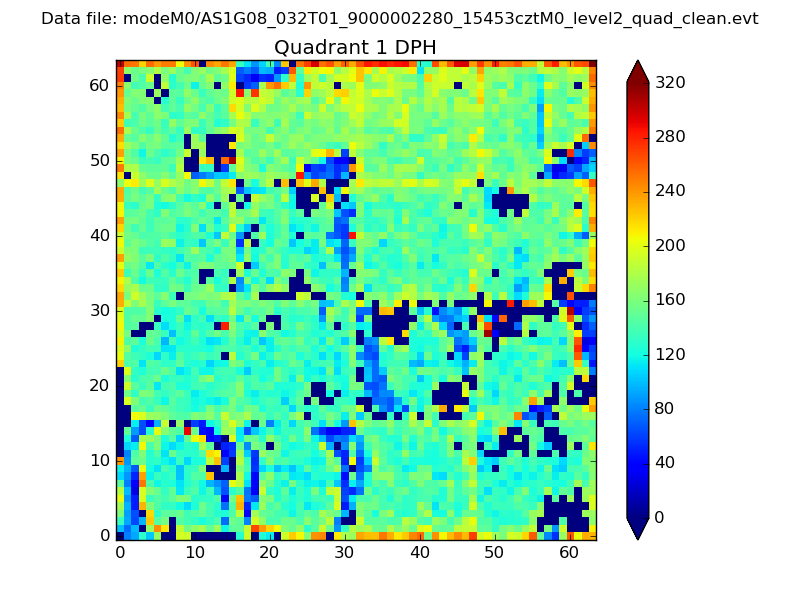 |
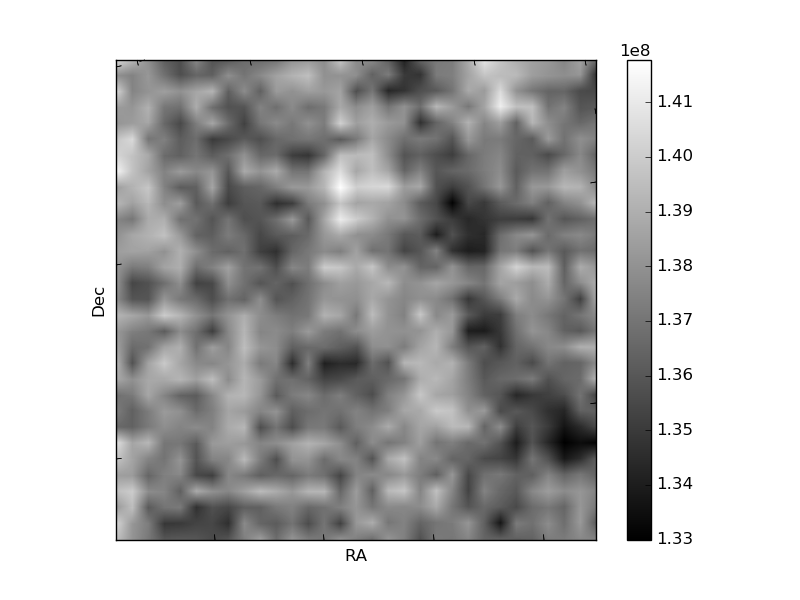
Quadrant B |
|---|---|---|---|
| Quadrant D | 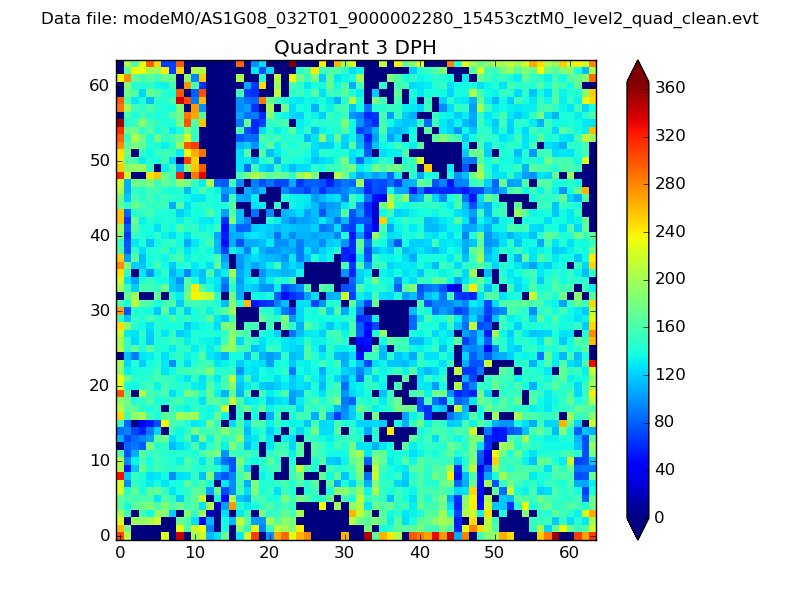 |
 |
Quadrant C |
| Plot type | Count rate plots | Images |
|---|---|---|
| Comparison with Poisson distribution Blue bars denote a histogram of data divided into 1 sec bins. Red curve is a Poisson curve with rate = median count rate of data. |
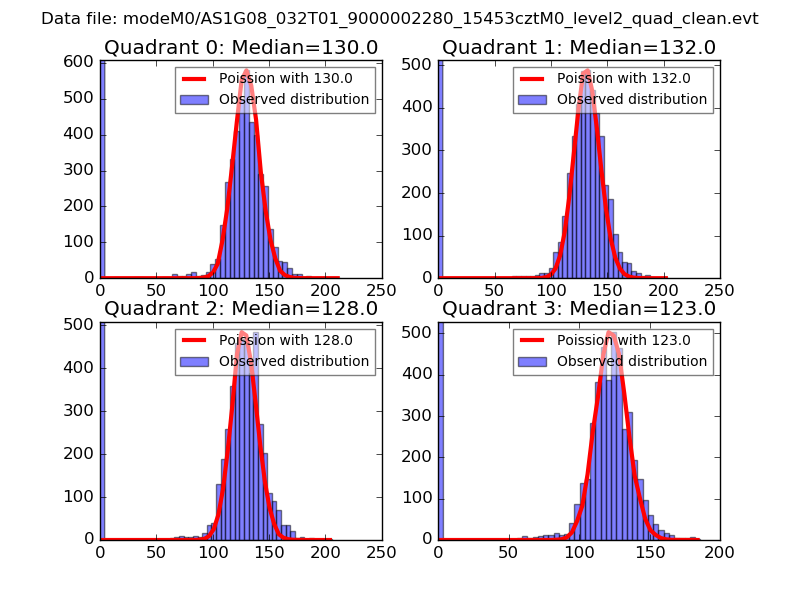 |
 |
| Quadrant-wise count rates Data is divided into 100 sec bins |
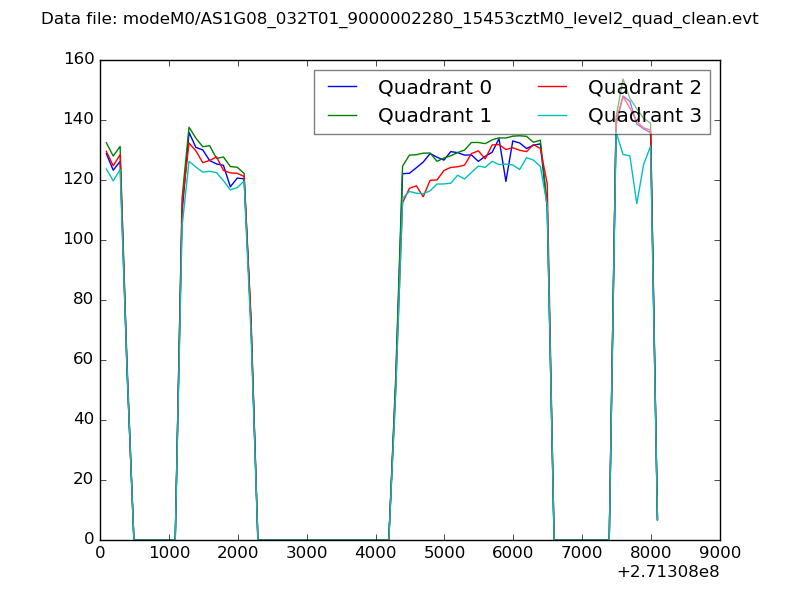 |
|
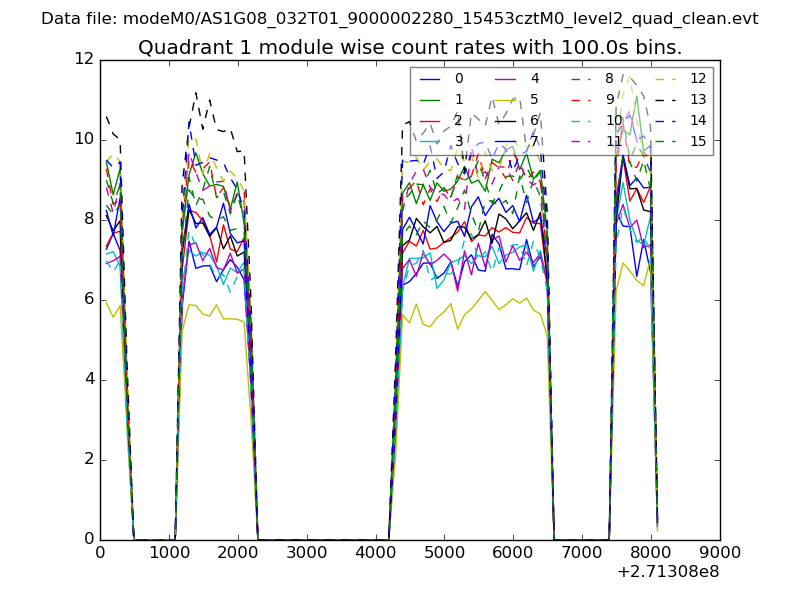
| Module-wise count rates for Quadrant A Data is divided into 100 sec bins |
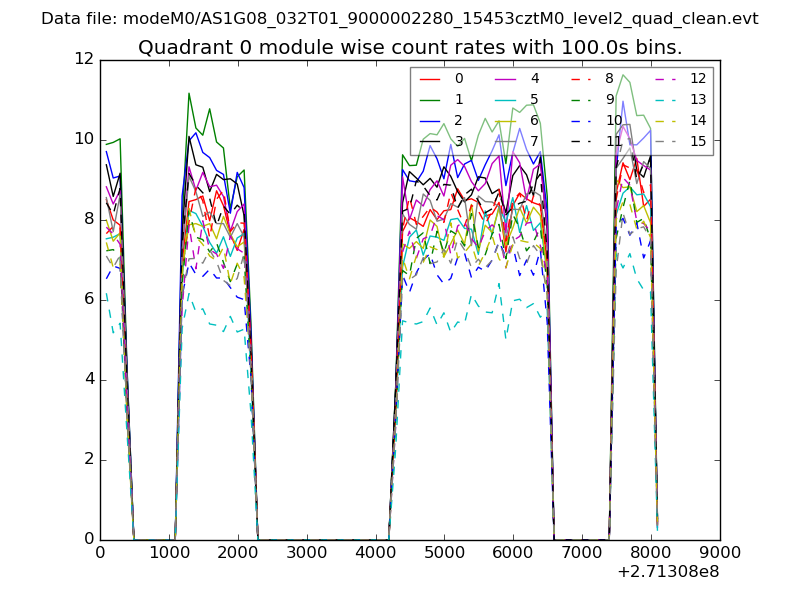 |
 |
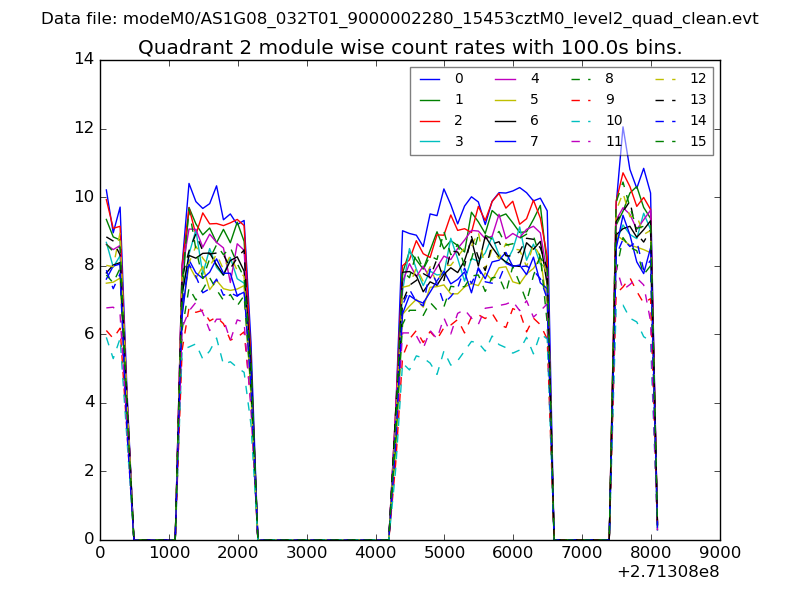
| Module-wise count rates for Quadrant B Data is divided into 100 sec bins |
 |
 |
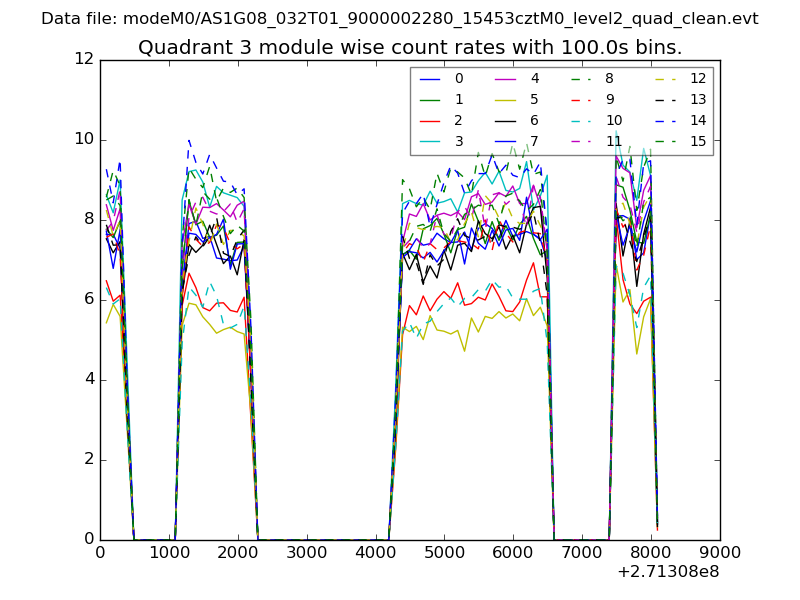
| Module-wise count rates for Quadrant C Data is divided into 100 sec bins |
 |
 |
| Module-wise count rates for Quadrant D Data is divided into 100 sec bins |
 |
 |
| Parameter | Plot |
|---|---|
| CZT HV Monitor | 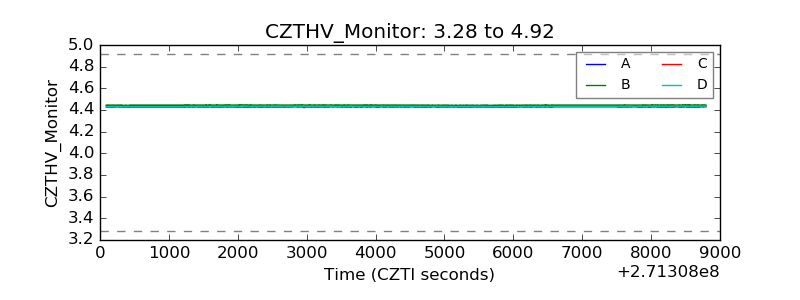 |
| D_VDD | 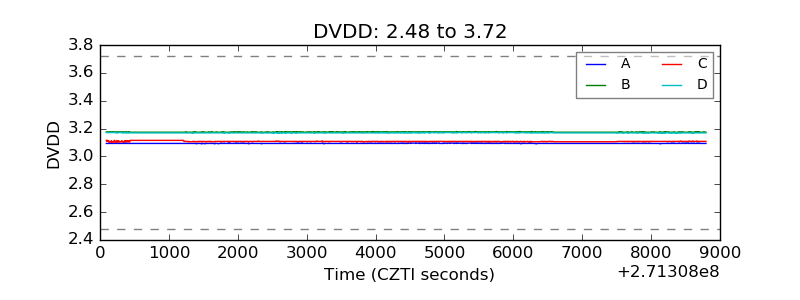 |
| Temperature 1 | 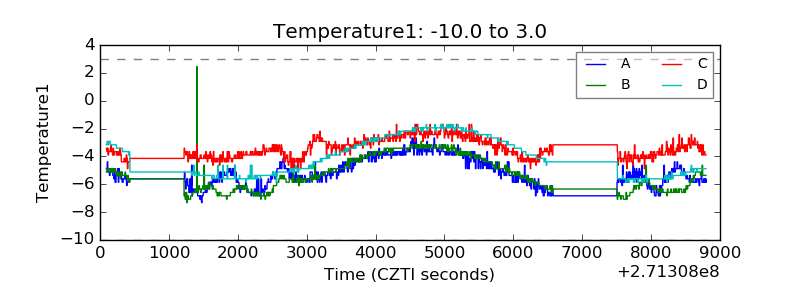 |
| Veto HV Monitor | 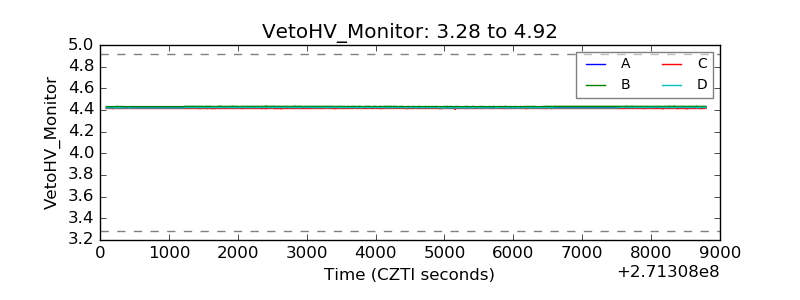 |
| Veto LLD | 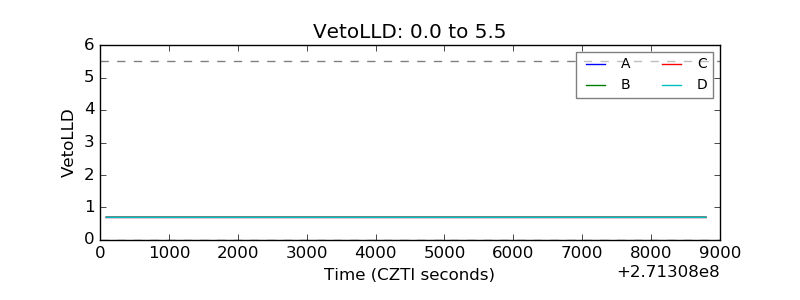 |
| Alpha Counter | 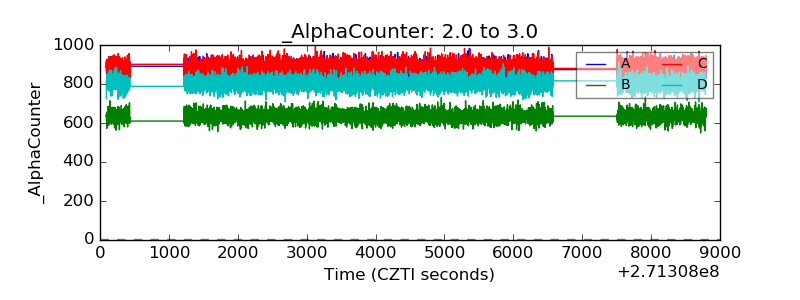 |
| _CPM_Rate | 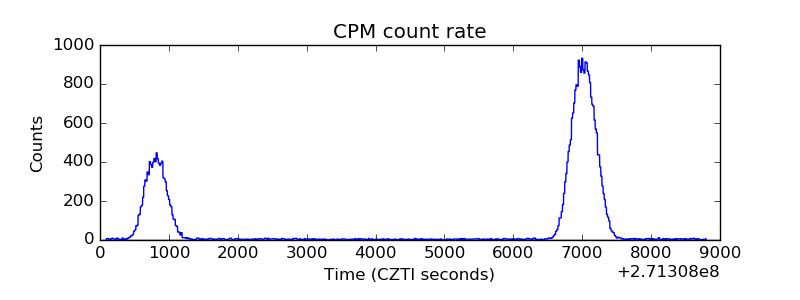 |
| CZT Counter | 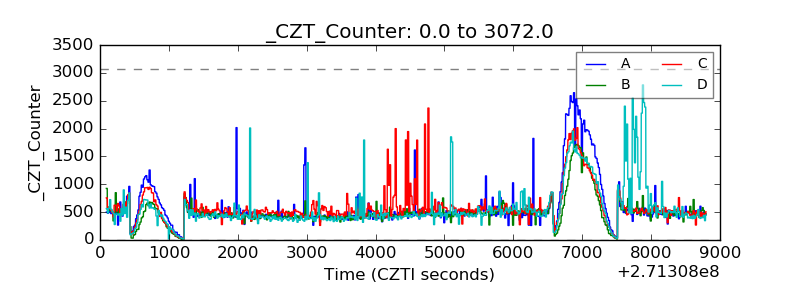 |
| +2.5 Volts monitor | 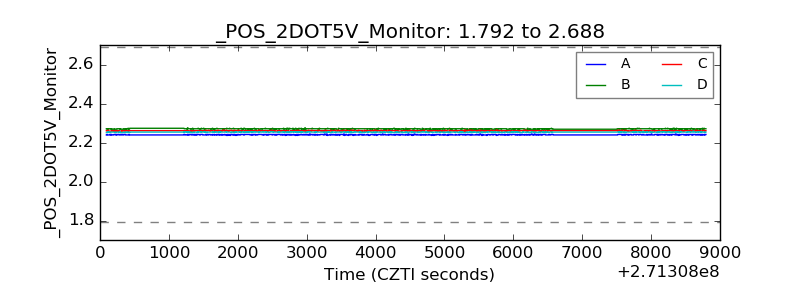 |
| +5 Volts monitor |  |
| _ROLL_ROT | 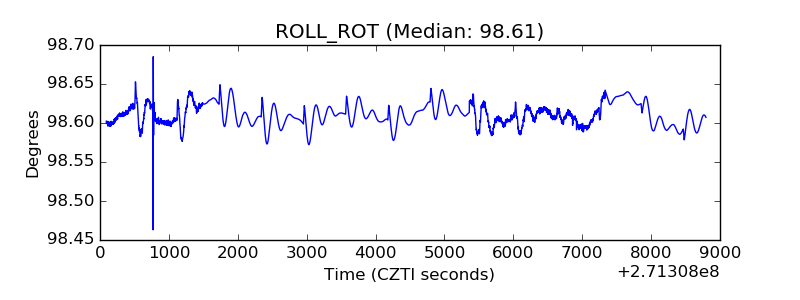 |
| _Roll_DEC | 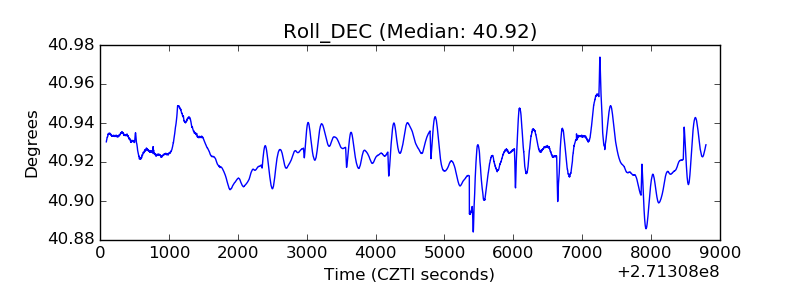 |
| _Roll_RA | 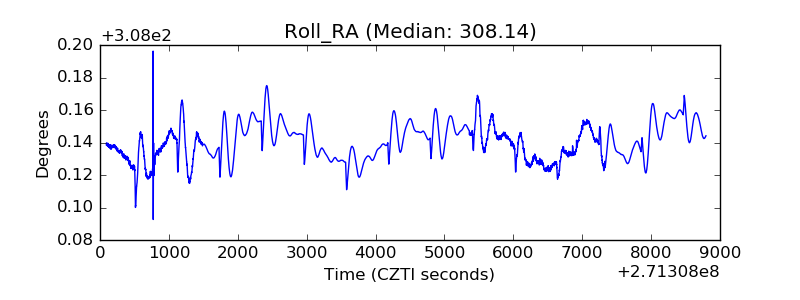 |
| Veto Counter | 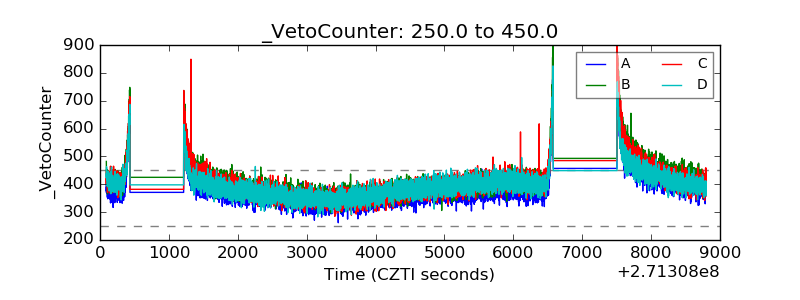 |