| Param | Original file | Final file |
|---|---|---|
| Filename | modeM0/AS1G08_032T01_9000002280_15454cztM0_level2.evt | modeM0/AS1G08_032T01_9000002280_15454cztM0_level2_quad_clean.evt |
| Size (bytes) | 298,215,360 | 44,467,200 |
| Size | 284.4 MB | 42.4 MB |
| Events in quadrant A | 1,978,381 | 269,560 |
| Events in quadrant B | 1,991,245 | 273,885 |
| Events in quadrant C | 2,034,083 | 262,487 |
| Events in quadrant D | 2,746,087 | 249,213 |
| Mode SS | |||
|---|---|---|---|
| Quadrant | BADHDUFLAG | Total packets | Discarded packets |
| A | 0 | 82 | 0 |
| B | 0 | 82 | 0 |
| C | 0 | 82 | 0 |
| D | 0 | 82 | 0 |
| Mode M9 | |||
|---|---|---|---|
| Quadrant | BADHDUFLAG | Total packets | Discarded packets |
| A | 0 | 4 | 0 |
| B | 0 | 4 | 0 |
| C | 0 | 4 | 0 |
| D | 0 | 5 | 0 |
| Mode M0 | |||
|---|---|---|---|
| Quadrant | BADHDUFLAG | Total packets | Discarded packets |
| A | 0 | 8551 | 1 |
| B | 0 | 8480 | 1 |
| C | 0 | 8460 | 1 |
| D | 0 | 10887 | 1 |
| Quadrant | Total seconds | Saturated seconds | Saturation percentage |
|---|---|---|---|
| A | 4129 | 30 | 0.726568% |
| B | 4129 | 24 | 0.581255% |
| C | 4129 | 10 | 0.242189% |
| D | 4129 | 138 | 3.342214% |
Noise dominated data is calculated using 1-second bins in cleaned event files. If a bin has >2000 counts, and if more than 50% of those come from <1% of pixels, then it is considered to be noise-dominated and hence unusable.
| Quadrant | # 1 sec bins | Bins with >0 counts | Bins with >2000 counts | High rate bins dominated by noise | Noise dominated (total time) | Noise dominated (detector-on time) | Marked lightcurve |
|---|---|---|---|---|---|---|---|
| A | 4130 | 4130 | 5 | 5 | 0.12% | 0.12% | 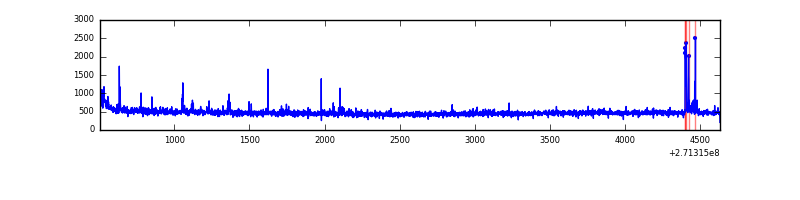 |
| B | 4130 | 4130 | 0 | 0 | 0.00% | 0.00% | 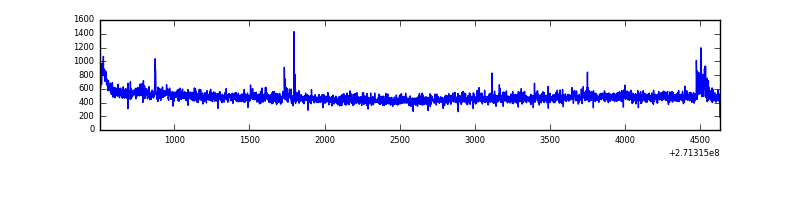 |
| C | 4130 | 4130 | 0 | 0 | 0.00% | 0.00% | 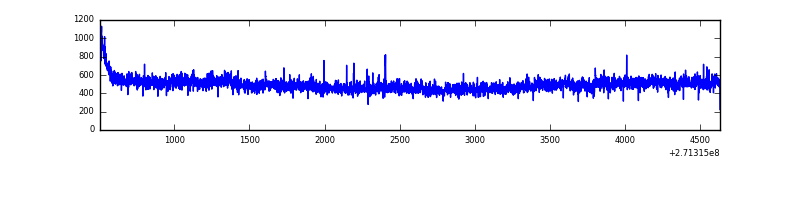 |
| D | 4130 | 4130 | 132 | 132 | 3.20% | 3.20% | 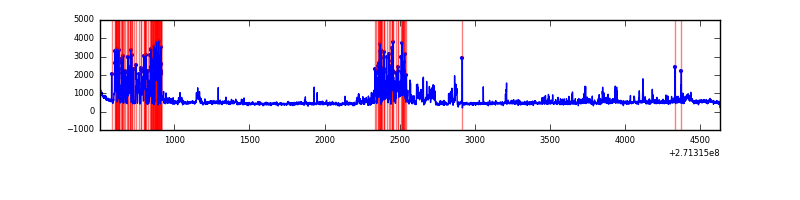 |
Top three noisy pixels from each quadrant. If the there are fewer than three noisy pixels in the level2.evt file, extra rows are filled as -1
| Pixel properties | Quadrant properties | ||||||
|---|---|---|---|---|---|---|---|
| Quadrant | DetID | PixID | Counts | Sigma | Mean | Median | Sigma |
| A | 14 | 238 | 47054 | 462.58 | 497 | 487 | 100.7 |
| A | 14 | 237 | 15602 | 150.15 | 497 | 487 | 100.7 |
| A | 9 | 143 | 5336 | 48.17 | 497 | 487 | 100.7 |
| B | 0 | 230 | 21378 | 217.25 | 495 | 483 | 96.2 |
| B | 0 | 189 | 14501 | 145.75 | 495 | 483 | 96.2 |
| B | 12 | 111 | 11412 | 113.63 | 495 | 483 | 96.2 |
| C | 3 | 233 | 164432 | 1496.87 | 475 | 479 | 109.5 |
| C | 7 | 220 | 9861 | 85.66 | 475 | 479 | 109.5 |
| C | 10 | 22 | 5074 | 41.95 | 475 | 479 | 109.5 |
| D | 5 | 222 | 501995 | 4322.66 | 473 | 459 | 116.0 |
| D | 1 | 52 | 415208 | 3574.66 | 473 | 459 | 116.0 |
| D | 2 | 234 | 14246 | 118.83 | 473 | 459 | 116.0 |
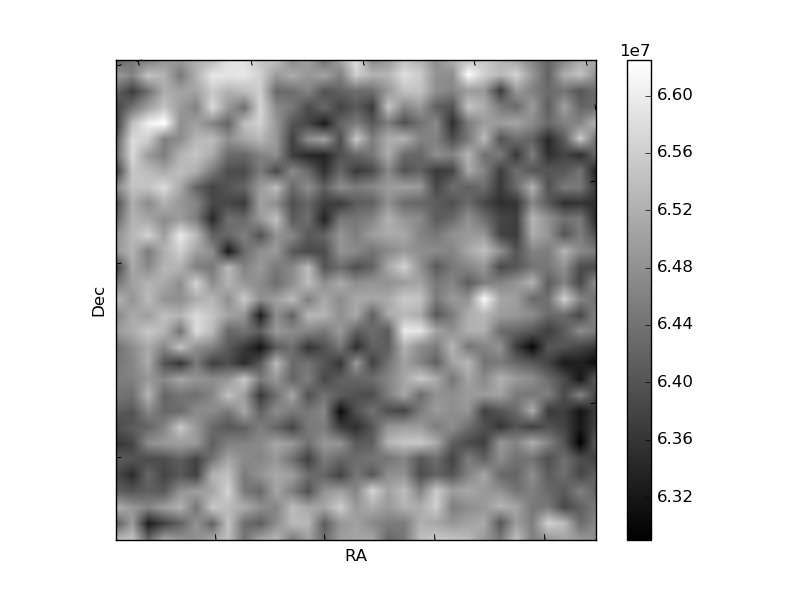
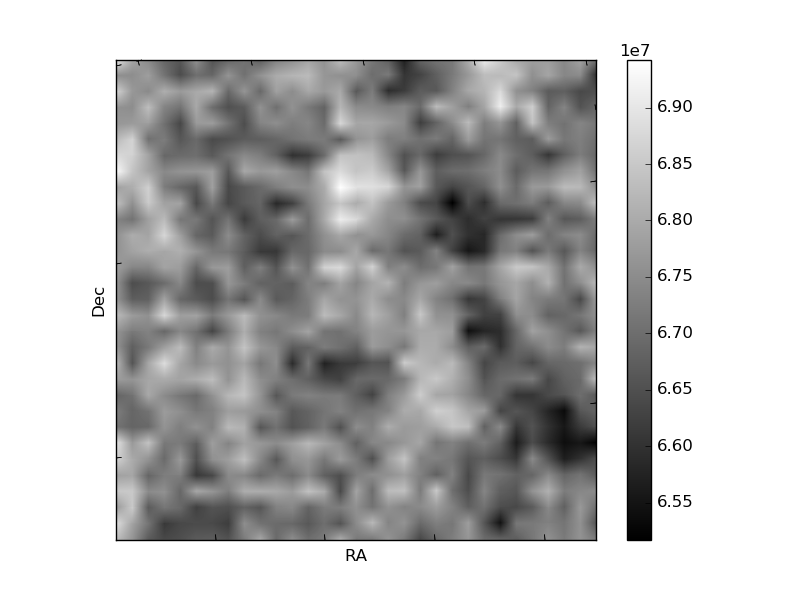
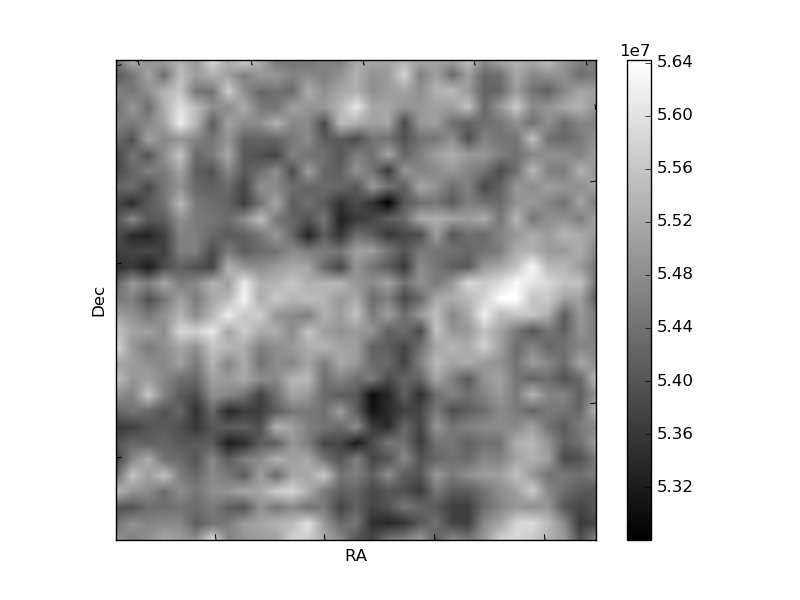
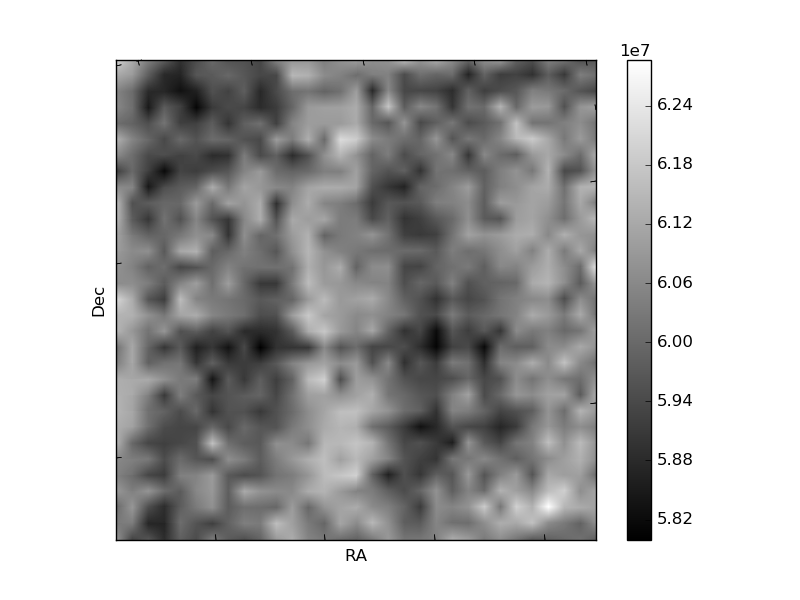
Histogram calculated using DETX and DETY for each event in the final _common_clean file
| Quadrant A | 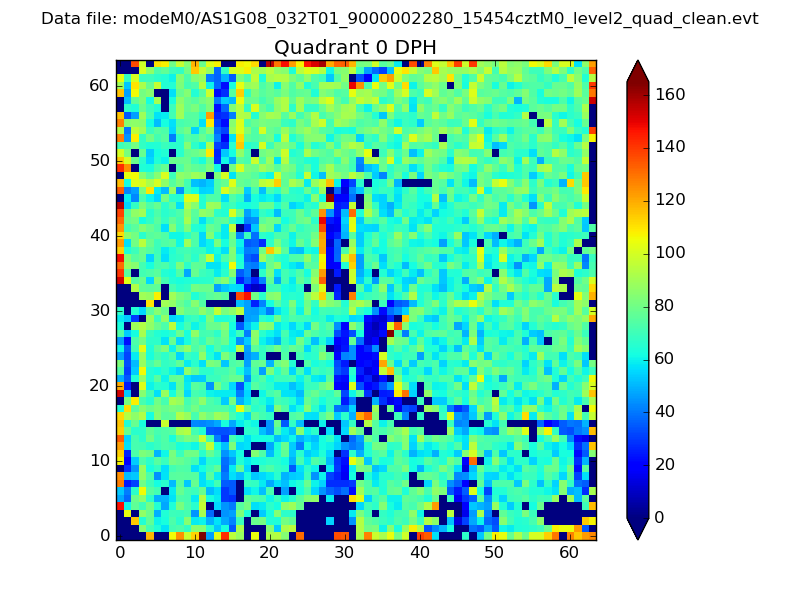 |
 |
Quadrant B |
|---|---|---|---|
| Quadrant D | 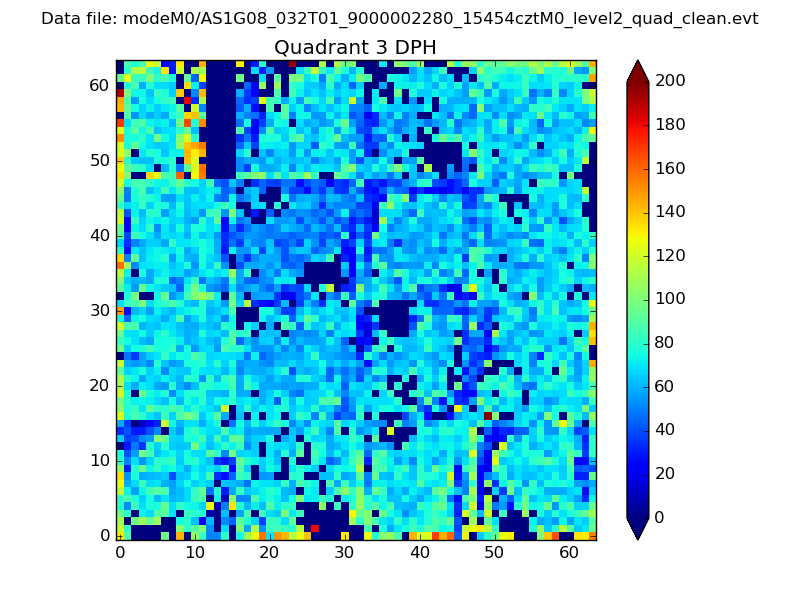 |
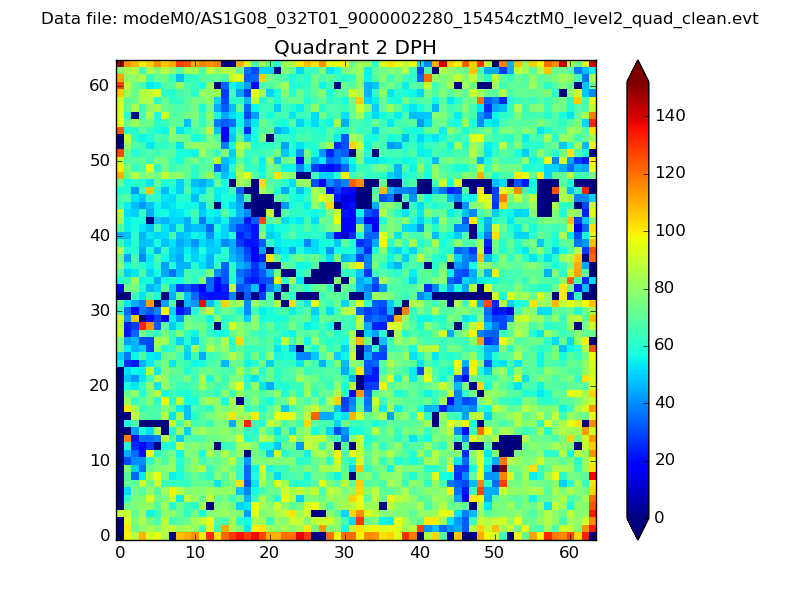 |
Quadrant C |
| Plot type | Count rate plots | Images |
|---|---|---|
| Comparison with Poisson distribution Blue bars denote a histogram of data divided into 1 sec bins. Red curve is a Poisson curve with rate = median count rate of data. |
 |
 |
| Quadrant-wise count rates Data is divided into 100 sec bins |
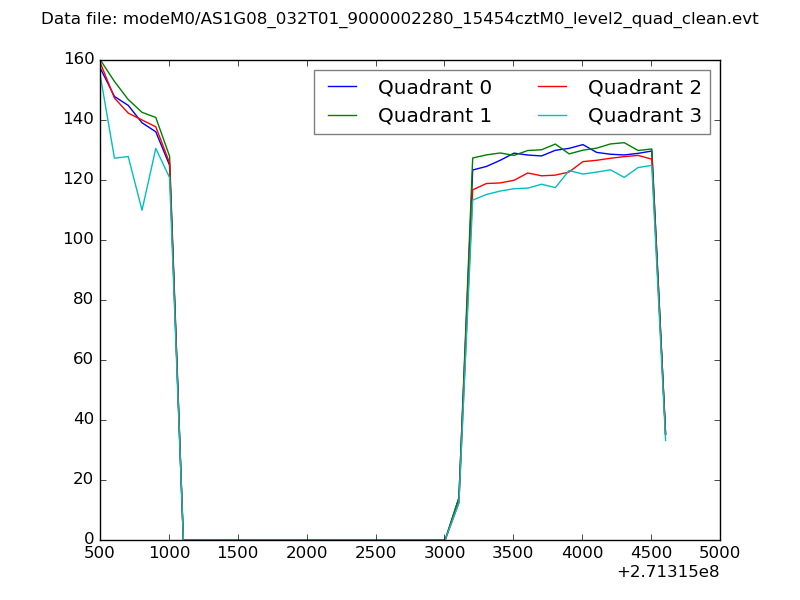 |
|
| Module-wise count rates for Quadrant A Data is divided into 100 sec bins |
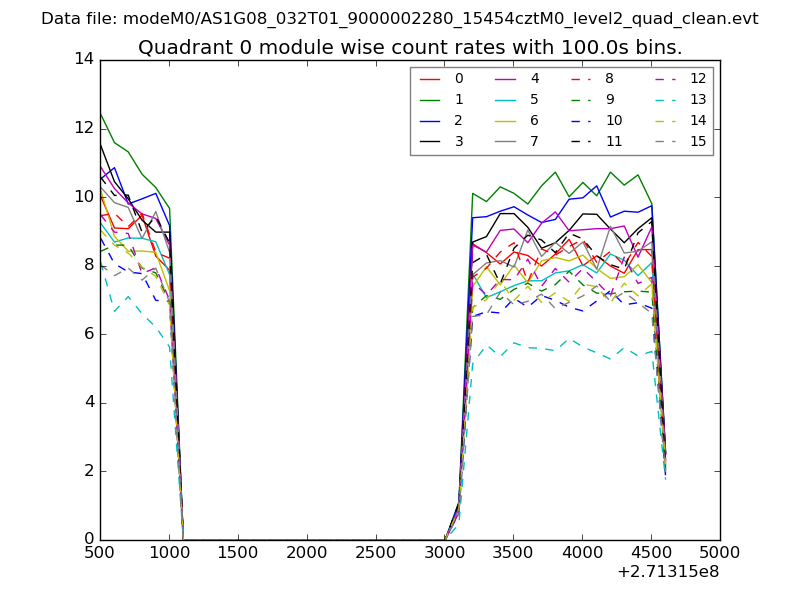 |
 |
| Module-wise count rates for Quadrant B Data is divided into 100 sec bins |
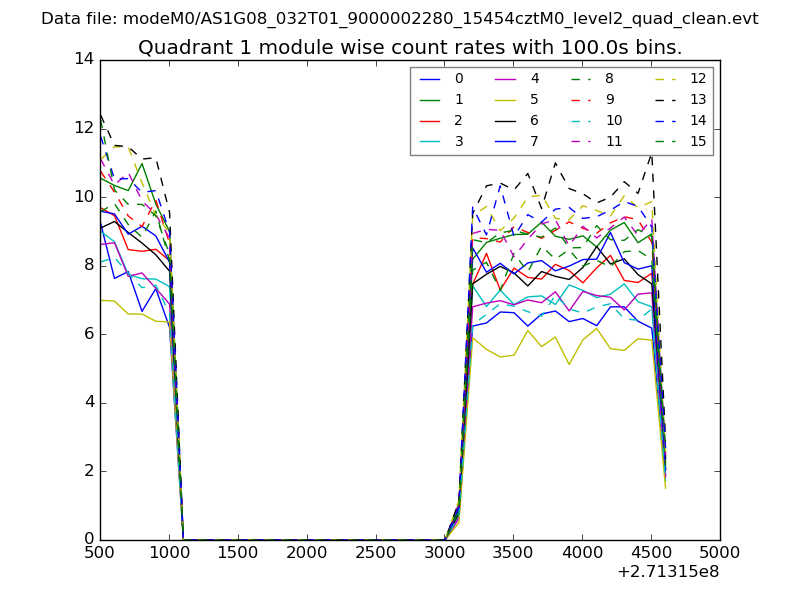 |
 |
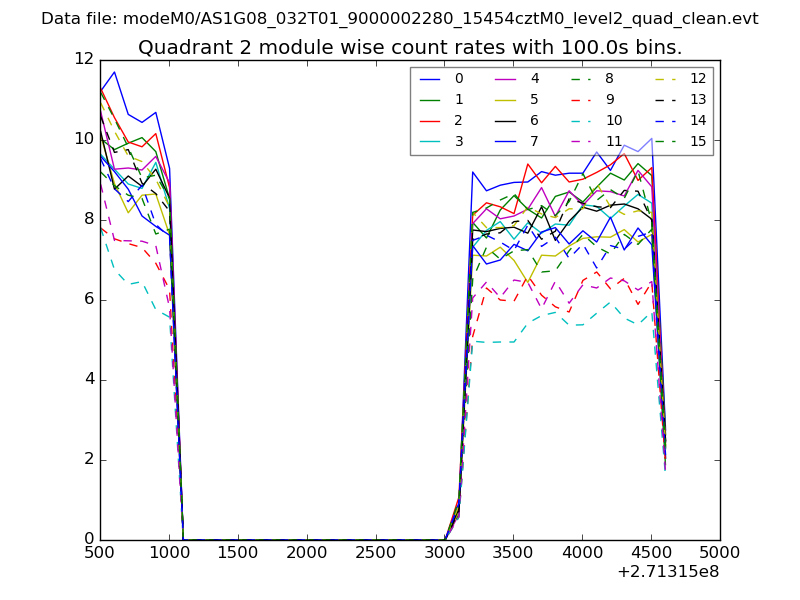
| Module-wise count rates for Quadrant C Data is divided into 100 sec bins |
 |
 |
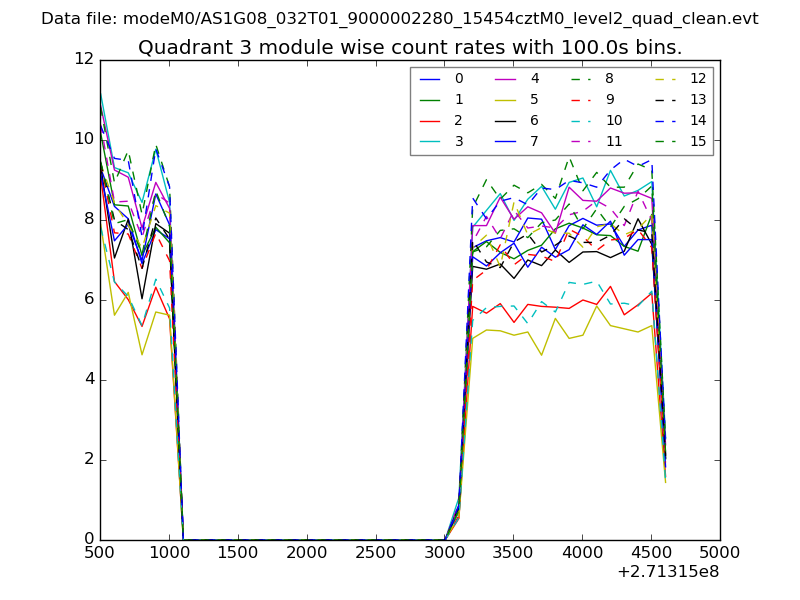
| Module-wise count rates for Quadrant D Data is divided into 100 sec bins |
 |
 |
| Parameter | Plot |
|---|---|
| CZT HV Monitor | 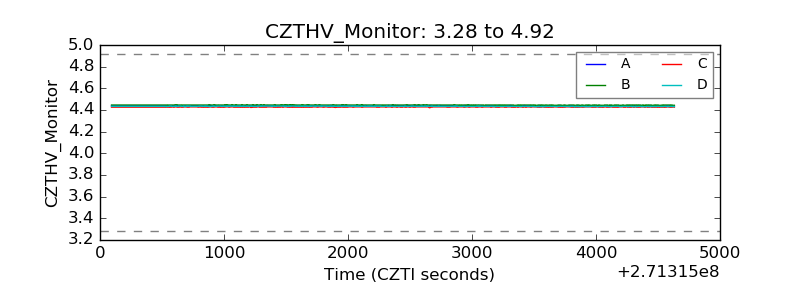 |
| D_VDD | 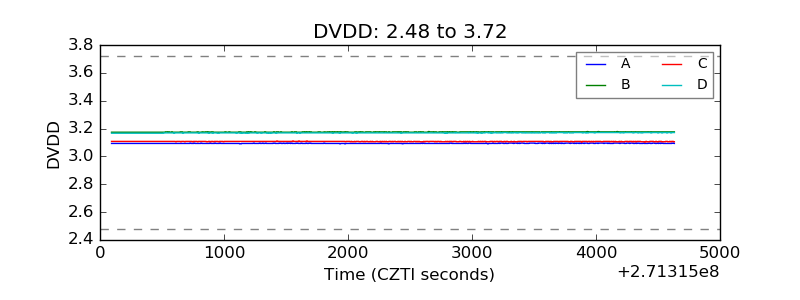 |
| Temperature 1 | 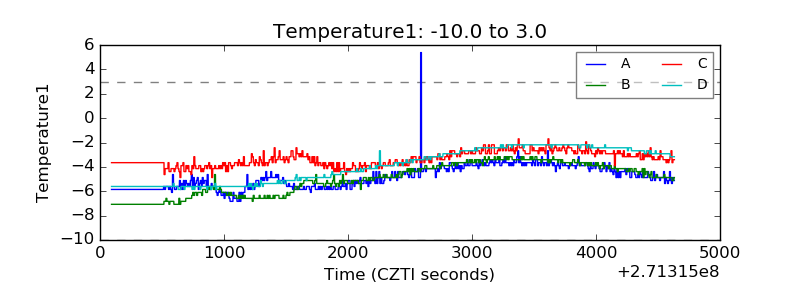 |
| Veto HV Monitor |  |
| Veto LLD | 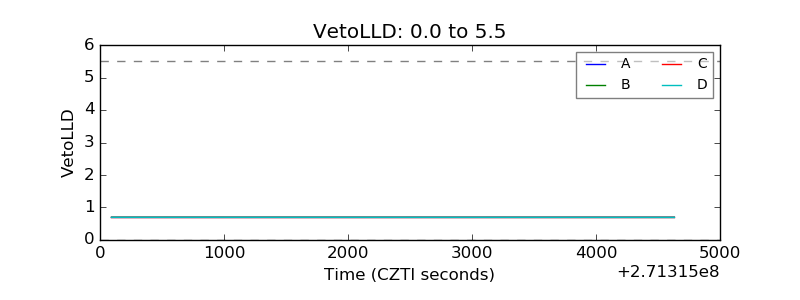 |
| Alpha Counter | 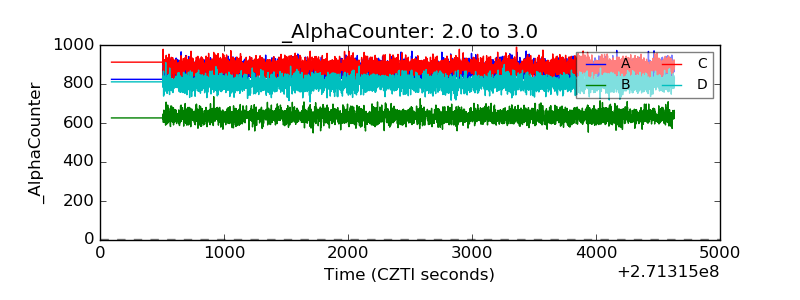 |
| _CPM_Rate | 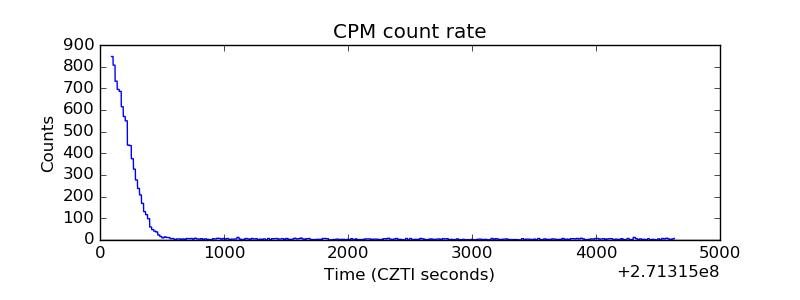 |
| CZT Counter | 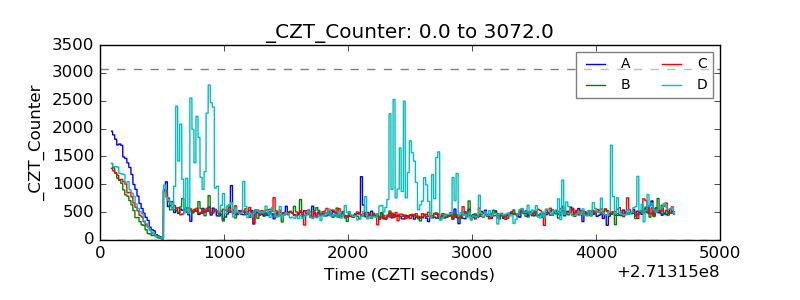 |
| +2.5 Volts monitor |  |
| +5 Volts monitor |  |
| _ROLL_ROT | 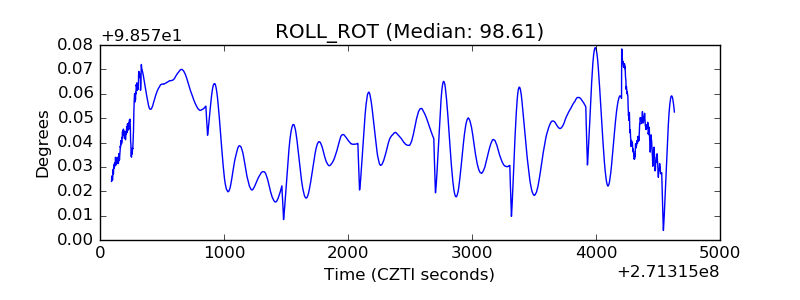 |
| _Roll_DEC | 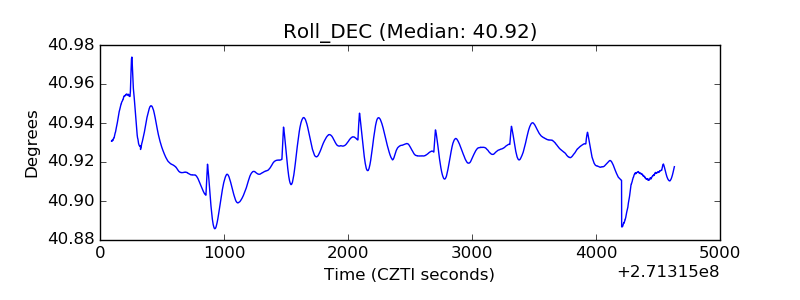 |
| _Roll_RA | 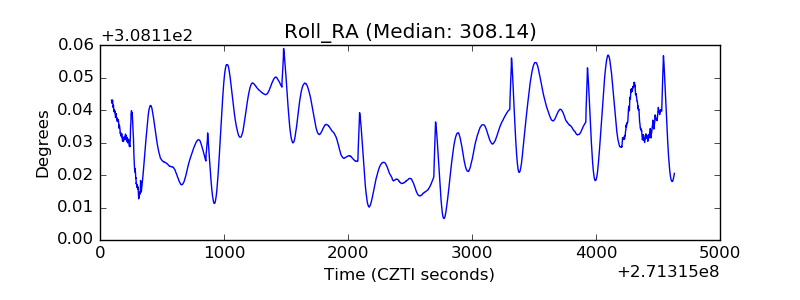 |
| Veto Counter | 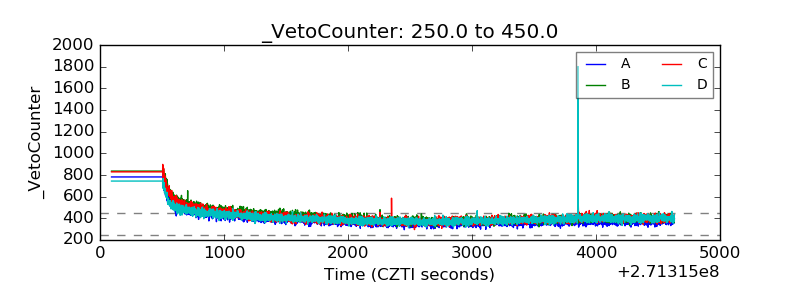 |