| Param | Original file | Final file |
|---|---|---|
| Filename | modeM0/AS1G08_033T01_9000002278cztM0_level2.fits | modeM0/AS1G08_033T01_9000002278cztM0_level2_quad_clean.evt |
| Size (bytes) | 175,227,840 | 164,540,160 |
| Size | 167.1 MB | 156.9 MB |
| Events in quadrant A | 1,079,402 | 991,818 |
| Events in quadrant B | 1,043,210 | 994,927 |
| Events in quadrant C | 1,059,130 | 958,384 |
| Events in quadrant D | 895,378 | 807,939 |
| Mode M9 | |||
|---|---|---|---|
| Quadrant | BADHDUFLAG | Total packets | Discarded packets |
| A | 0 | 43 | 0 |
| B | 0 | 43 | 0 |
| C | 0 | 43 | 0 |
| D | 0 | 43 | 0 |
| Mode M0 | |||
|---|---|---|---|
| Quadrant | BADHDUFLAG | Total packets | Discarded packets |
| A | 0 | 41753 | 0 |
| B | 0 | 39415 | 0 |
| C | 0 | 38861 | 0 |
| D | 0 | 50188 | 0 |
| Mode SS | |||
|---|---|---|---|
| Quadrant | BADHDUFLAG | Total packets | Discarded packets |
| A | 0 | 364 | 0 |
| B | 0 | 364 | 0 |
| C | 0 | 364 | 0 |
| D | 0 | 364 | 0 |
| Quadrant | Total seconds | Saturated seconds | Saturation percentage |
|---|---|---|---|
| A | 17835 | 560 | 3.139893% |
| B | 17835 | 313 | 1.754976% |
| C | 17835 | 160 | 0.897112% |
| D | 17835 | 1480 | 8.298290% |
Noise dominated data is calculated using 1-second bins in cleaned event files. If a bin has >2000 counts, and if more than 50% of those come from <1% of pixels, then it is considered to be noise-dominated and hence unusable.
| Quadrant | # 1 sec bins | Bins with >0 counts | Bins with >2000 counts | High rate bins dominated by noise | Noise dominated (total time) | Noise dominated (detector-on time) | Marked lightcurve |
|---|---|---|---|---|---|---|---|
| A | 22060 | 17835 | 0 | 0 | 0.00% | 0.00% |  |
| B | 22060 | 17833 | 0 | 0 | 0.00% | 0.00% | 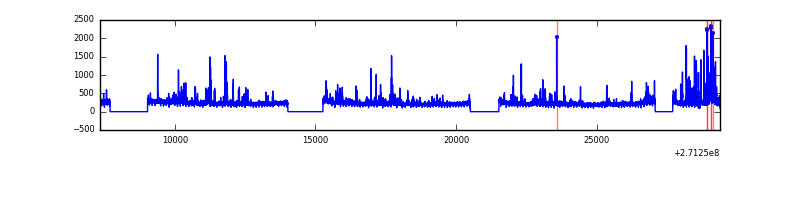 |
| C | 22060 | 17835 | 0 | 0 | 0.00% | 0.00% | 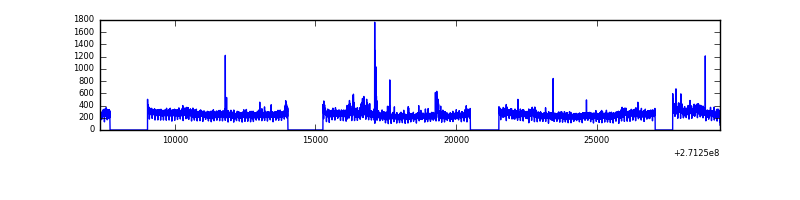 |
| D | 22060 | 17834 | 0 | 0 | 0.00% | 0.00% |  |
Top three noisy pixels from each quadrant. If the there are fewer than three noisy pixels in the level2.evt file, extra rows are filled as -1
| Pixel properties | Quadrant properties | ||||||
|---|---|---|---|---|---|---|---|
| Quadrant | DetID | PixID | Counts | Sigma | Mean | Median | Sigma |
| A | 0 | 29 | 1048 | 11.07 | 281 | 265 | 70.7 |
| A | 7 | 110 | 923 | 9.3 | 281 | 265 | 70.7 |
| A | 9 | 19 | 808 | 7.68 | 281 | 265 | 70.7 |
| B | 2 | 9 | 850 | 10.58 | 276 | 264 | 55.4 |
| B | 3 | 80 | 743 | 8.65 | 276 | 264 | 55.4 |
| B | 2 | 8 | 735 | 8.5 | 276 | 264 | 55.4 |
| C | 1 | 81 | 837 | 7.77 | 279 | 261 | 74.2 |
| C | 1 | 80 | 823 | 7.58 | 279 | 261 | 74.2 |
| C | 9 | 188 | 761 | 6.74 | 279 | 261 | 74.2 |
| D | 3 | 14 | 680 | 6.39 | 255 | 232 | 70.1 |
| D | 3 | 31 | 658 | 6.08 | 255 | 232 | 70.1 |
| D | 15 | 46 | 656 | 6.05 | 255 | 232 | 70.1 |
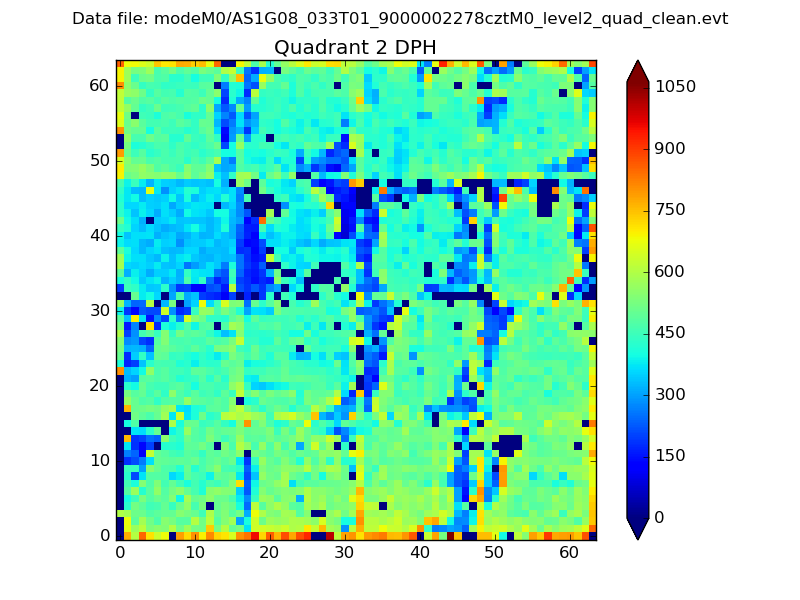
Histogram calculated using DETX and DETY for each event in the final _common_clean file
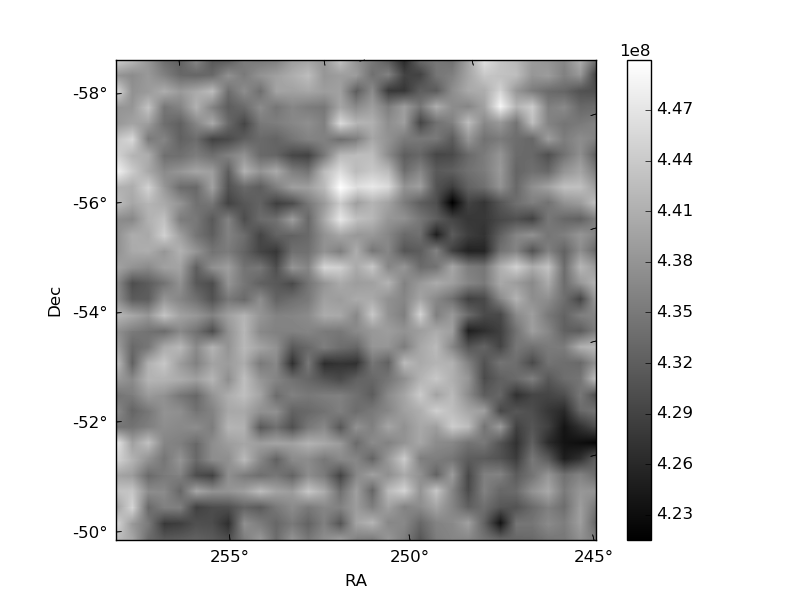
| Quadrant A | 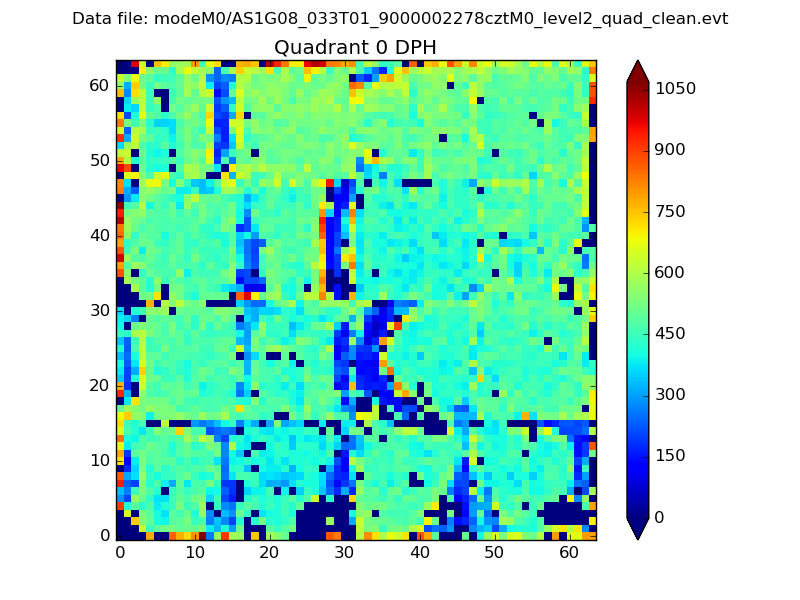 |
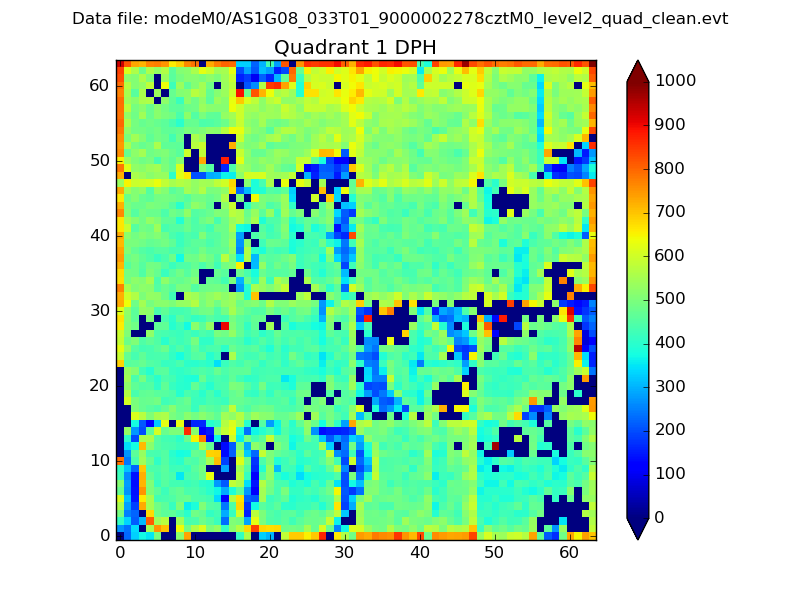 |
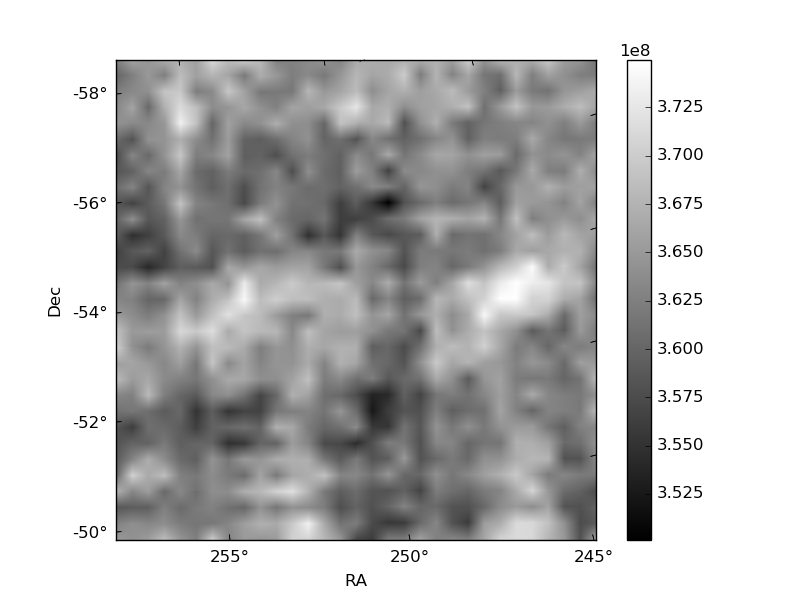
Quadrant B |
|---|---|---|---|
| Quadrant D | 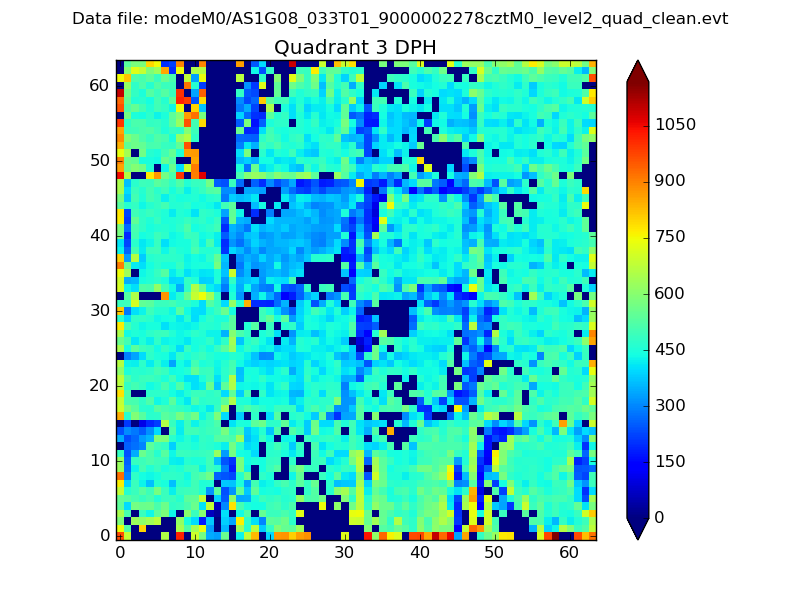 |
 |
Quadrant C |
| Plot type | Count rate plots | Images |
|---|---|---|
| Comparison with Poisson distribution Blue bars denote a histogram of data divided into 1 sec bins. Red curve is a Poisson curve with rate = median count rate of data. |
 |
 |
| Quadrant-wise count rates Data is divided into 100 sec bins |
 |
|
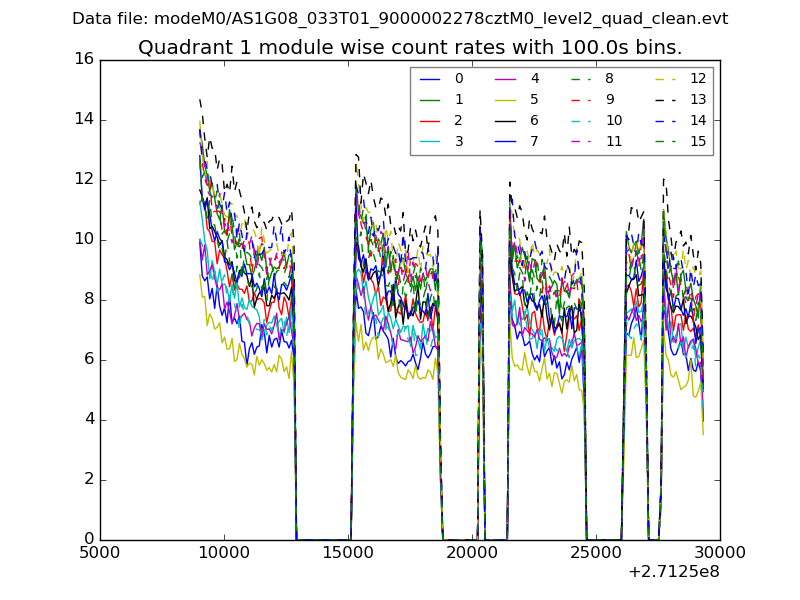
| Module-wise count rates for Quadrant A Data is divided into 100 sec bins |
 |
 |
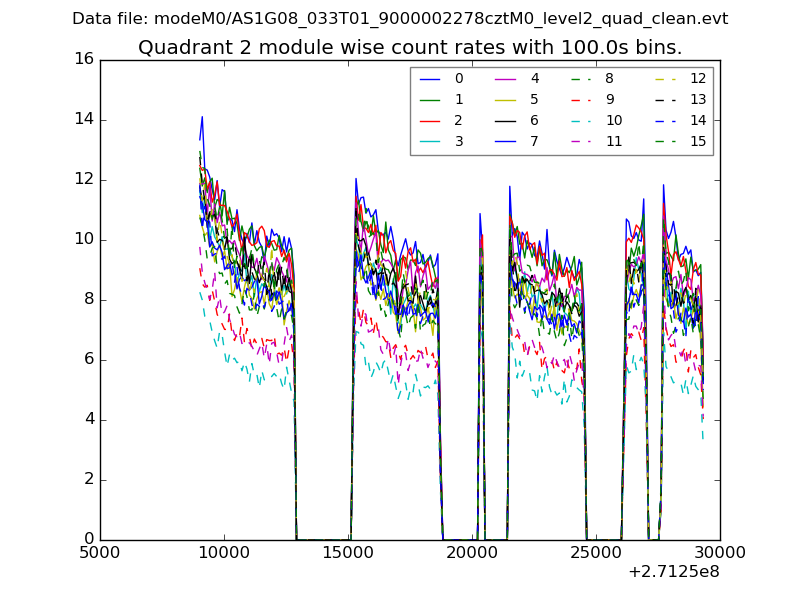
| Module-wise count rates for Quadrant B Data is divided into 100 sec bins |
 |
 |
| Module-wise count rates for Quadrant C Data is divided into 100 sec bins |
 |
 |
| Module-wise count rates for Quadrant D Data is divided into 100 sec bins |
 |
 |
| Parameter | Plot |
|---|---|
| CZT HV Monitor |  |
| D_VDD | 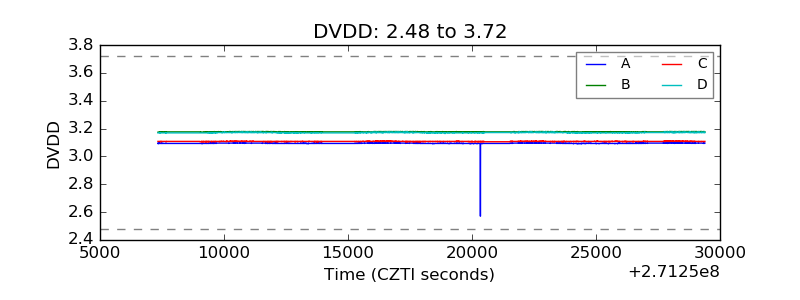 |
| Temperature 1 |  |
| Veto HV Monitor | 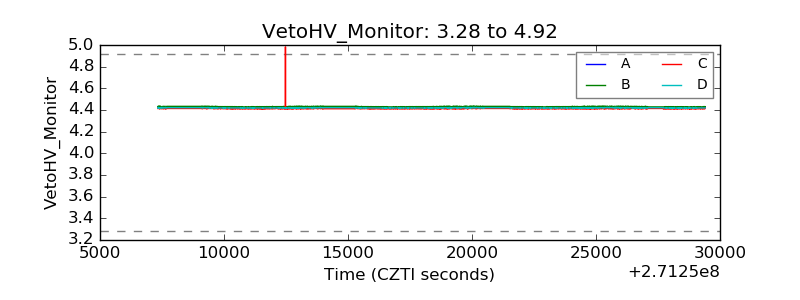 |
| Veto LLD | 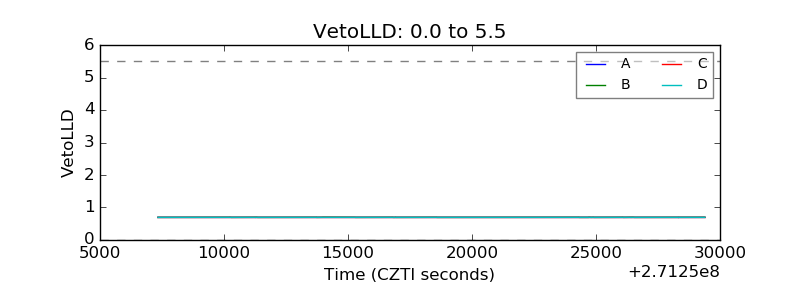 |
| Alpha Counter | 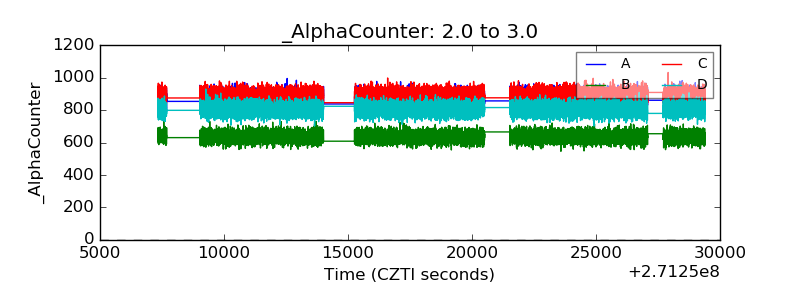 |
| _CPM_Rate | 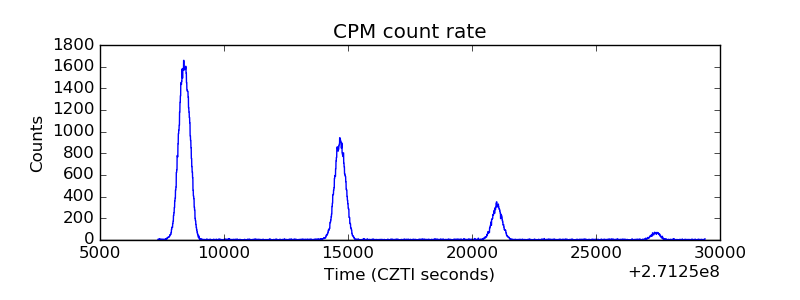 |
| CZT Counter | 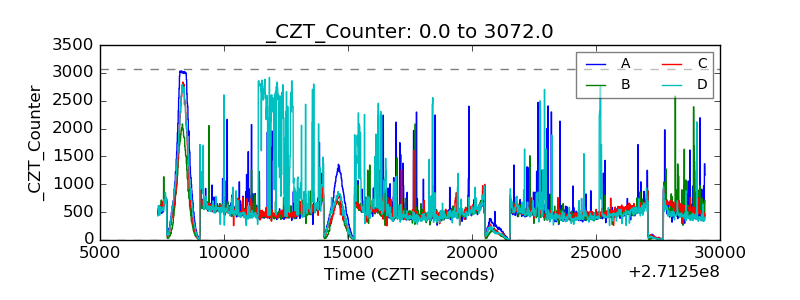 |
| +2.5 Volts monitor | 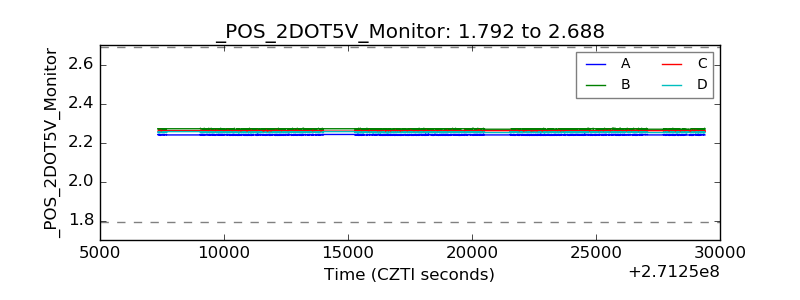 |
| +5 Volts monitor | 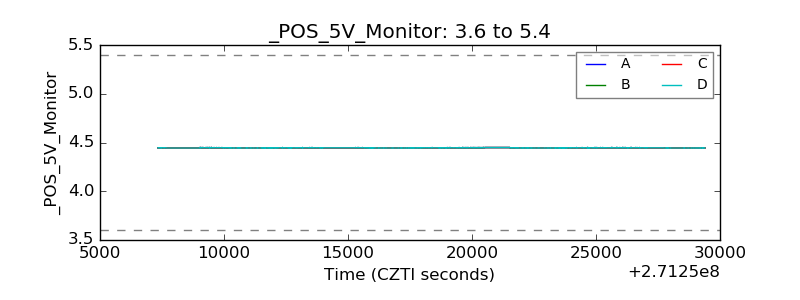 |
| _ROLL_ROT | 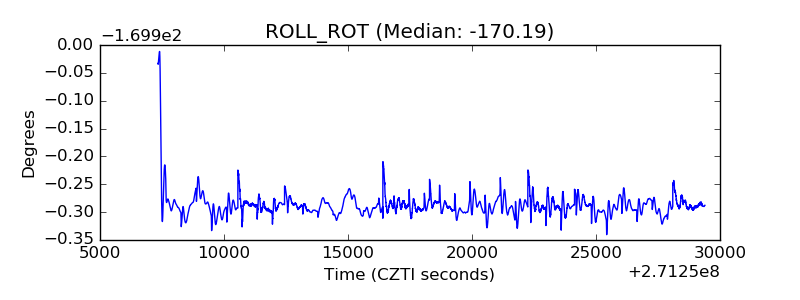 |
| _Roll_DEC | 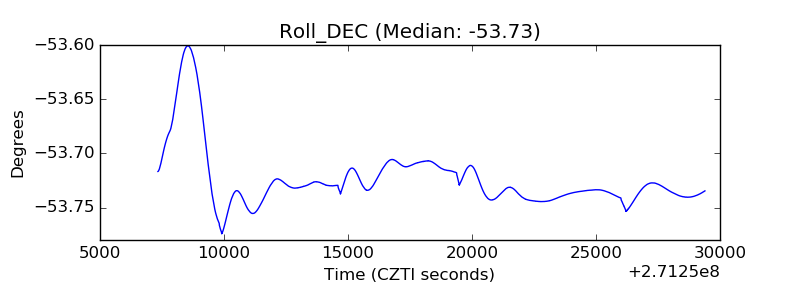 |
| _Roll_RA | 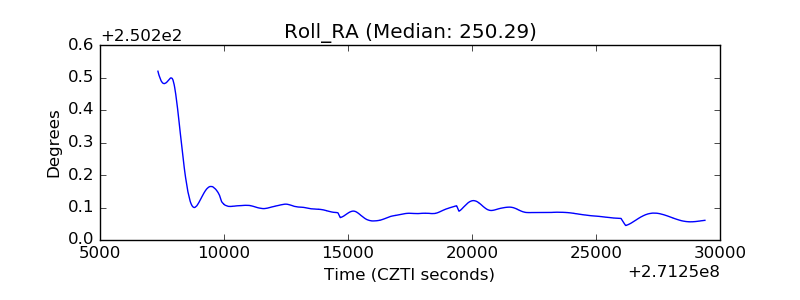 |
| Veto Counter |  |