| Param | Original file | Final file |
|---|---|---|
| Filename | modeM0/AS1G08_033T01_9000002278_15444cztM0_level2.evt | modeM0/AS1G08_033T01_9000002278_15444cztM0_level2_quad_clean.evt |
| Size (bytes) | 160,931,520 | 38,476,800 |
| Size | 153.5 MB | 36.7 MB |
| Events in quadrant A | 1,226,250 | 259,336 |
| Events in quadrant B | 1,153,381 | 262,916 |
| Events in quadrant C | 1,139,894 | 255,345 |
| Events in quadrant D | 1,218,277 | 244,086 |
| Mode M9 | |||
|---|---|---|---|
| Quadrant | BADHDUFLAG | Total packets | Discarded packets |
| A | 0 | 14 | 0 |
| B | 0 | 14 | 0 |
| C | 0 | 14 | 0 |
| D | 0 | 14 | 0 |
| Mode M0 | |||
|---|---|---|---|
| Quadrant | BADHDUFLAG | Total packets | Discarded packets |
| A | 0 | 4942 | 2 |
| B | 0 | 4707 | 1 |
| C | 0 | 4603 | 1 |
| D | 0 | 4816 | 1 |
| Mode SS | |||
|---|---|---|---|
| Quadrant | BADHDUFLAG | Total packets | Discarded packets |
| A | 0 | 40 | 0 |
| B | 0 | 40 | 0 |
| C | 0 | 40 | 0 |
| D | 0 | 40 | 0 |
| Quadrant | Total seconds | Saturated seconds | Saturation percentage |
|---|---|---|---|
| A | 1973 | 93 | 4.713634% |
| B | 1973 | 68 | 3.446528% |
| C | 1973 | 51 | 2.584896% |
| D | 1973 | 80 | 4.054739% |
Noise dominated data is calculated using 1-second bins in cleaned event files. If a bin has >2000 counts, and if more than 50% of those come from <1% of pixels, then it is considered to be noise-dominated and hence unusable.
| Quadrant | # 1 sec bins | Bins with >0 counts | Bins with >2000 counts | High rate bins dominated by noise | Noise dominated (total time) | Noise dominated (detector-on time) | Marked lightcurve |
|---|---|---|---|---|---|---|---|
| A | 3309 | 1975 | 4 | 4 | 0.12% | 0.20% | 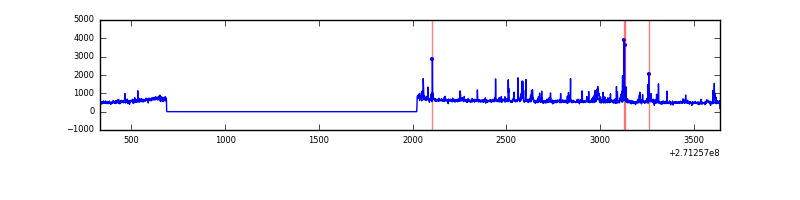 |
| B | 3309 | 1975 | 1 | 1 | 0.03% | 0.05% | 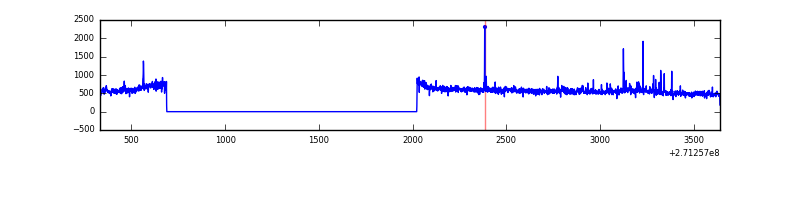 |
| C | 3309 | 1975 | 0 | 0 | 0.00% | 0.00% | 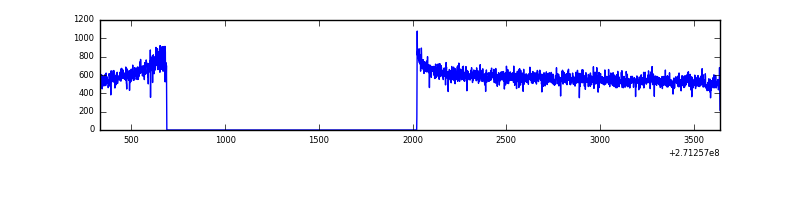 |
| D | 3309 | 1975 | 10 | 10 | 0.30% | 0.51% | 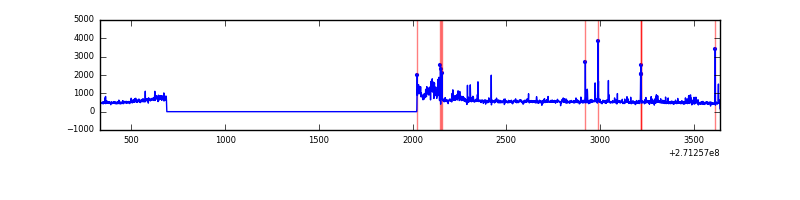 |
Top three noisy pixels from each quadrant. If the there are fewer than three noisy pixels in the level2.evt file, extra rows are filled as -1
| Pixel properties | Quadrant properties | ||||||
|---|---|---|---|---|---|---|---|
| Quadrant | DetID | PixID | Counts | Sigma | Mean | Median | Sigma |
| A | 14 | 238 | 79248 | 1350.42 | 284 | 278 | 58.5 |
| A | 14 | 237 | 32531 | 551.54 | 284 | 278 | 58.5 |
| A | 4 | 2 | 10638 | 177.16 | 284 | 278 | 58.5 |
| B | 4 | 142 | 21221 | 387.04 | 280 | 273 | 54.1 |
| B | 3 | 209 | 7557 | 134.57 | 280 | 273 | 54.1 |
| B | 0 | 214 | 6361 | 112.48 | 280 | 273 | 54.1 |
| C | 3 | 233 | 82206 | 1301.29 | 271 | 271 | 63.0 |
| C | 13 | 61 | 2032 | 27.97 | 271 | 271 | 63.0 |
| C | 8 | 222 | 943 | 10.67 | 271 | 271 | 63.0 |
| D | 1 | 52 | 66945 | 970.78 | 276 | 268 | 68.7 |
| D | 2 | 33 | 18131 | 260.08 | 276 | 268 | 68.7 |
| D | 7 | 223 | 15882 | 227.33 | 276 | 268 | 68.7 |
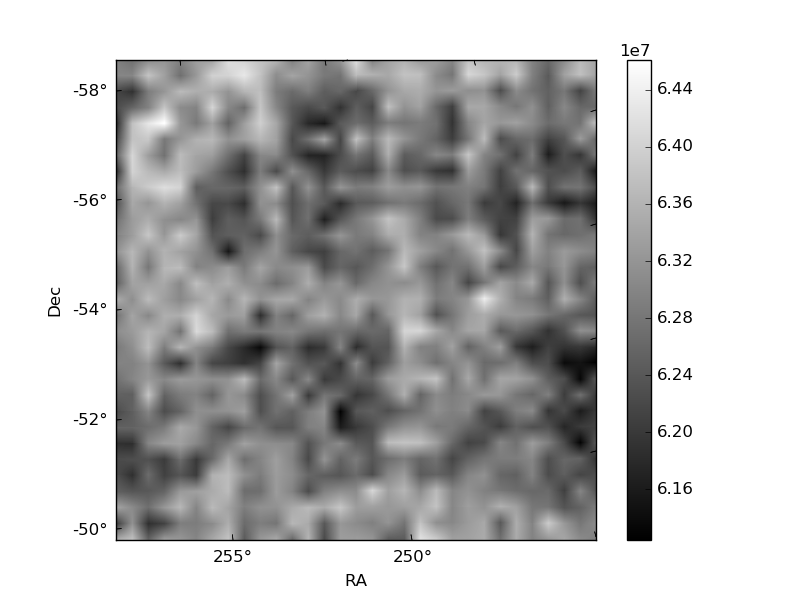
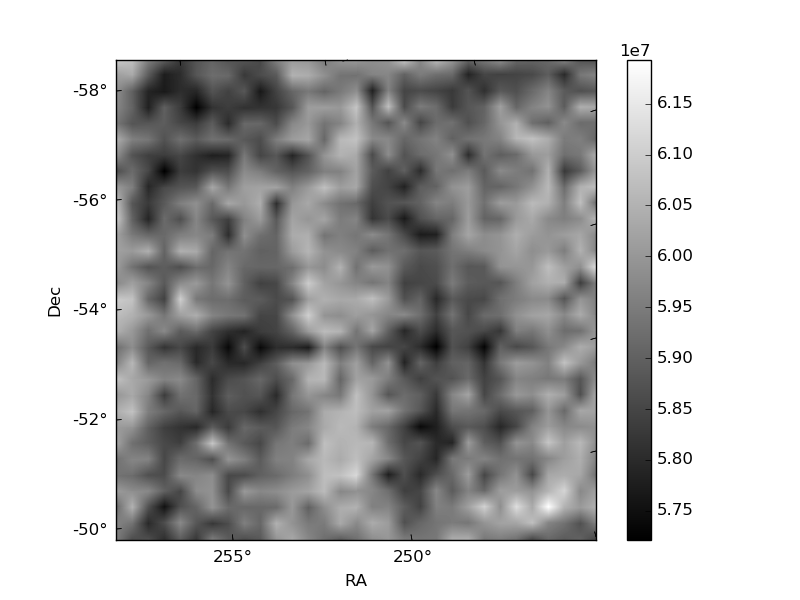
Histogram calculated using DETX and DETY for each event in the final _common_clean file
| Quadrant A | 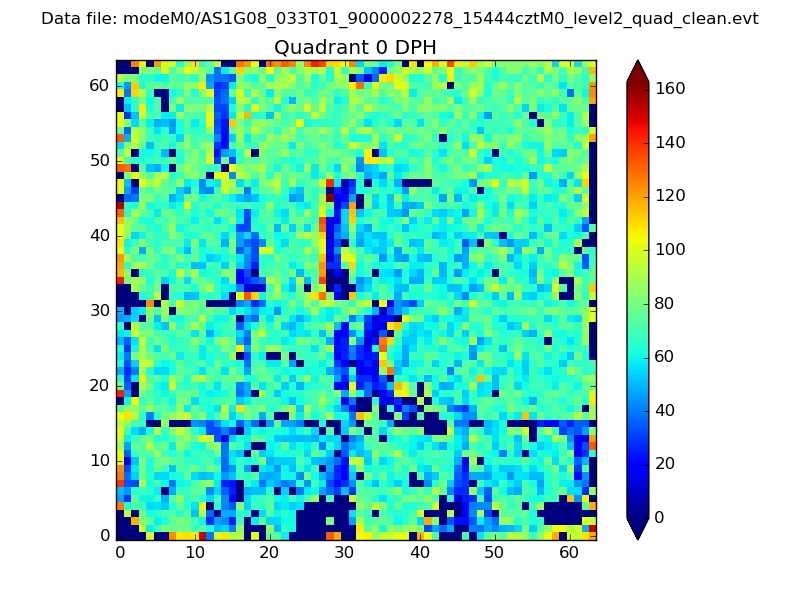 |
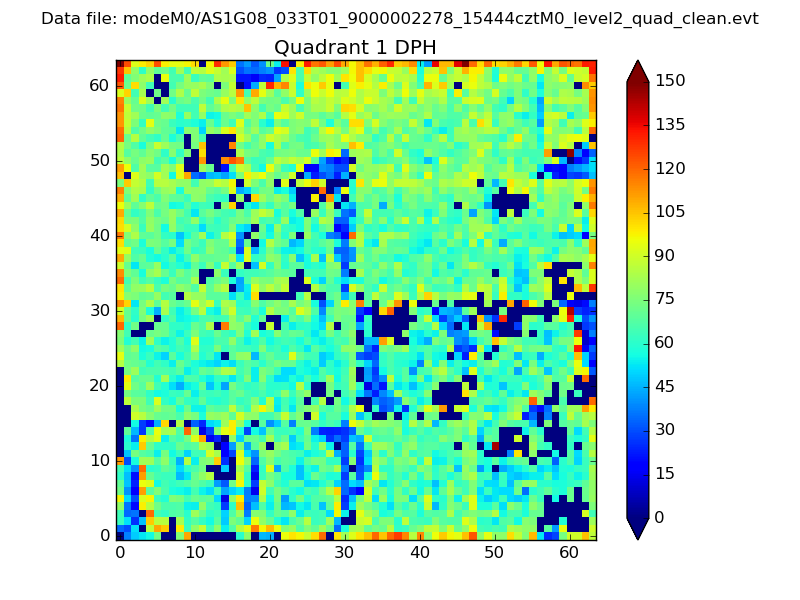 |
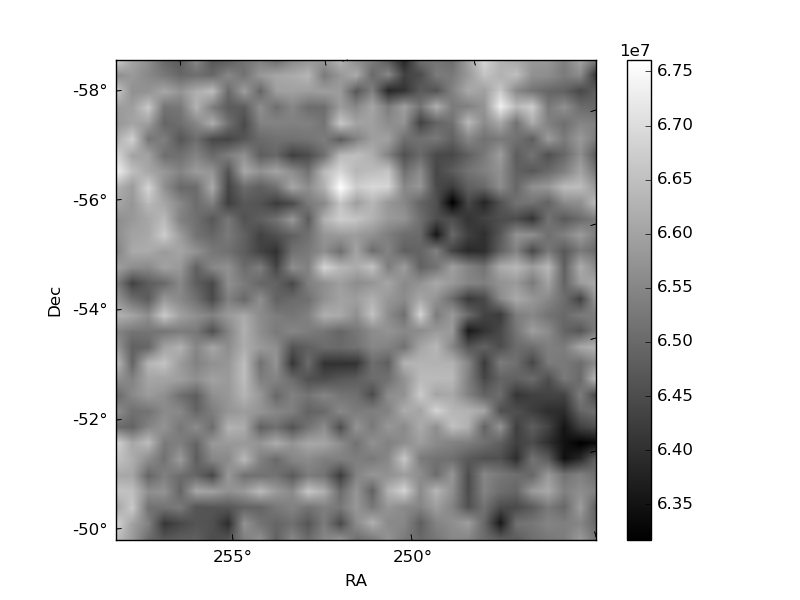
Quadrant B |
|---|---|---|---|
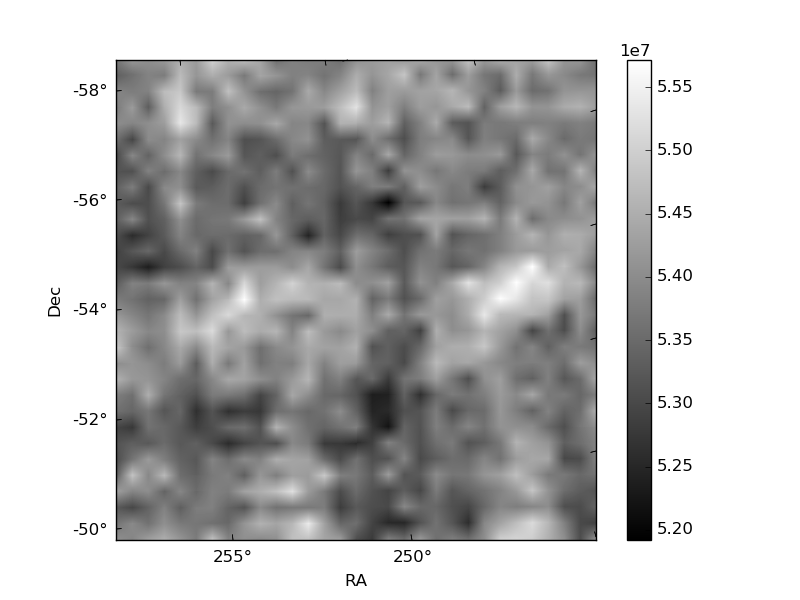
| Quadrant D |  |
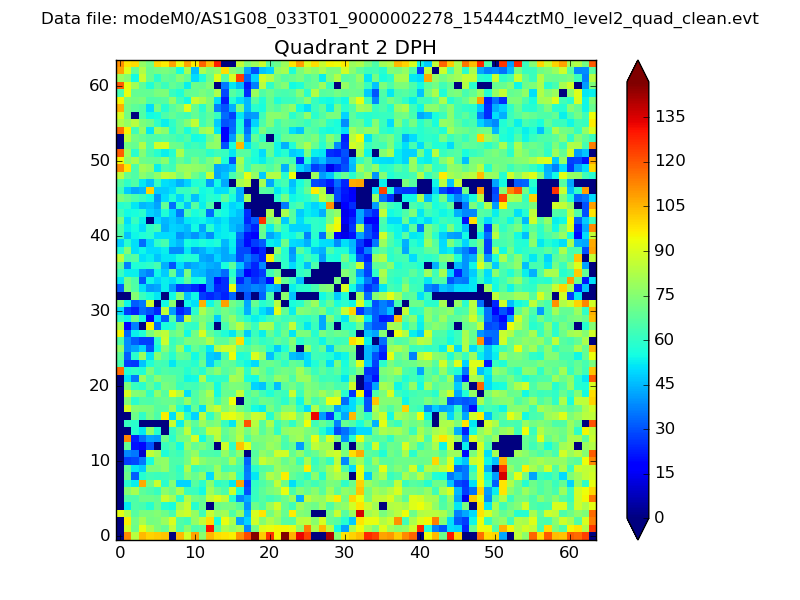 |
Quadrant C |
| Plot type | Count rate plots | Images |
|---|---|---|
| Comparison with Poisson distribution Blue bars denote a histogram of data divided into 1 sec bins. Red curve is a Poisson curve with rate = median count rate of data. |
 |
 |
| Quadrant-wise count rates Data is divided into 100 sec bins |
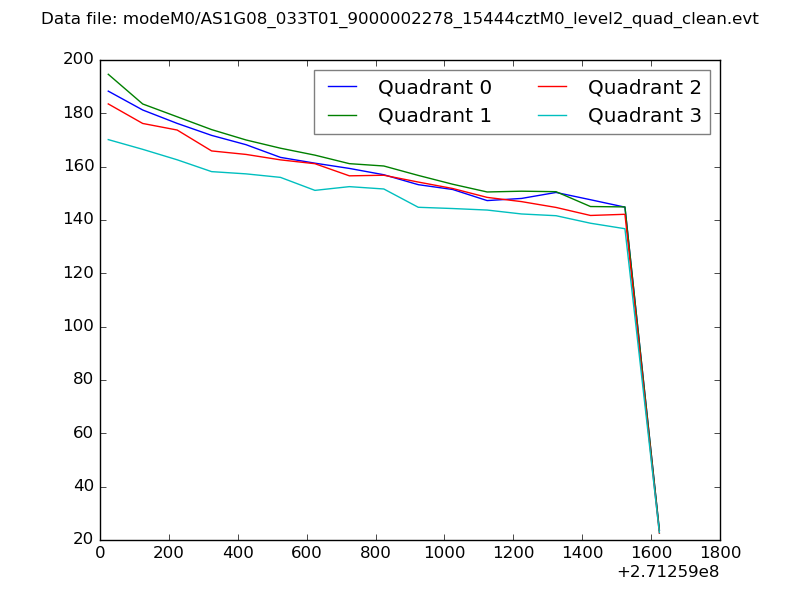 |
|
| Module-wise count rates for Quadrant A Data is divided into 100 sec bins |
 |
 |
| Module-wise count rates for Quadrant B Data is divided into 100 sec bins |
 |
 |
| Module-wise count rates for Quadrant C Data is divided into 100 sec bins |
 |
 |
| Module-wise count rates for Quadrant D Data is divided into 100 sec bins |
 |
 |
| Parameter | Plot |
|---|---|
| CZT HV Monitor | 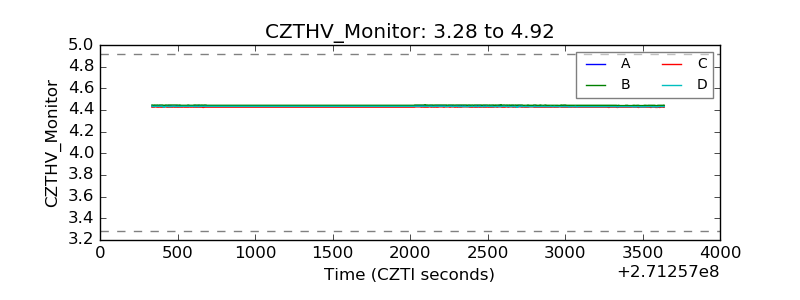 |
| D_VDD | 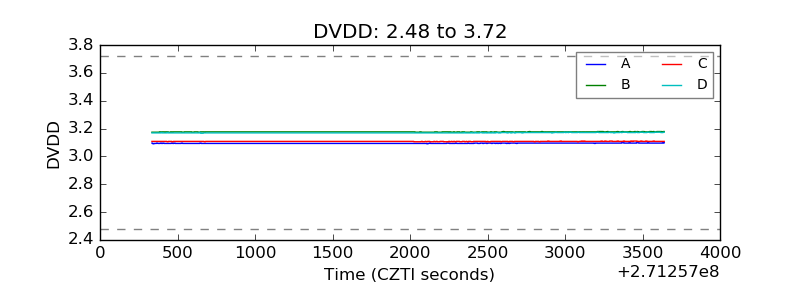 |
| Temperature 1 | 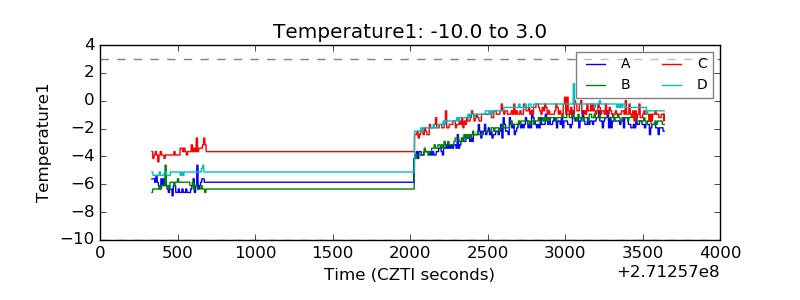 |
| Veto HV Monitor |  |
| Veto LLD | 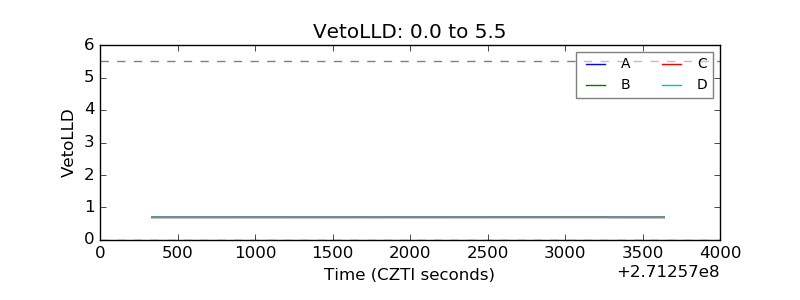 |
| Alpha Counter | 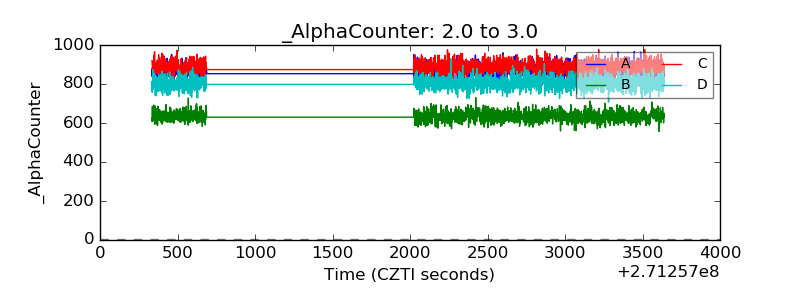 |
| _CPM_Rate | 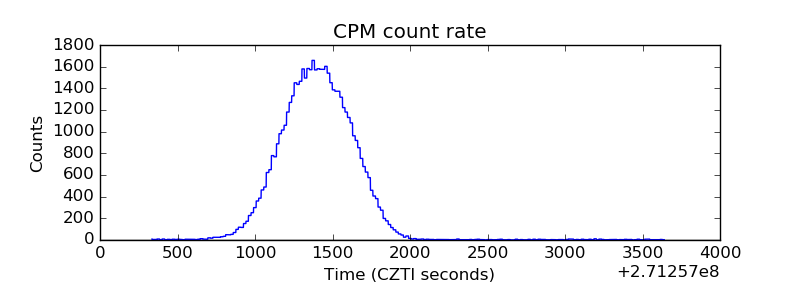 |
| CZT Counter |  |
| +2.5 Volts monitor |  |
| +5 Volts monitor |  |
| _ROLL_ROT | 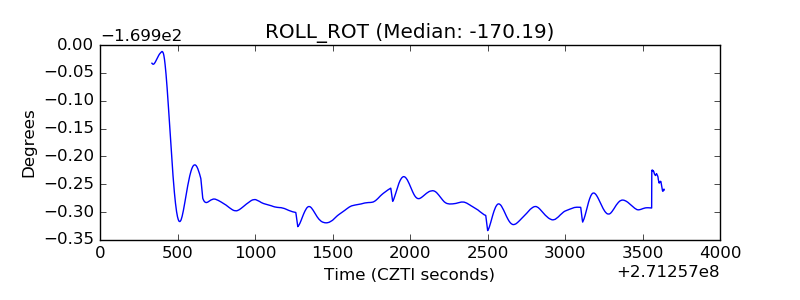 |
| _Roll_DEC | 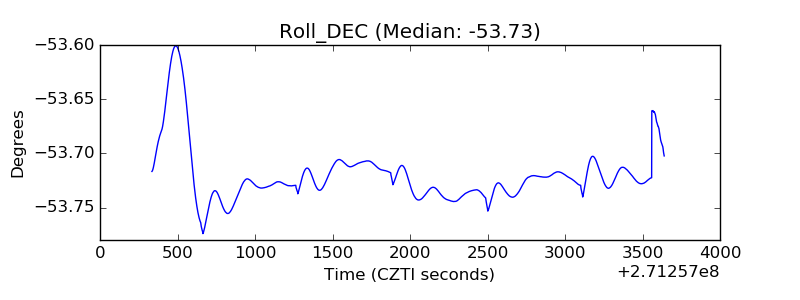 |
| _Roll_RA | 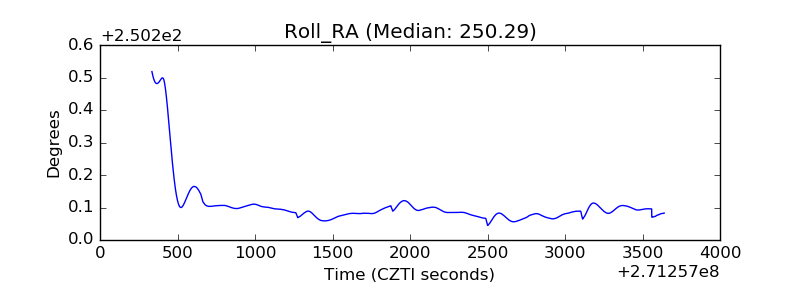 |
| Veto Counter | 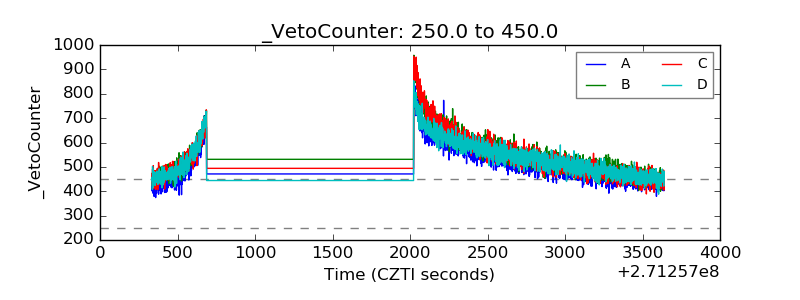 |