| Param | Original file | Final file |
|---|---|---|
| Filename | modeM0/AS1G08_033T01_9000002278_15445cztM0_level2.evt | modeM0/AS1G08_033T01_9000002278_15445cztM0_level2_quad_clean.evt |
| Size (bytes) | 578,344,320 | 110,554,560 |
| Size | 551.6 MB | 105.4 MB |
| Events in quadrant A | 3,757,757 | 748,109 |
| Events in quadrant B | 3,355,121 | 759,419 |
| Events in quadrant C | 3,345,577 | 742,863 |
| Events in quadrant D | 6,626,779 | 654,797 |
| Mode M9 | |||
|---|---|---|---|
| Quadrant | BADHDUFLAG | Total packets | Discarded packets |
| A | 0 | 12 | 0 |
| B | 0 | 12 | 0 |
| C | 0 | 12 | 0 |
| D | 0 | 12 | 0 |
| Mode M0 | |||
|---|---|---|---|
| Quadrant | BADHDUFLAG | Total packets | Discarded packets |
| A | 0 | 15301 | 2 |
| B | 0 | 13960 | 1 |
| C | 0 | 13659 | 1 |
| D | 0 | 23817 | 1 |
| Mode SS | |||
|---|---|---|---|
| Quadrant | BADHDUFLAG | Total packets | Discarded packets |
| A | 0 | 130 | 0 |
| B | 0 | 130 | 0 |
| C | 0 | 130 | 0 |
| D | 0 | 130 | 0 |
| Quadrant | Total seconds | Saturated seconds | Saturation percentage |
|---|---|---|---|
| A | 6342 | 208 | 3.279722% |
| B | 6342 | 84 | 1.324503% |
| C | 6342 | 48 | 0.756859% |
| D | 6342 | 1208 | 19.047619% |
Noise dominated data is calculated using 1-second bins in cleaned event files. If a bin has >2000 counts, and if more than 50% of those come from <1% of pixels, then it is considered to be noise-dominated and hence unusable.
| Quadrant | # 1 sec bins | Bins with >0 counts | Bins with >2000 counts | High rate bins dominated by noise | Noise dominated (total time) | Noise dominated (detector-on time) | Marked lightcurve |
|---|---|---|---|---|---|---|---|
| A | 7593 | 6344 | 75 | 75 | 0.99% | 1.18% | 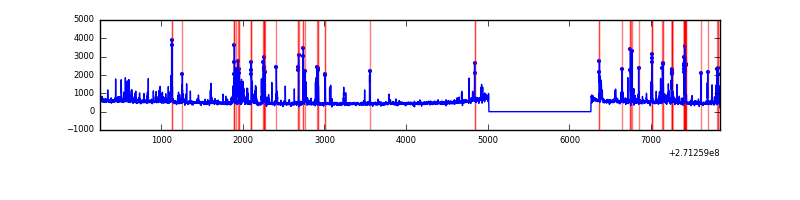 |
| B | 7593 | 6344 | 8 | 8 | 0.11% | 0.13% | 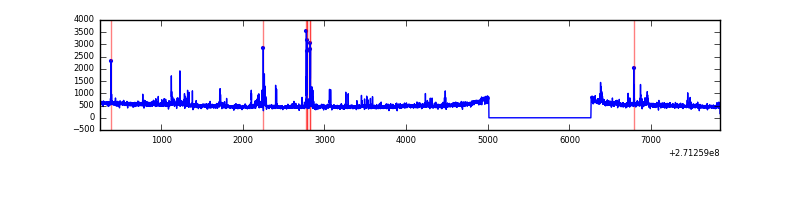 |
| C | 7593 | 6344 | 0 | 0 | 0.00% | 0.00% | 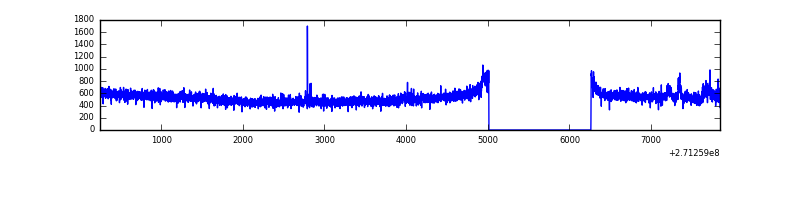 |
| D | 7593 | 6344 | 1049 | 1049 | 13.82% | 16.54% | 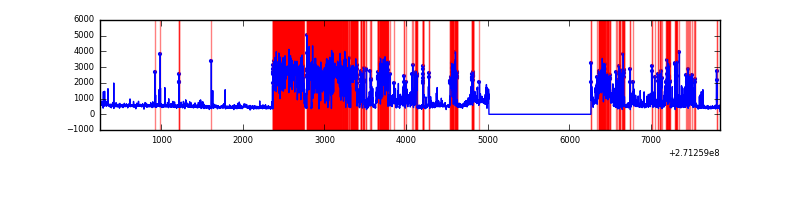 |
Top three noisy pixels from each quadrant. If the there are fewer than three noisy pixels in the level2.evt file, extra rows are filled as -1
| Pixel properties | Quadrant properties | ||||||
|---|---|---|---|---|---|---|---|
| Quadrant | DetID | PixID | Counts | Sigma | Mean | Median | Sigma |
| A | 14 | 238 | 316893 | 1971.54 | 802 | 787 | 160.3 |
| A | 13 | 248 | 143287 | 888.77 | 802 | 787 | 160.3 |
| A | 14 | 237 | 112387 | 696.04 | 802 | 787 | 160.3 |
| B | 4 | 142 | 59329 | 392.83 | 800 | 783 | 149.0 |
| B | 0 | 189 | 58199 | 385.25 | 800 | 783 | 149.0 |
| B | 3 | 209 | 24801 | 161.15 | 800 | 783 | 149.0 |
| C | 3 | 233 | 346284 | 1982.14 | 766 | 770 | 174.3 |
| C | 7 | 247 | 7663 | 39.54 | 766 | 770 | 174.3 |
| C | 10 | 22 | 6286 | 31.64 | 766 | 770 | 174.3 |
| D | 1 | 52 | 3133975 | 17494.29 | 732 | 710 | 179.1 |
| D | 5 | 222 | 356015 | 1983.81 | 732 | 710 | 179.1 |
| D | 2 | 33 | 137055 | 761.27 | 732 | 710 | 179.1 |
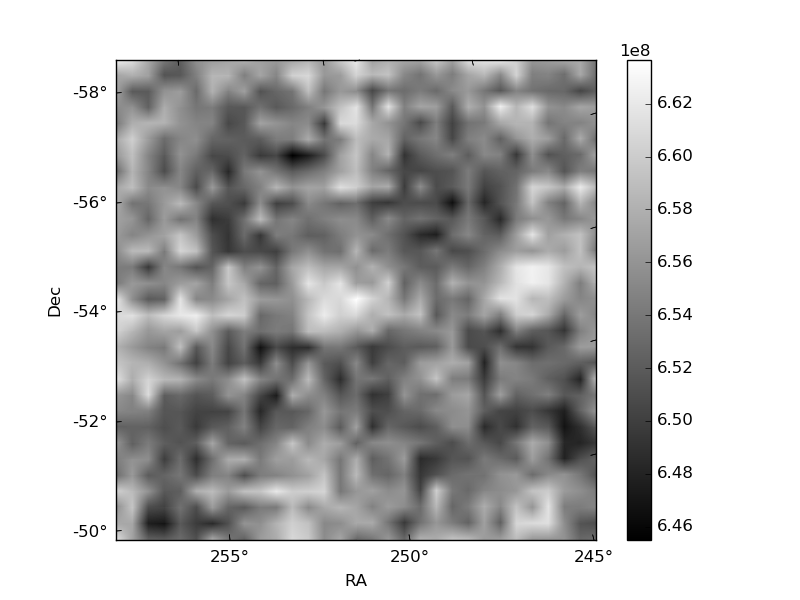
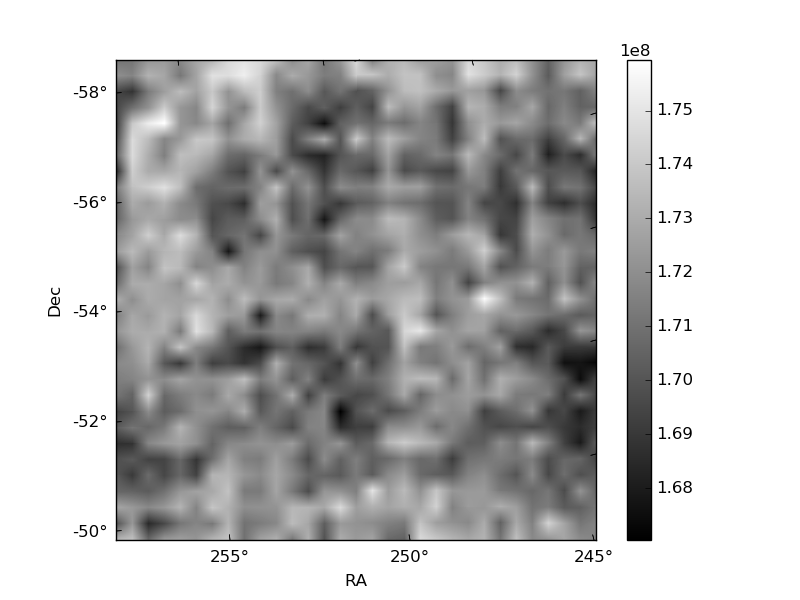
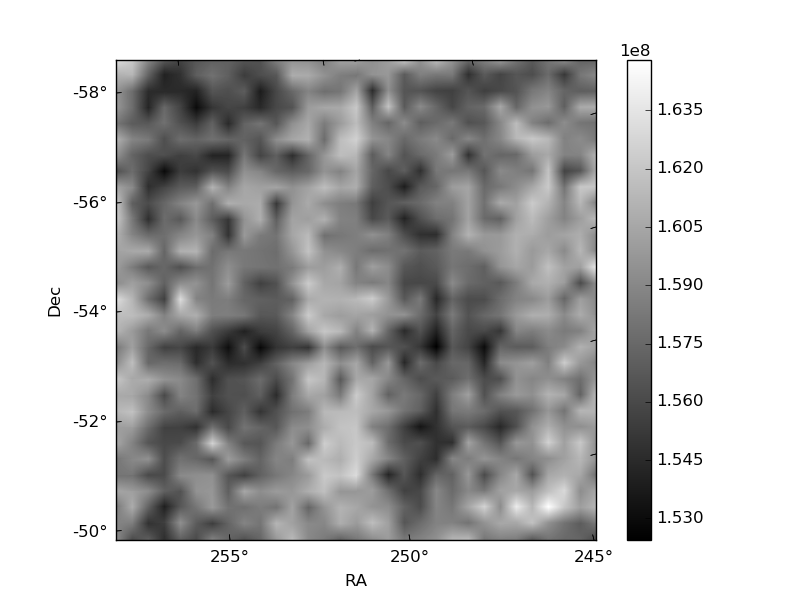
Histogram calculated using DETX and DETY for each event in the final _common_clean file
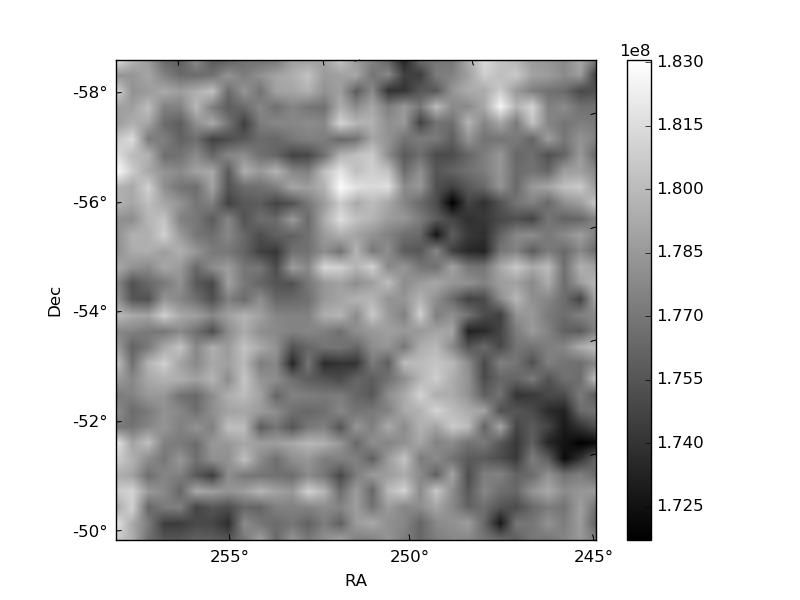
| Quadrant A | 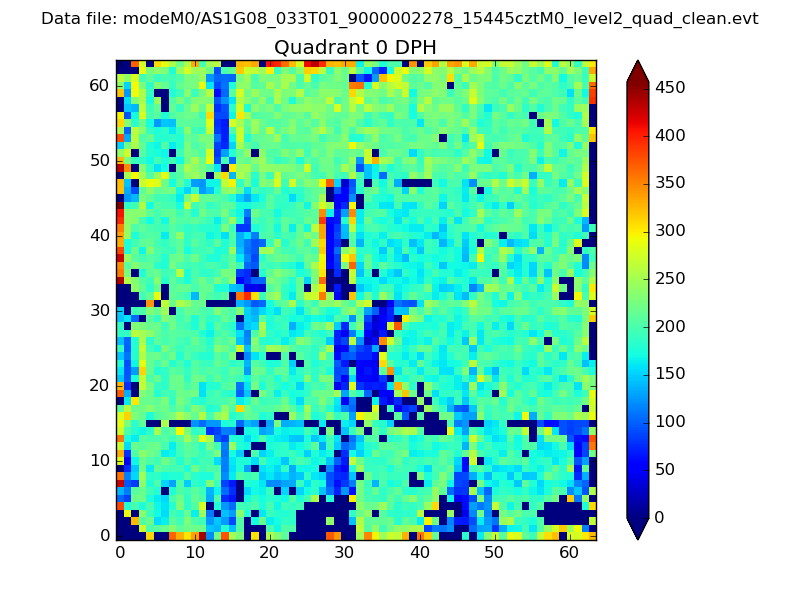 |
 |
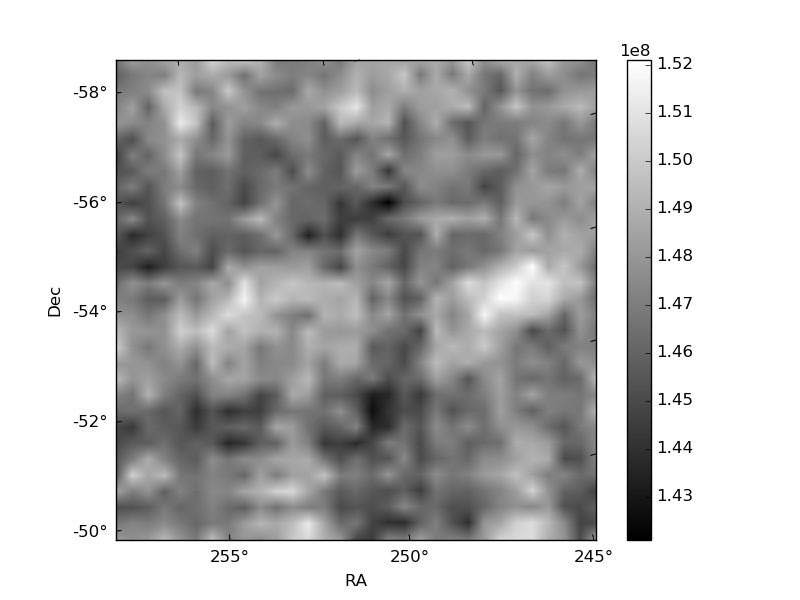
Quadrant B |
|---|---|---|---|
| Quadrant D | 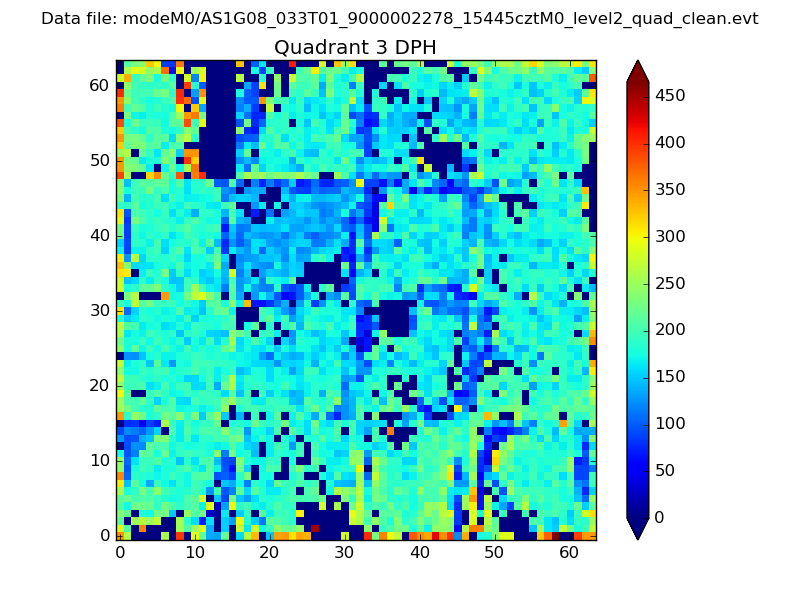 |
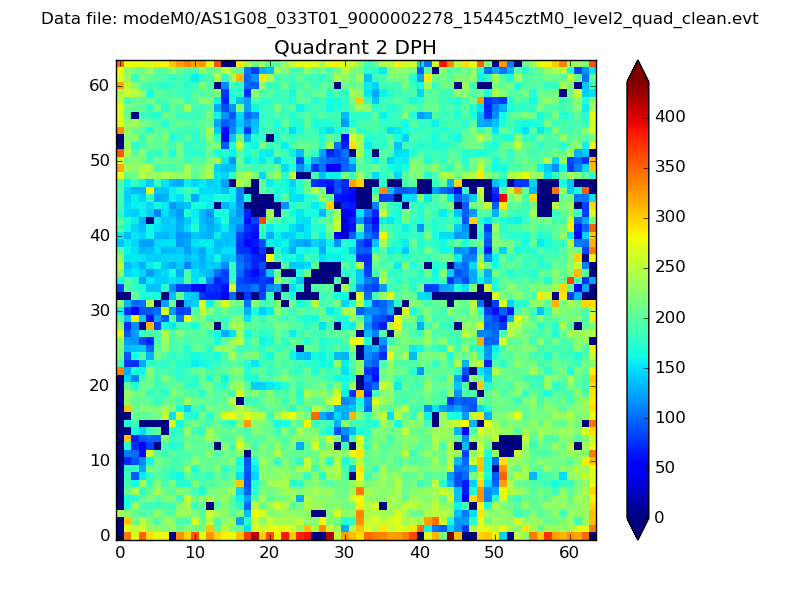 |
Quadrant C |
| Plot type | Count rate plots | Images |
|---|---|---|
| Comparison with Poisson distribution Blue bars denote a histogram of data divided into 1 sec bins. Red curve is a Poisson curve with rate = median count rate of data. |
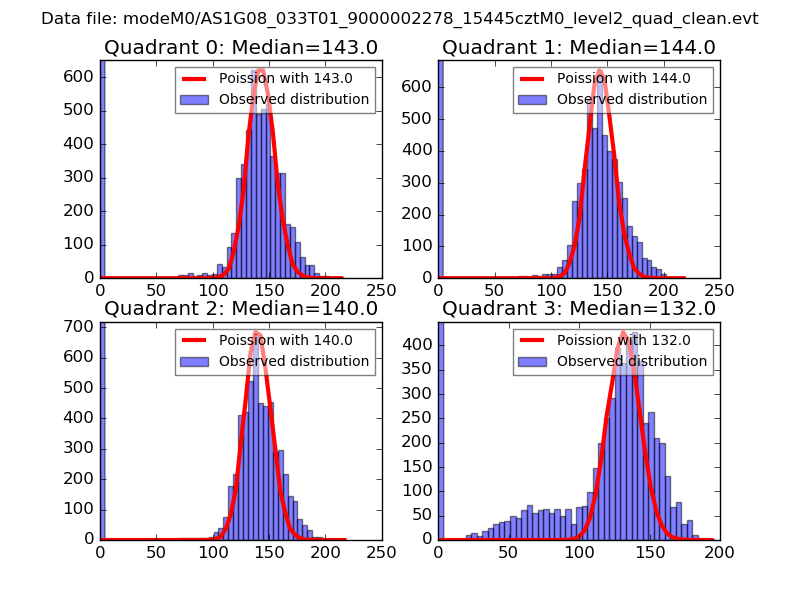 |
 |
| Quadrant-wise count rates Data is divided into 100 sec bins |
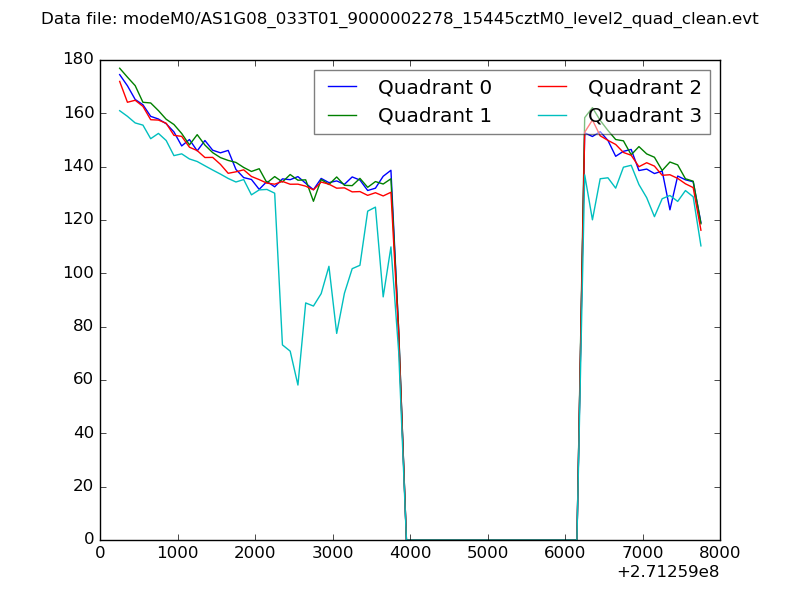 |
|
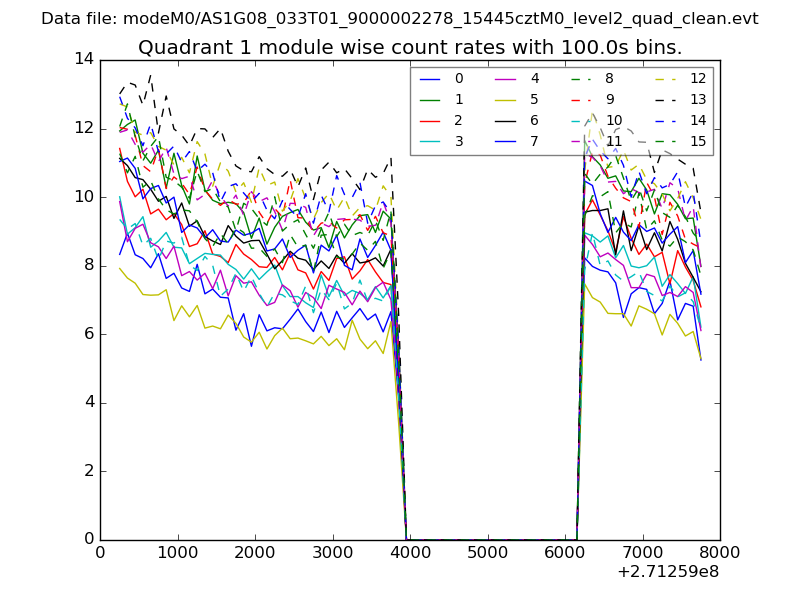
| Module-wise count rates for Quadrant A Data is divided into 100 sec bins |
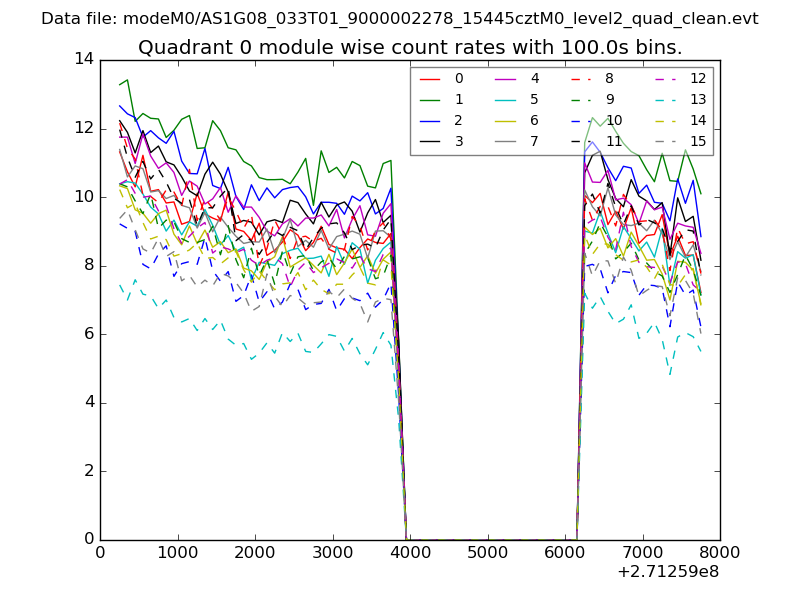 |
 |
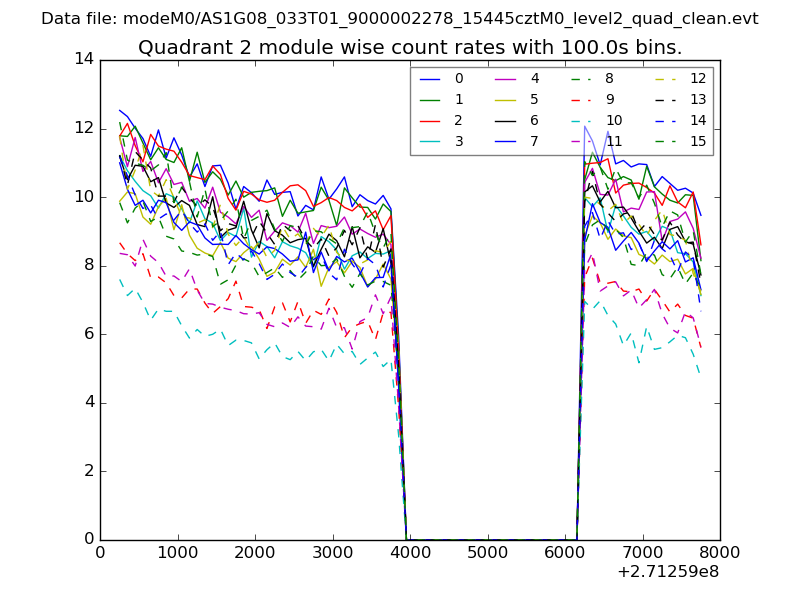
| Module-wise count rates for Quadrant B Data is divided into 100 sec bins |
 |
 |
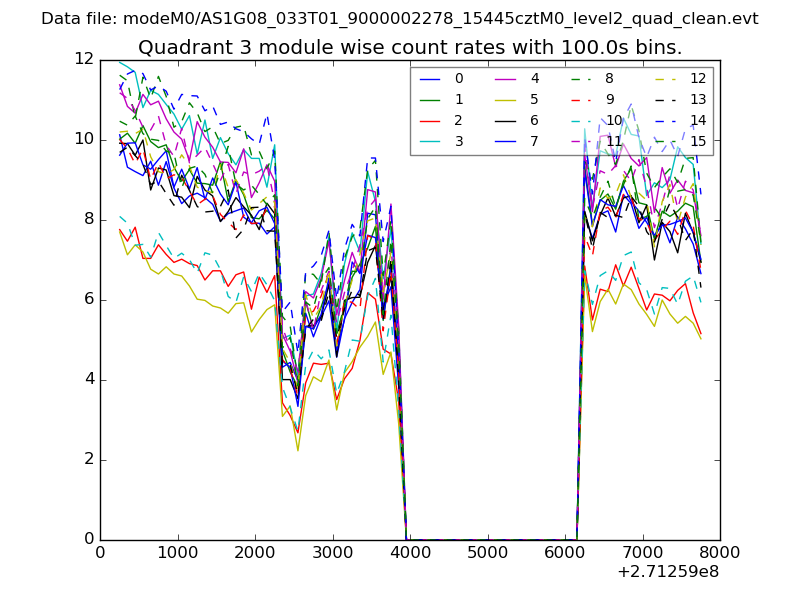
| Module-wise count rates for Quadrant C Data is divided into 100 sec bins |
 |
 |
| Module-wise count rates for Quadrant D Data is divided into 100 sec bins |
 |
 |
| Parameter | Plot |
|---|---|
| CZT HV Monitor | 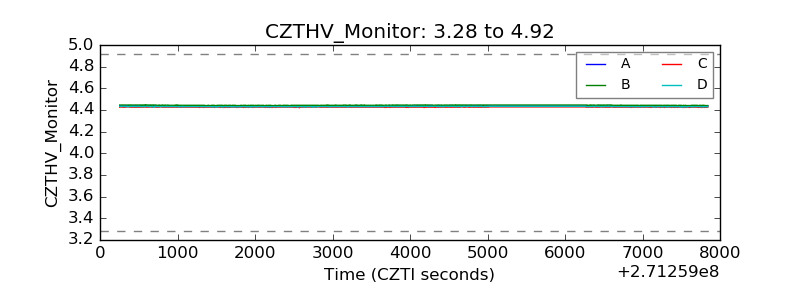 |
| D_VDD | 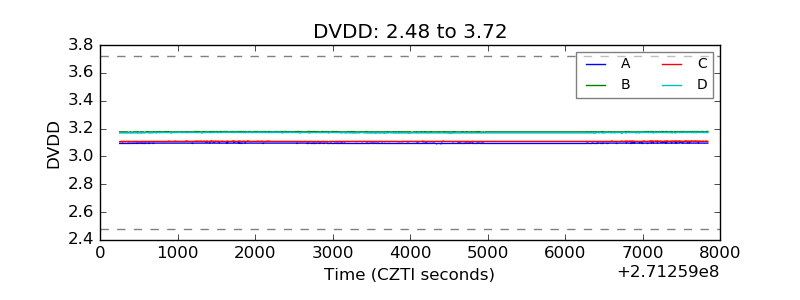 |
| Temperature 1 | 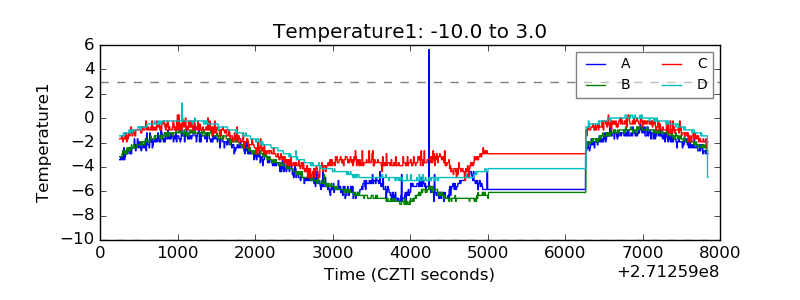 |
| Veto HV Monitor |  |
| Veto LLD | 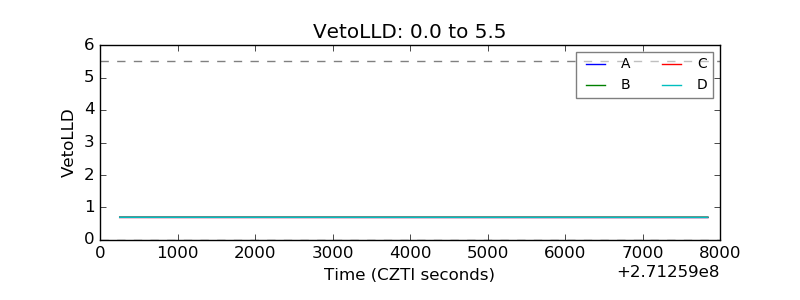 |
| Alpha Counter | 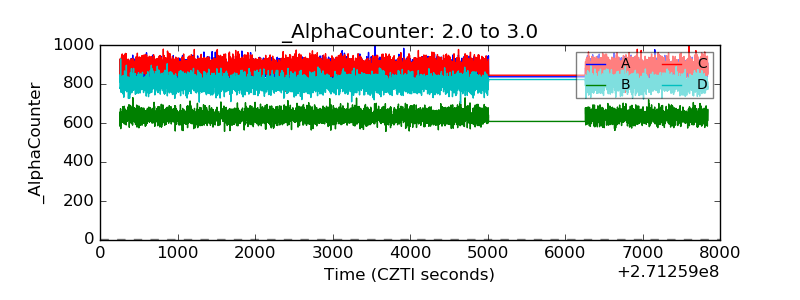 |
| _CPM_Rate | 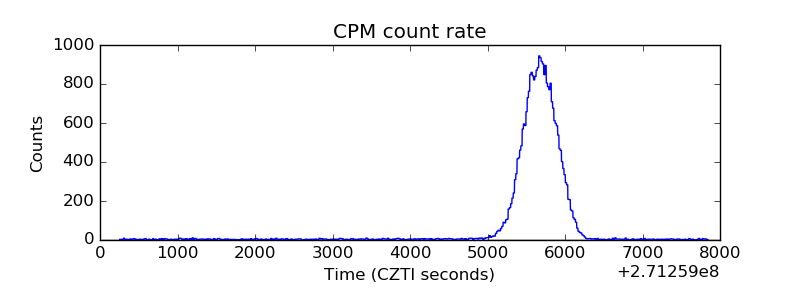 |
| CZT Counter | 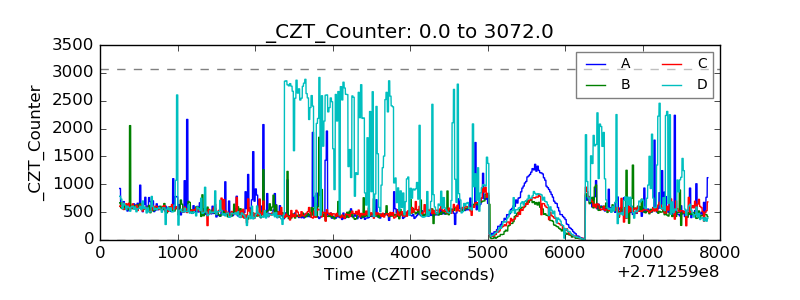 |
| +2.5 Volts monitor |  |
| +5 Volts monitor |  |
| _ROLL_ROT | 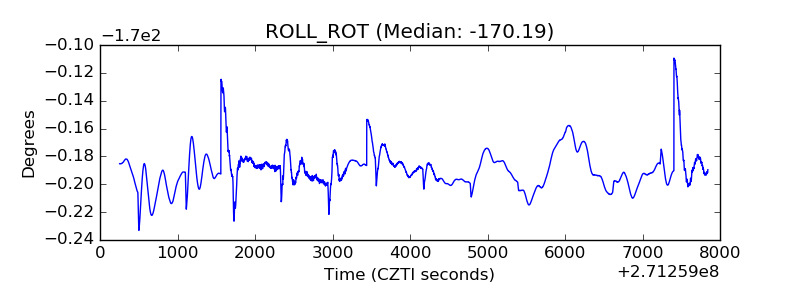 |
| _Roll_DEC | 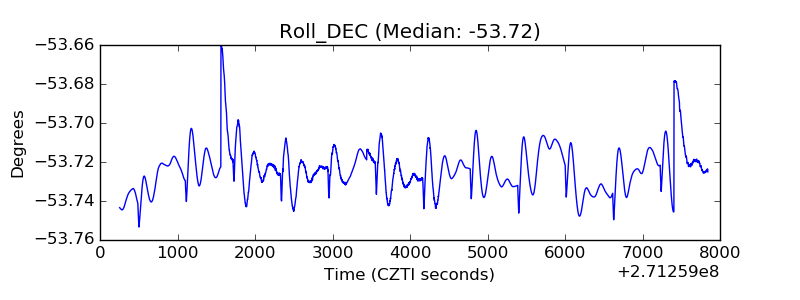 |
| _Roll_RA | 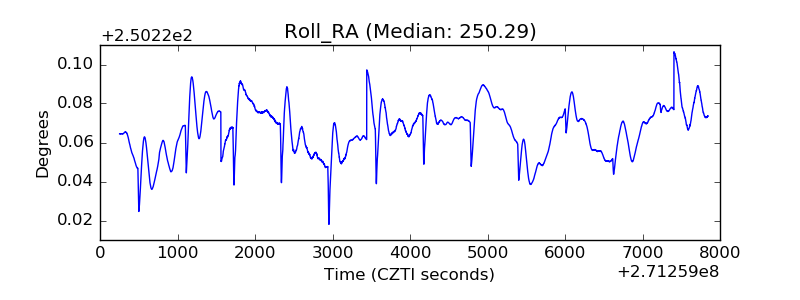 |
| Veto Counter | 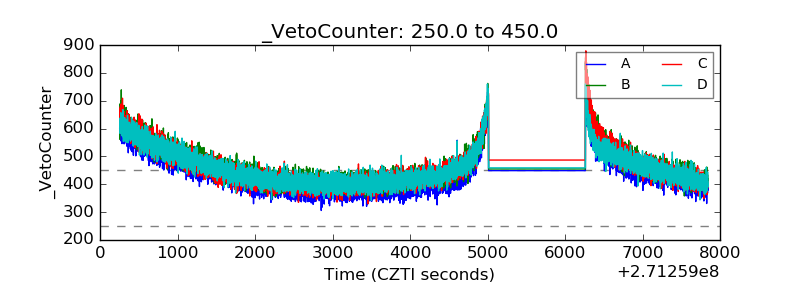 |