| Param | Original file | Final file |
|---|---|---|
| Filename | modeM0/AS1A04_203T01_9000002284cztM0_level2.fits | modeM0/AS1A04_203T01_9000002284cztM0_level2_quad_clean.evt |
| Size (bytes) | 826,522,560 | 714,320,640 |
| Size | 788.2 MB | 681.2 MB |
| Events in quadrant A | 5,127,612 | 4,181,876 |
| Events in quadrant B | 4,910,798 | 4,186,157 |
| Events in quadrant C | 4,998,306 | 3,976,580 |
| Events in quadrant D | 4,332,554 | 3,625,957 |
| Mode M0 | |||
|---|---|---|---|
| Quadrant | BADHDUFLAG | Total packets | Discarded packets |
| A | 0 | 177496 | 0 |
| B | 0 | 178378 | 0 |
| C | 0 | 181205 | 0 |
| D | 0 | 219466 | 0 |
| Mode SS | |||
|---|---|---|---|
| Quadrant | BADHDUFLAG | Total packets | Discarded packets |
| A | 0 | 1678 | 0 |
| B | 0 | 1678 | 0 |
| C | 0 | 1678 | 0 |
| D | 0 | 1678 | 0 |
| Mode M9 | |||
|---|---|---|---|
| Quadrant | BADHDUFLAG | Total packets | Discarded packets |
| A | 0 | 152 | 0 |
| B | 0 | 152 | 0 |
| C | 0 | 152 | 0 |
| D | 0 | 152 | 0 |
| Quadrant | Total seconds | Saturated seconds | Saturation percentage |
|---|---|---|---|
| A | 82594 | 1201 | 1.454101% |
| B | 82594 | 1219 | 1.475894% |
| C | 82594 | 902 | 1.092089% |
| D | 82594 | 3605 | 4.364724% |
Noise dominated data is calculated using 1-second bins in cleaned event files. If a bin has >2000 counts, and if more than 50% of those come from <1% of pixels, then it is considered to be noise-dominated and hence unusable.
| Quadrant | # 1 sec bins | Bins with >0 counts | Bins with >2000 counts | High rate bins dominated by noise | Noise dominated (total time) | Noise dominated (detector-on time) | Marked lightcurve |
|---|---|---|---|---|---|---|---|
| A | 96439 | 82587 | 0 | 0 | 0.00% | 0.00% | 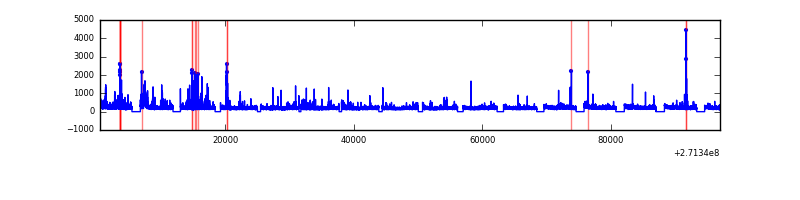 |
| B | 96439 | 82589 | 0 | 0 | 0.00% | 0.00% | 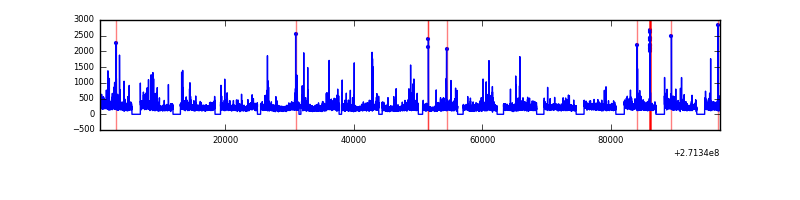 |
| C | 96440 | 82590 | 0 | 0 | 0.00% | 0.00% |  |
| D | 96439 | 82561 | 0 | 0 | 0.00% | 0.00% | 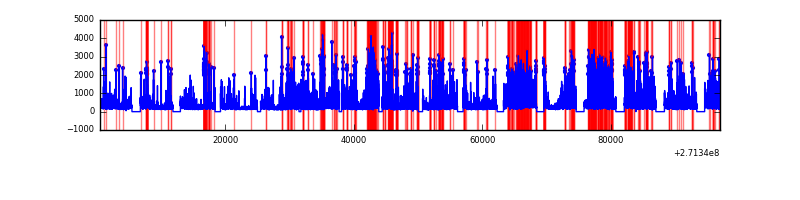 |
Top three noisy pixels from each quadrant. If the there are fewer than three noisy pixels in the level2.evt file, extra rows are filled as -1
| Pixel properties | Quadrant properties | ||||||
|---|---|---|---|---|---|---|---|
| Quadrant | DetID | PixID | Counts | Sigma | Mean | Median | Sigma |
| A | 0 | 29 | 4948 | 11.38 | 1335 | 1253 | 324.6 |
| A | 7 | 110 | 4029 | 8.55 | 1335 | 1253 | 324.6 |
| A | 9 | 19 | 3879 | 8.09 | 1335 | 1253 | 324.6 |
| B | 2 | 9 | 3955 | 10.68 | 1296 | 1238 | 254.4 |
| B | 2 | 8 | 3394 | 8.48 | 1296 | 1238 | 254.4 |
| B | 5 | 225 | 3330 | 8.22 | 1296 | 1238 | 254.4 |
| C | 1 | 80 | 3735 | 7.34 | 1322 | 1234 | 340.7 |
| C | 1 | 81 | 3638 | 7.06 | 1322 | 1234 | 340.7 |
| C | 12 | 241 | 3421 | 6.42 | 1322 | 1234 | 340.7 |
| D | 6 | 231 | 3123 | 6.09 | 1238 | 1130 | 327.3 |
| D | 3 | 14 | 3109 | 6.05 | 1238 | 1130 | 327.3 |
| D | 10 | 189 | 3044 | 5.85 | 1238 | 1130 | 327.3 |
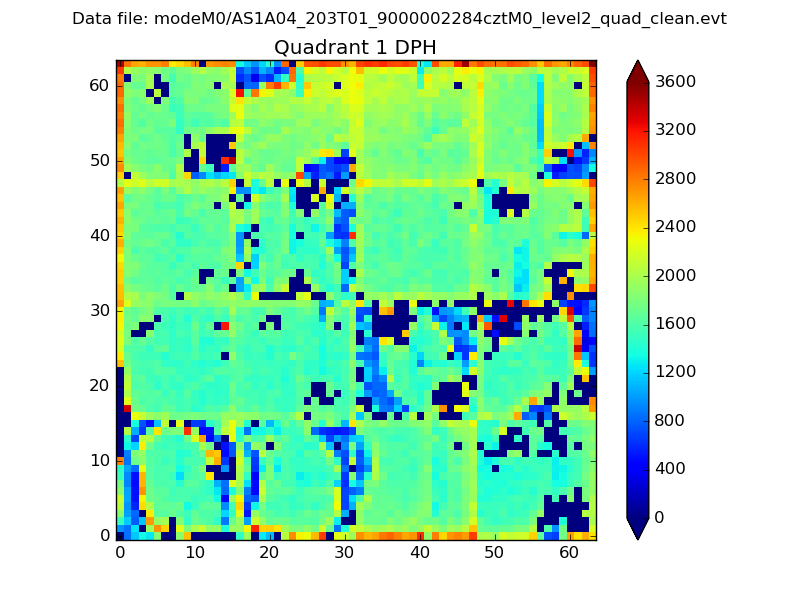
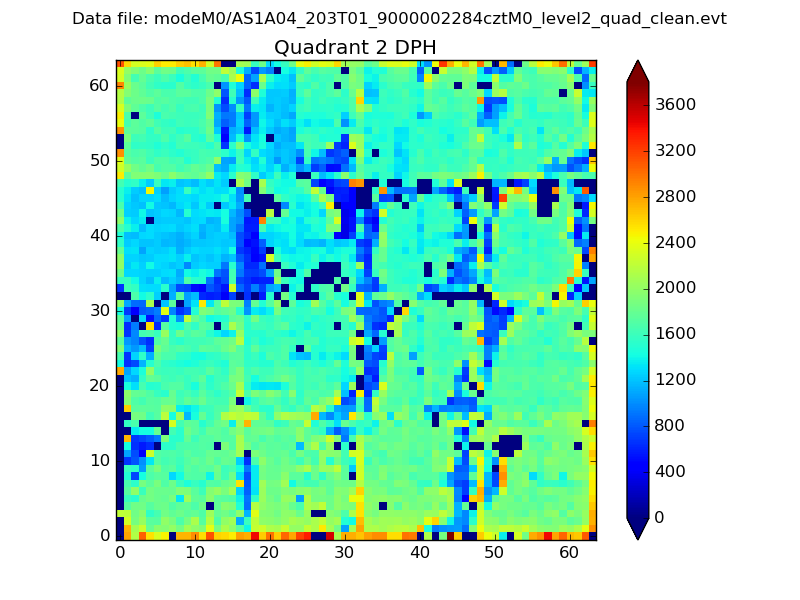
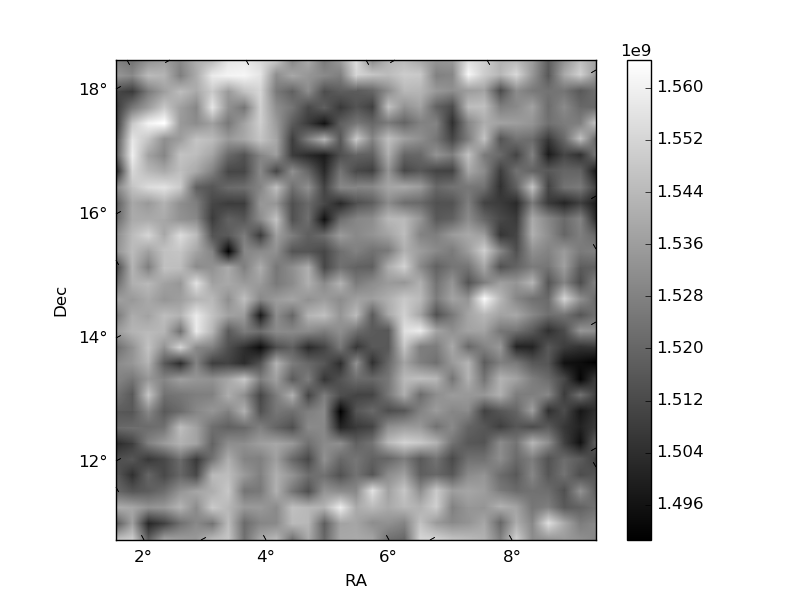
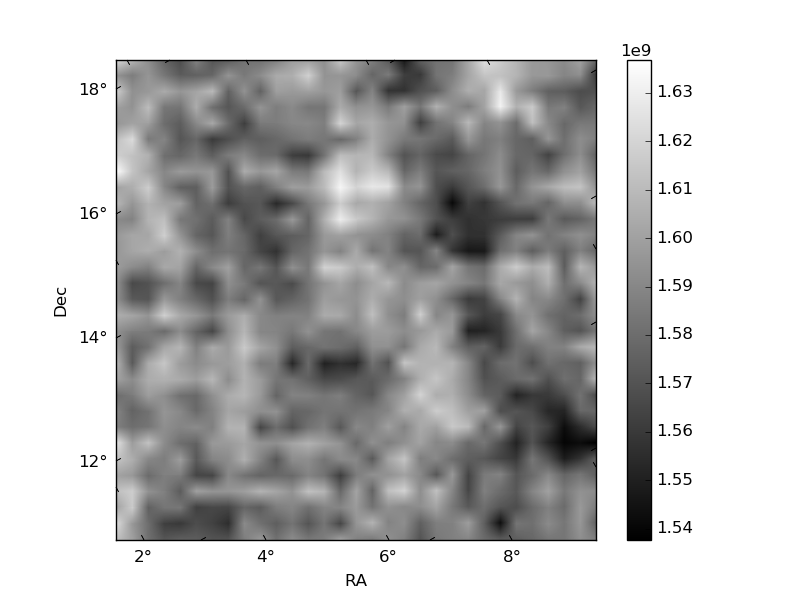
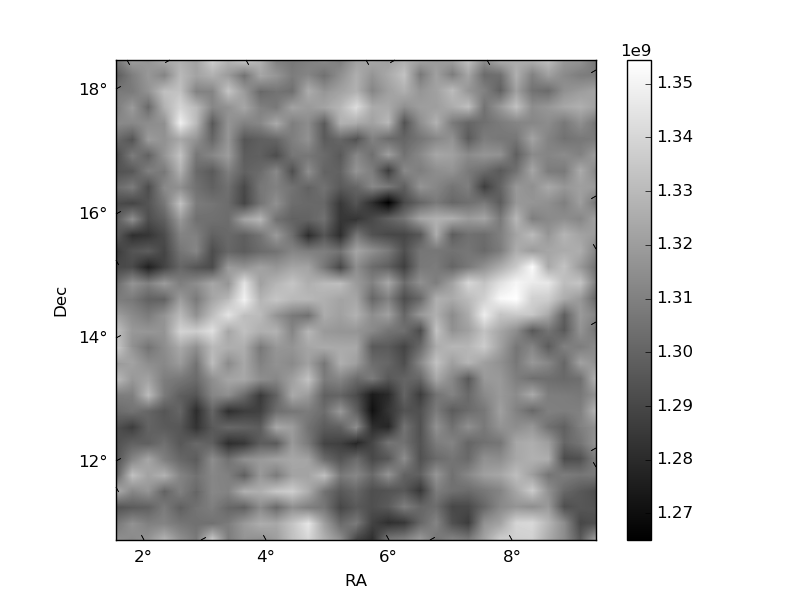
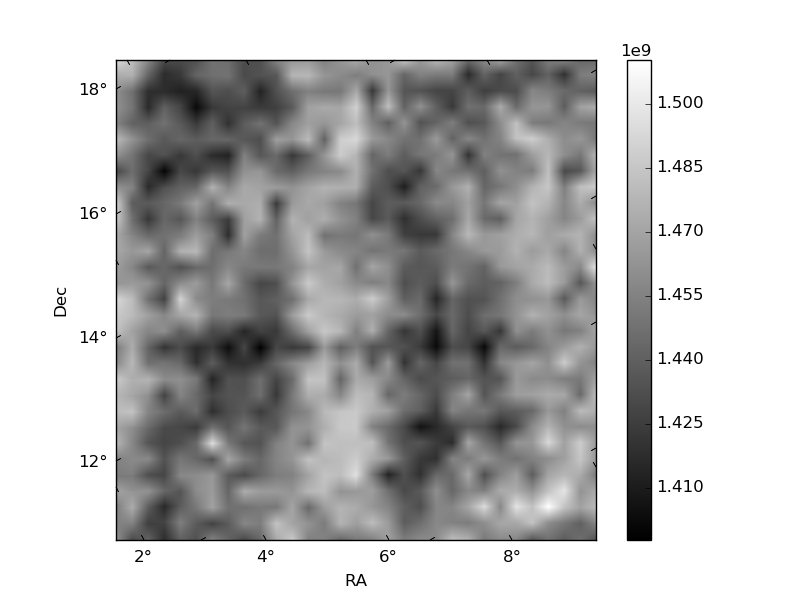
Histogram calculated using DETX and DETY for each event in the final _common_clean file
| Quadrant A | 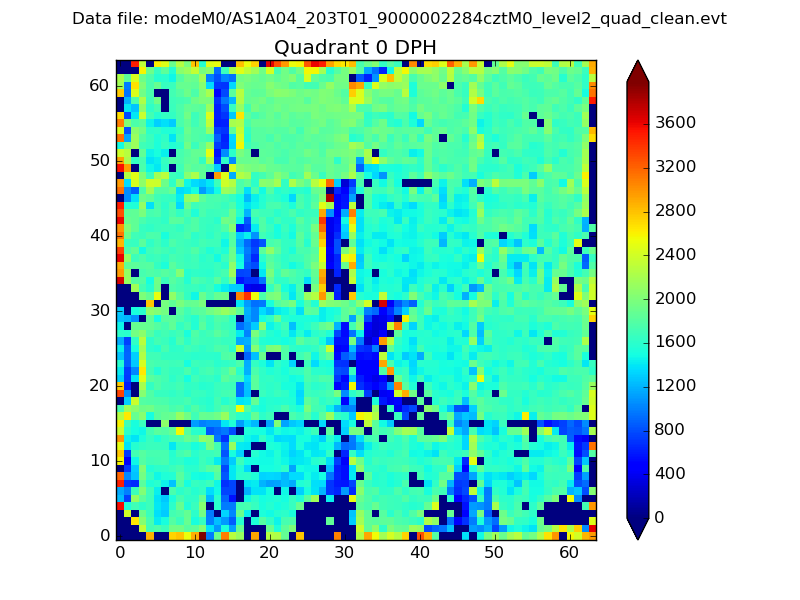 |
 |
Quadrant B |
|---|---|---|---|
| Quadrant D | 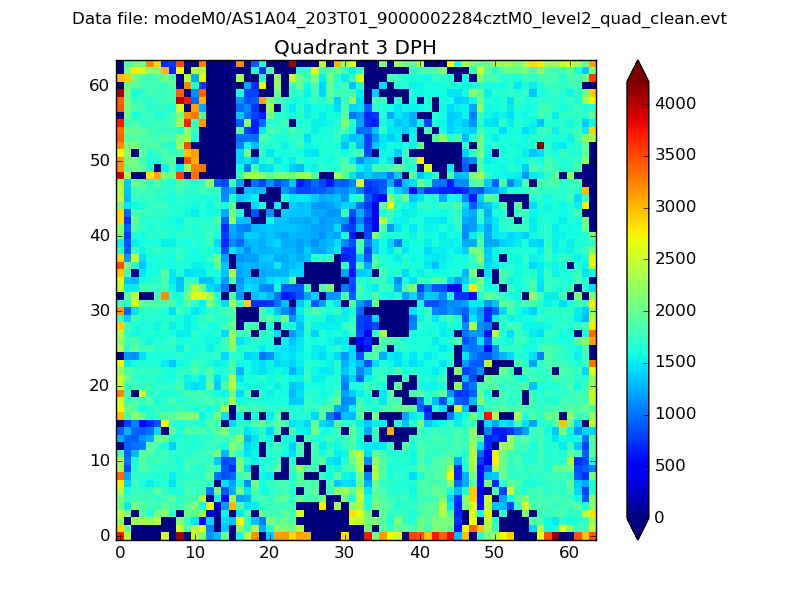 |
 |
Quadrant C |
| Plot type | Count rate plots | Images |
|---|---|---|
| Comparison with Poisson distribution Blue bars denote a histogram of data divided into 1 sec bins. Red curve is a Poisson curve with rate = median count rate of data. |
 |
 |
| Quadrant-wise count rates Data is divided into 100 sec bins |
 |
|
| Module-wise count rates for Quadrant A Data is divided into 100 sec bins |
 |
 |
| Module-wise count rates for Quadrant B Data is divided into 100 sec bins |
 |
 |
| Module-wise count rates for Quadrant C Data is divided into 100 sec bins |
 |
 |
| Module-wise count rates for Quadrant D Data is divided into 100 sec bins |
 |
 |
| Parameter | Plot |
|---|---|
| CZT HV Monitor | 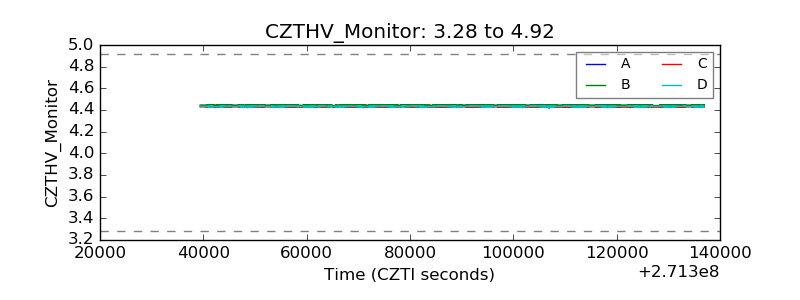 |
| D_VDD |  |
| Temperature 1 |  |
| Veto HV Monitor |  |
| Veto LLD | 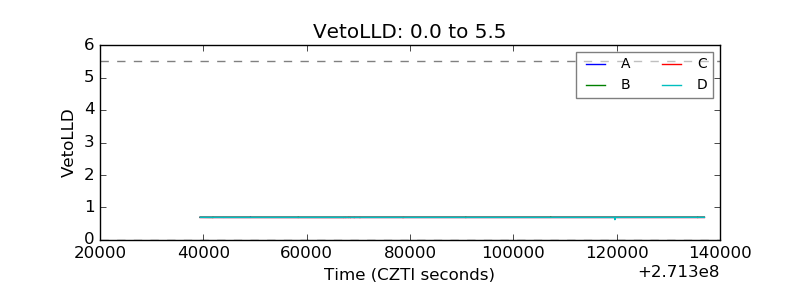 |
| Alpha Counter |  |
| _CPM_Rate | 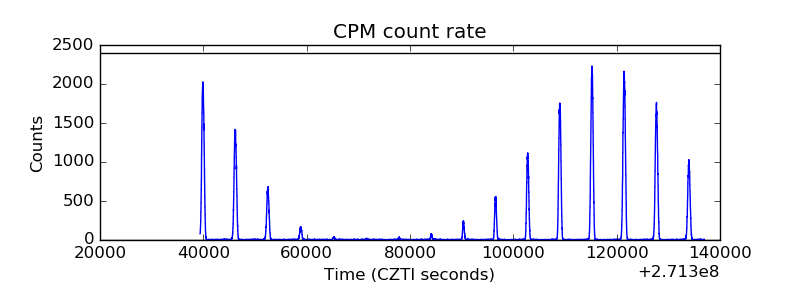 |
| CZT Counter | 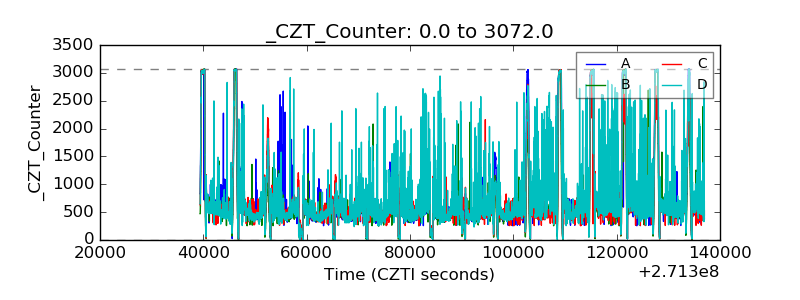 |
| +2.5 Volts monitor | 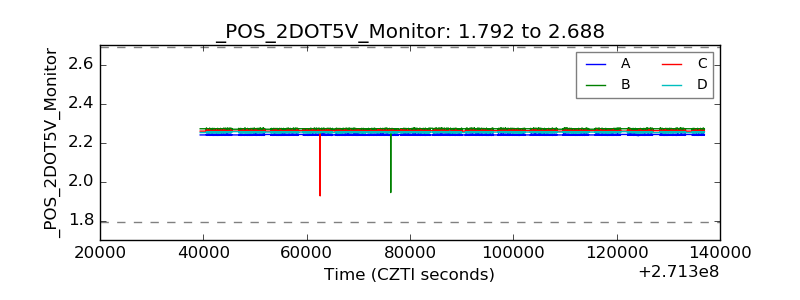 |
| +5 Volts monitor | 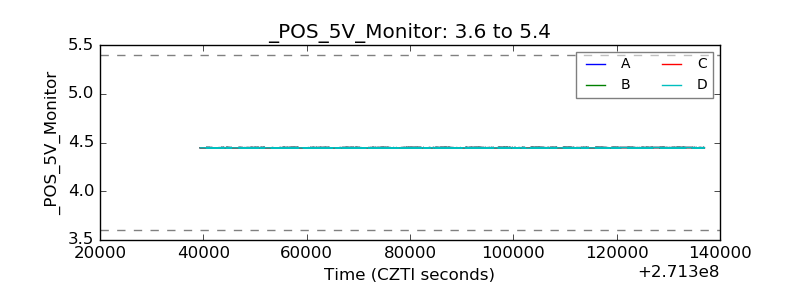 |
| _ROLL_ROT | 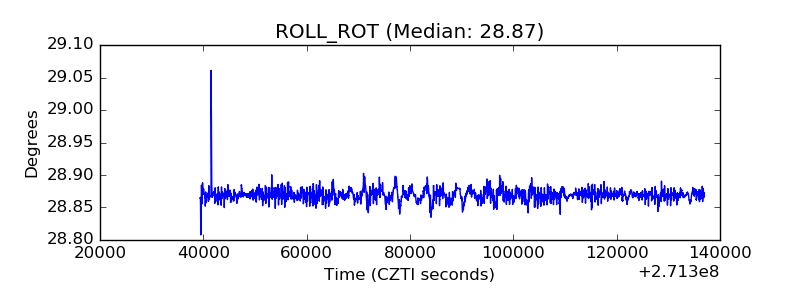 |
| _Roll_DEC |  |
| _Roll_RA | 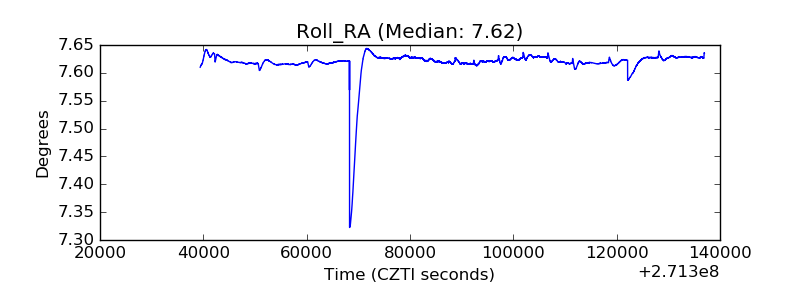 |
| Veto Counter | 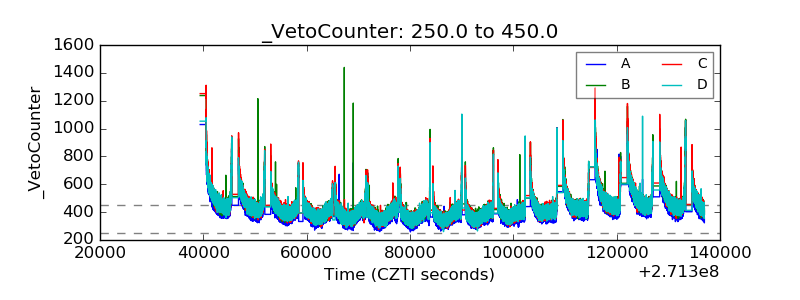 |