| Param | Original file | Final file |
|---|---|---|
| Filename | modeM0/AS1A04_203T01_9000002284_15458cztM0_level2.evt | modeM0/AS1A04_203T01_9000002284_15458cztM0_level2_quad_clean.evt |
| Size (bytes) | 125,216,640 | 36,676,800 |
| Size | 119.4 MB | 35.0 MB |
| Events in quadrant A | 946,691 | 252,095 |
| Events in quadrant B | 932,604 | 258,202 |
| Events in quadrant C | 899,107 | 250,339 |
| Events in quadrant D | 910,742 | 240,138 |
| Mode M0 | |||
|---|---|---|---|
| Quadrant | BADHDUFLAG | Total packets | Discarded packets |
| A | 0 | 3852 | 2 |
| B | 0 | 3853 | 1 |
| C | 0 | 3697 | 1 |
| D | 0 | 3619 | 1 |
| Mode SS | |||
|---|---|---|---|
| Quadrant | BADHDUFLAG | Total packets | Discarded packets |
| A | 0 | 30 | 0 |
| B | 0 | 30 | 0 |
| C | 0 | 30 | 0 |
| D | 0 | 30 | 0 |
| Mode M9 | |||
|---|---|---|---|
| Quadrant | BADHDUFLAG | Total packets | Discarded packets |
| A | 0 | 12 | 0 |
| B | 0 | 12 | 0 |
| C | 0 | 12 | 0 |
| D | 0 | 12 | 0 |
| Quadrant | Total seconds | Saturated seconds | Saturation percentage |
|---|---|---|---|
| A | 1476 | 30 | 2.032520% |
| B | 1476 | 28 | 1.897019% |
| C | 1476 | 18 | 1.219512% |
| D | 1476 | 32 | 2.168022% |
Noise dominated data is calculated using 1-second bins in cleaned event files. If a bin has >2000 counts, and if more than 50% of those come from <1% of pixels, then it is considered to be noise-dominated and hence unusable.
| Quadrant | # 1 sec bins | Bins with >0 counts | Bins with >2000 counts | High rate bins dominated by noise | Noise dominated (total time) | Noise dominated (detector-on time) | Marked lightcurve |
|---|---|---|---|---|---|---|---|
| A | 1477 | 1477 | 3 | 3 | 0.20% | 0.20% | 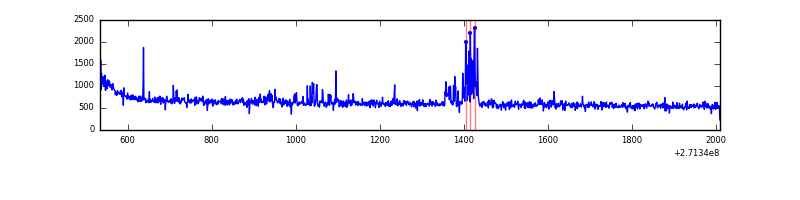 |
| B | 1477 | 1477 | 1 | 1 | 0.07% | 0.07% | 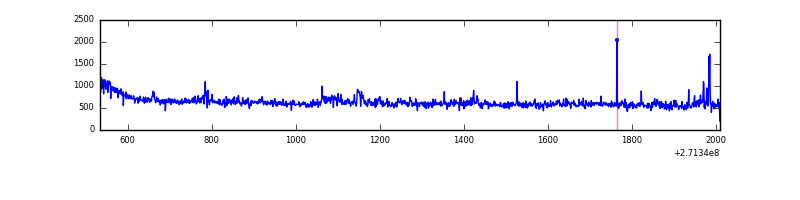 |
| C | 1477 | 1477 | 0 | 0 | 0.00% | 0.00% | 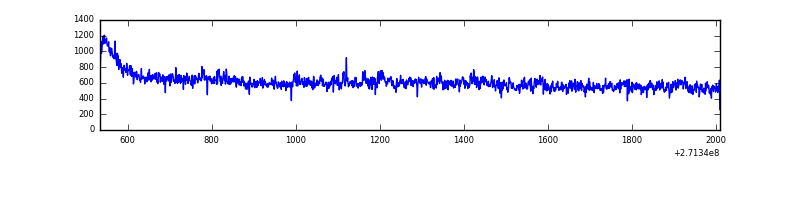 |
| D | 1477 | 1477 | 9 | 9 | 0.61% | 0.61% | 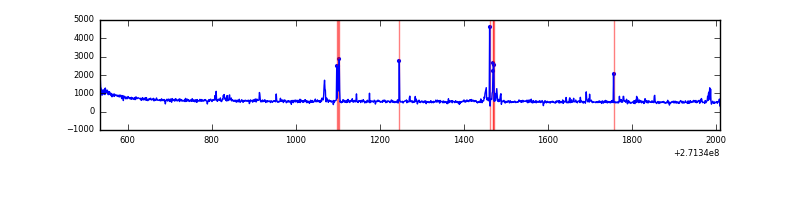 |
Top three noisy pixels from each quadrant. If the there are fewer than three noisy pixels in the level2.evt file, extra rows are filled as -1
| Pixel properties | Quadrant properties | ||||||
|---|---|---|---|---|---|---|---|
| Quadrant | DetID | PixID | Counts | Sigma | Mean | Median | Sigma |
| A | 13 | 248 | 31154 | 653.86 | 230 | 225 | 47.3 |
| A | 14 | 238 | 14172 | 294.85 | 230 | 225 | 47.3 |
| A | 14 | 237 | 7387 | 151.41 | 230 | 225 | 47.3 |
| B | 0 | 230 | 20023 | 451.67 | 225 | 221 | 43.8 |
| B | 3 | 209 | 11614 | 259.86 | 225 | 221 | 43.8 |
| B | 0 | 229 | 5886 | 129.21 | 225 | 221 | 43.8 |
| C | 3 | 233 | 49013 | 965.17 | 217 | 219 | 50.6 |
| C | 0 | 207 | 1638 | 28.07 | 217 | 219 | 50.6 |
| C | 13 | 61 | 1629 | 27.89 | 217 | 219 | 50.6 |
| D | 2 | 33 | 45562 | 813.9 | 222 | 216 | 55.7 |
| D | 7 | 38 | 12075 | 212.85 | 222 | 216 | 55.7 |
| D | 2 | 234 | 5441 | 93.78 | 222 | 216 | 55.7 |
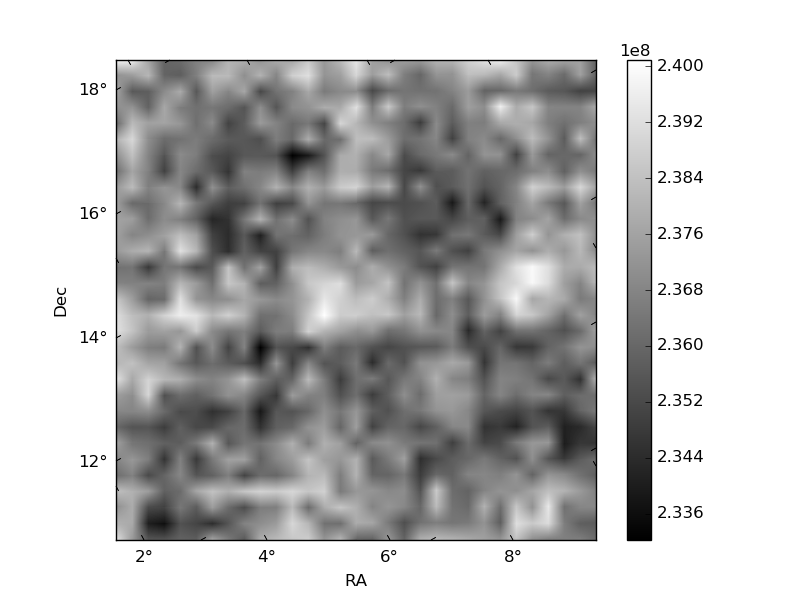
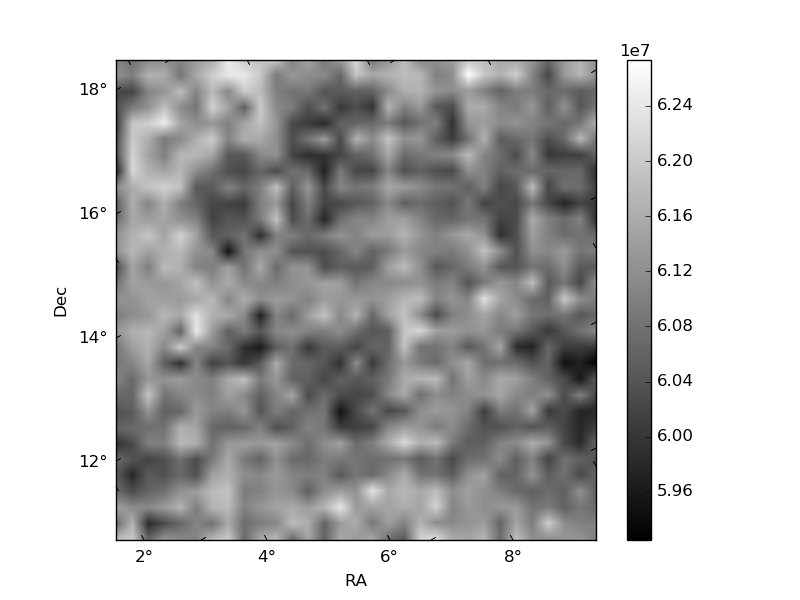
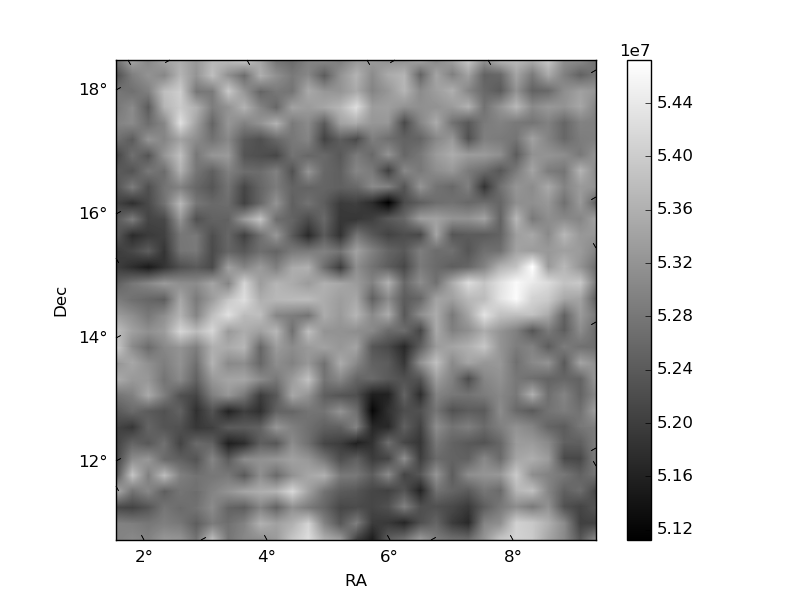
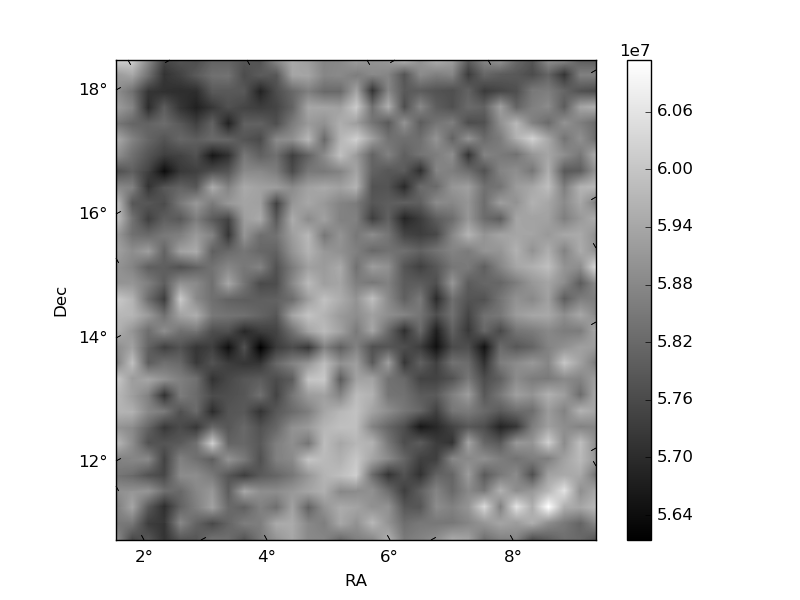
Histogram calculated using DETX and DETY for each event in the final _common_clean file
| Quadrant A | 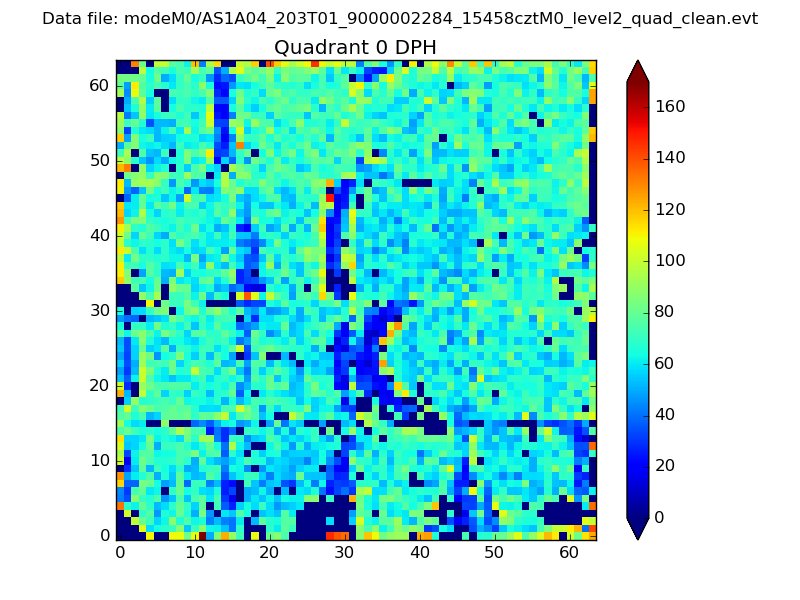 |
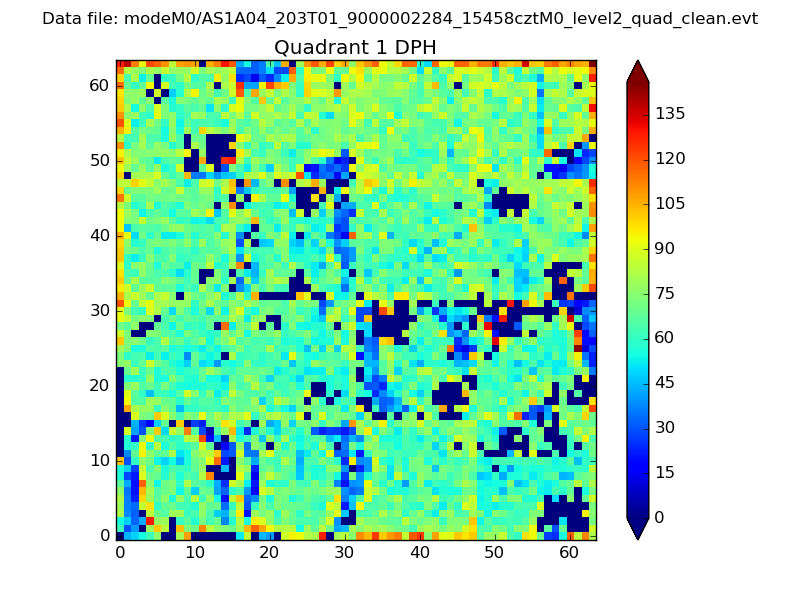 |
Quadrant B |
|---|---|---|---|
| Quadrant D | 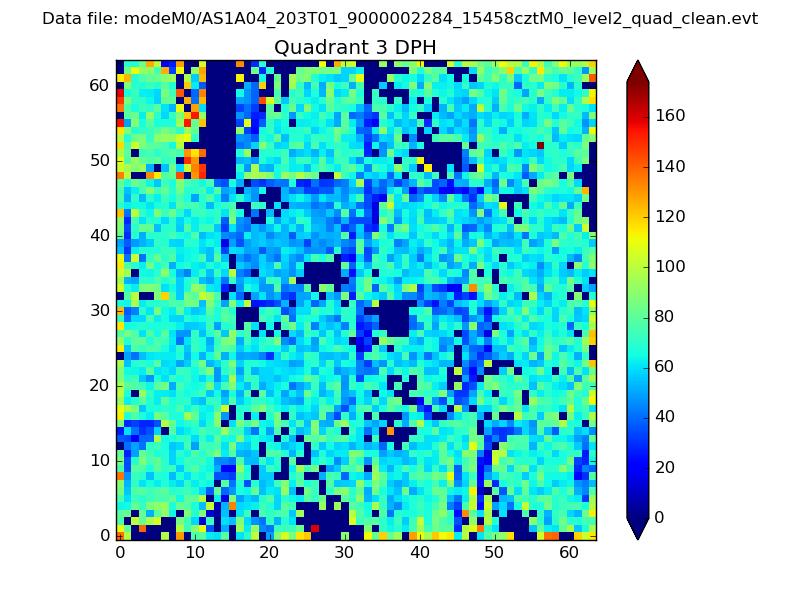 |
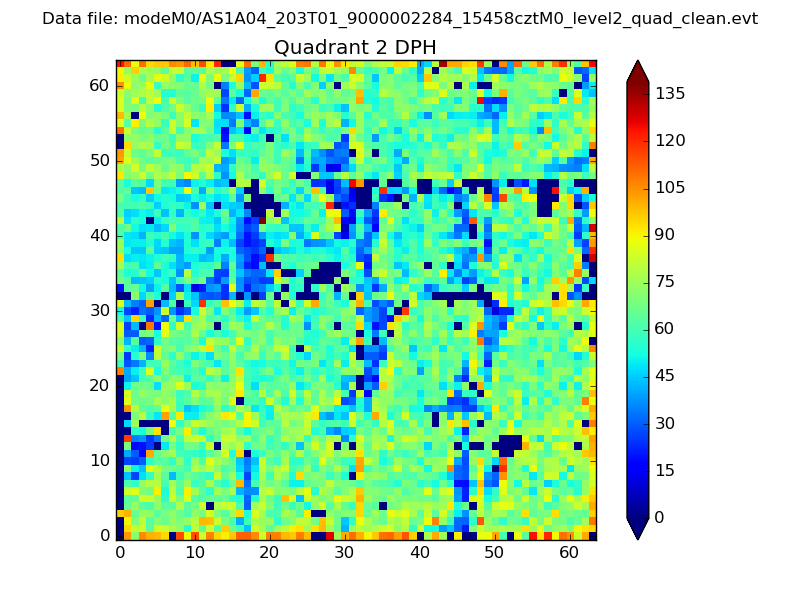 |
Quadrant C |
| Plot type | Count rate plots | Images |
|---|---|---|
| Comparison with Poisson distribution Blue bars denote a histogram of data divided into 1 sec bins. Red curve is a Poisson curve with rate = median count rate of data. |
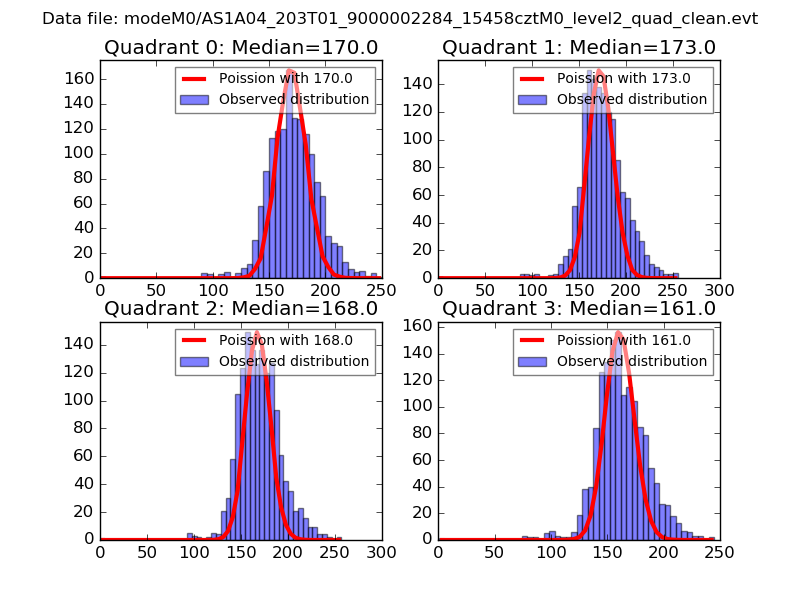 |
 |
| Quadrant-wise count rates Data is divided into 100 sec bins |
 |
|
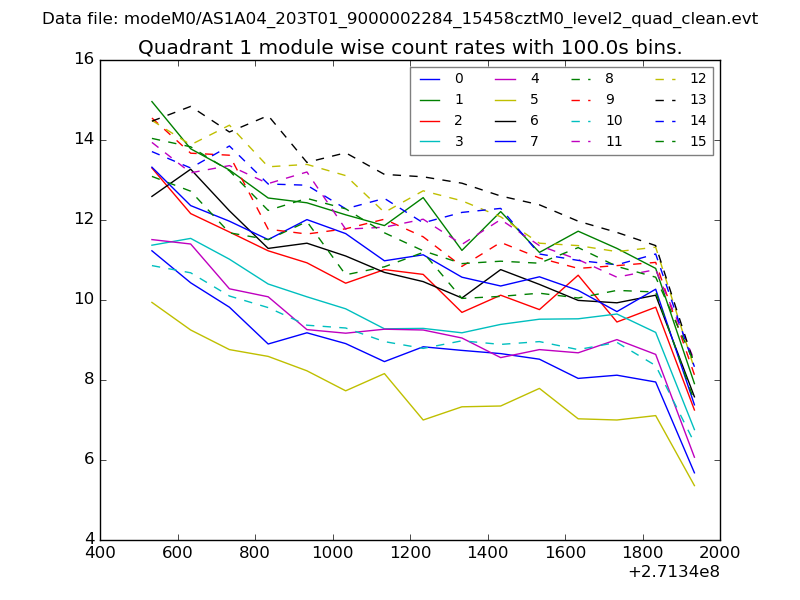
| Module-wise count rates for Quadrant A Data is divided into 100 sec bins |
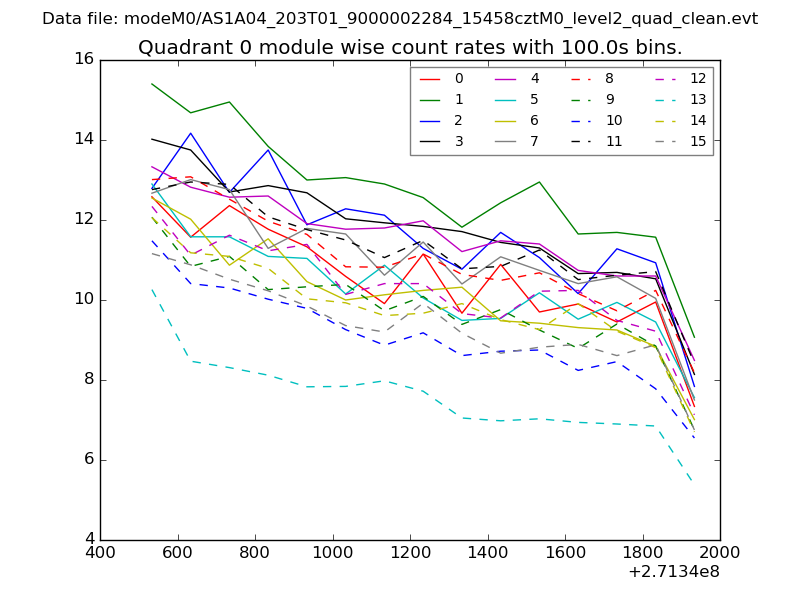 |
 |
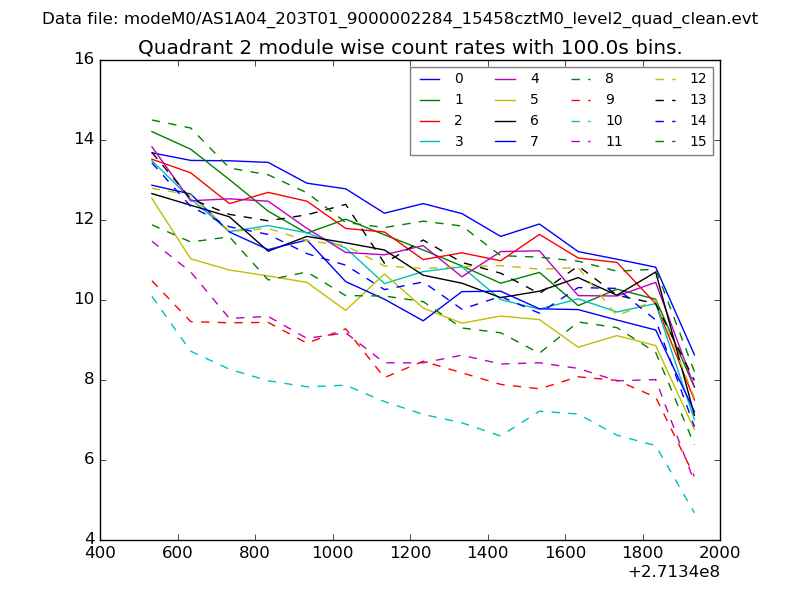
| Module-wise count rates for Quadrant B Data is divided into 100 sec bins |
 |
 |
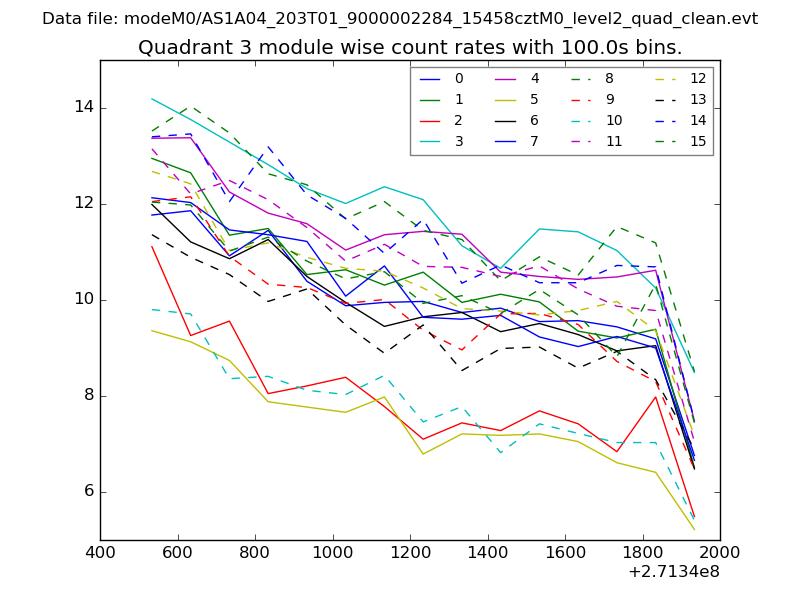
| Module-wise count rates for Quadrant C Data is divided into 100 sec bins |
 |
 |
| Module-wise count rates for Quadrant D Data is divided into 100 sec bins |
 |
 |
| Parameter | Plot |
|---|---|
| CZT HV Monitor | 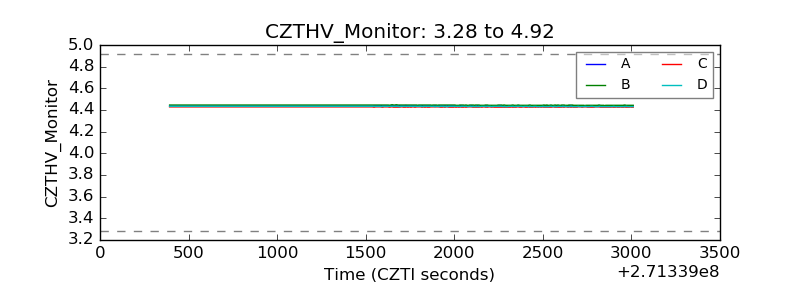 |
| D_VDD | 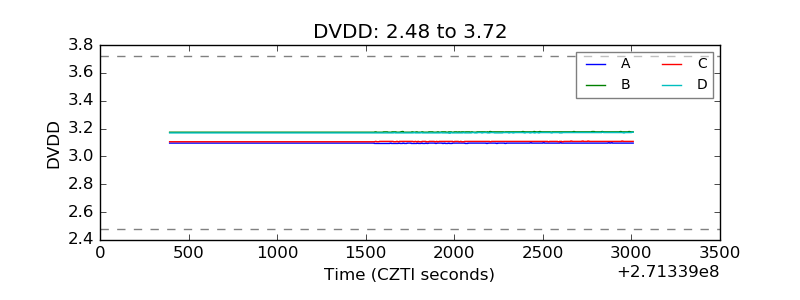 |
| Temperature 1 |  |
| Veto HV Monitor | 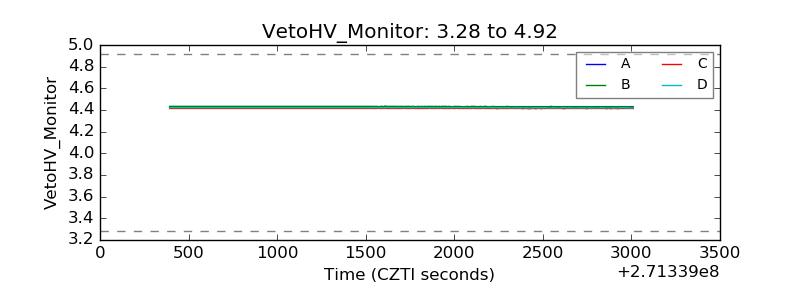 |
| Veto LLD | 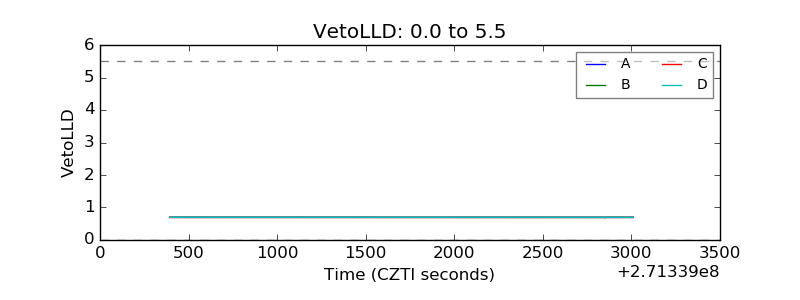 |
| Alpha Counter | 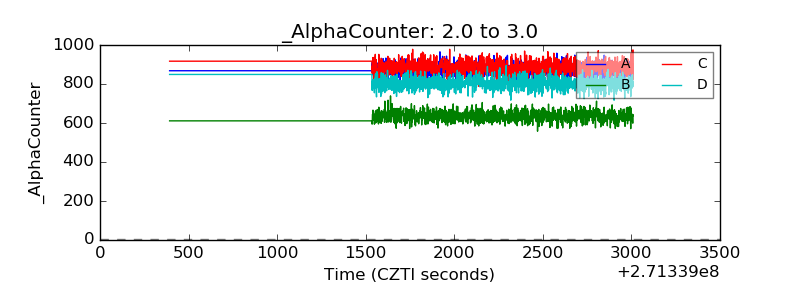 |
| _CPM_Rate | 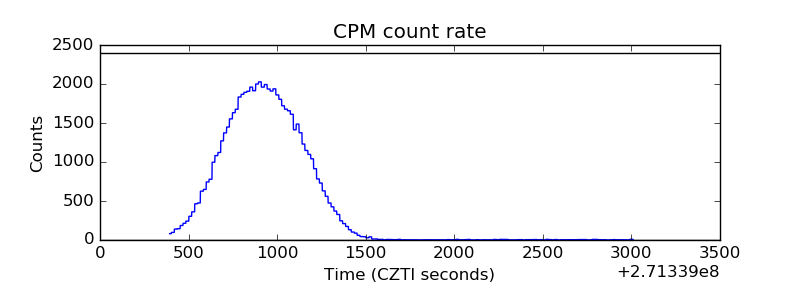 |
| CZT Counter | 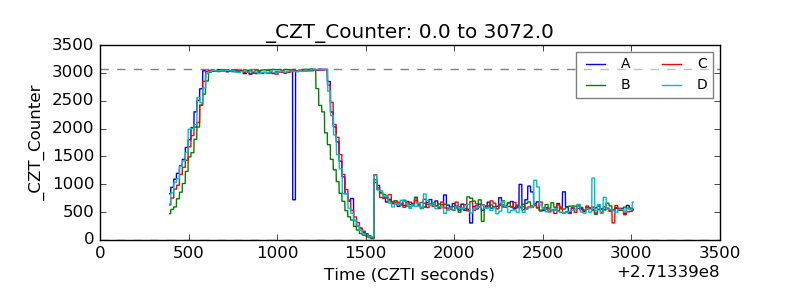 |
| +2.5 Volts monitor |  |
| +5 Volts monitor |  |
| _ROLL_ROT | 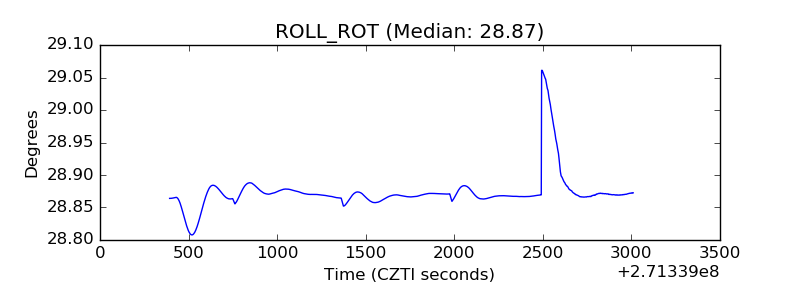 |
| _Roll_DEC | 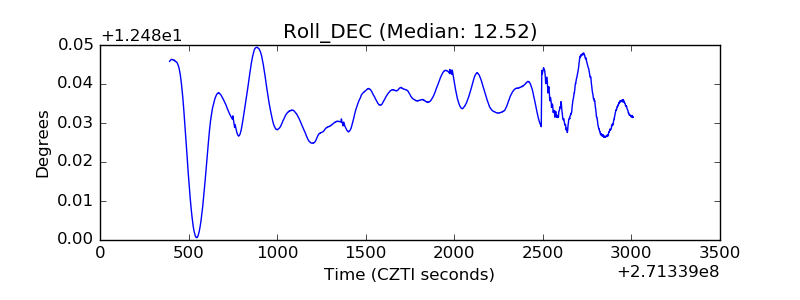 |
| _Roll_RA | 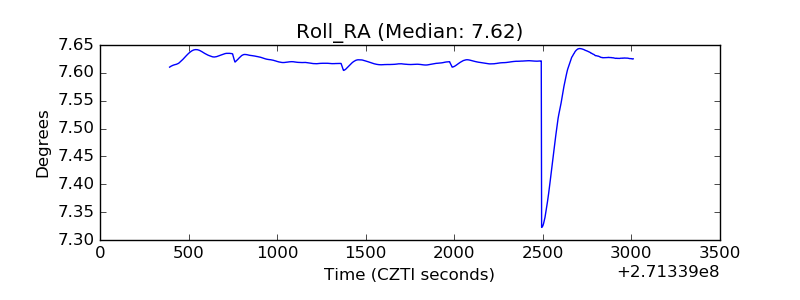 |
| Veto Counter | 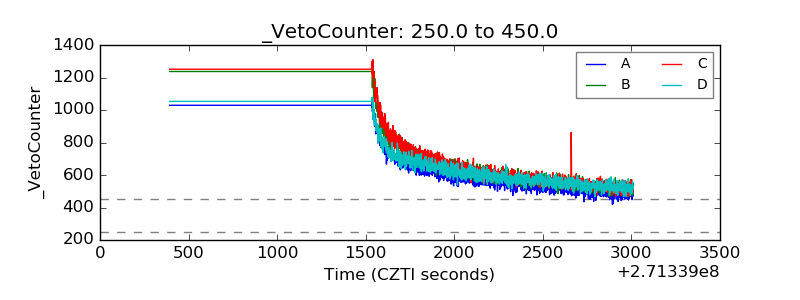 |