| Param | Original file | Final file |
|---|---|---|
| Filename | modeM0/AS1A04_203T01_9000002284_15461cztM0_level2.evt | modeM0/AS1A04_203T01_9000002284_15461cztM0_level2_quad_clean.evt |
| Size (bytes) | 514,082,880 | 82,788,480 |
| Size | 490.3 MB | 79.0 MB |
| Events in quadrant A | 3,823,715 | 510,066 |
| Events in quadrant B | 3,480,649 | 523,050 |
| Events in quadrant C | 3,935,544 | 513,079 |
| Events in quadrant D | 3,872,257 | 491,290 |
| Mode M0 | |||
|---|---|---|---|
| Quadrant | BADHDUFLAG | Total packets | Discarded packets |
| A | 0 | 15547 | 3 |
| B | 0 | 14508 | 2 |
| C | 0 | 16238 | 2 |
| D | 0 | 15705 | 2 |
| Mode SS | |||
|---|---|---|---|
| Quadrant | BADHDUFLAG | Total packets | Discarded packets |
| A | 0 | 138 | 0 |
| B | 0 | 138 | 0 |
| C | 0 | 138 | 0 |
| D | 0 | 138 | 0 |
| Mode M9 | |||
|---|---|---|---|
| Quadrant | BADHDUFLAG | Total packets | Discarded packets |
| A | 0 | 18 | 0 |
| B | 0 | 18 | 0 |
| C | 0 | 18 | 0 |
| D | 0 | 19 | 0 |
| Quadrant | Total seconds | Saturated seconds | Saturation percentage |
|---|---|---|---|
| A | 6730 | 194 | 2.882615% |
| B | 6730 | 99 | 1.471025% |
| C | 6730 | 83 | 1.233284% |
| D | 6730 | 178 | 2.644874% |
Noise dominated data is calculated using 1-second bins in cleaned event files. If a bin has >2000 counts, and if more than 50% of those come from <1% of pixels, then it is considered to be noise-dominated and hence unusable.
| Quadrant | # 1 sec bins | Bins with >0 counts | Bins with >2000 counts | High rate bins dominated by noise | Noise dominated (total time) | Noise dominated (detector-on time) | Marked lightcurve |
|---|---|---|---|---|---|---|---|
| A | 7586 | 6732 | 94 | 94 | 1.24% | 1.40% | 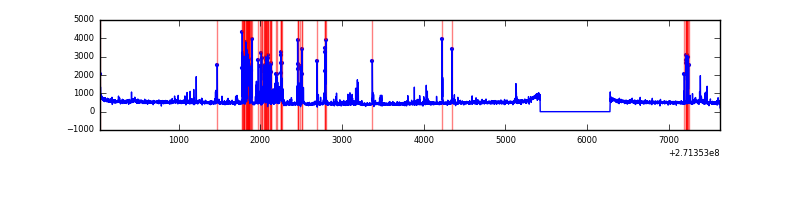 |
| B | 7586 | 6732 | 2 | 2 | 0.03% | 0.03% | 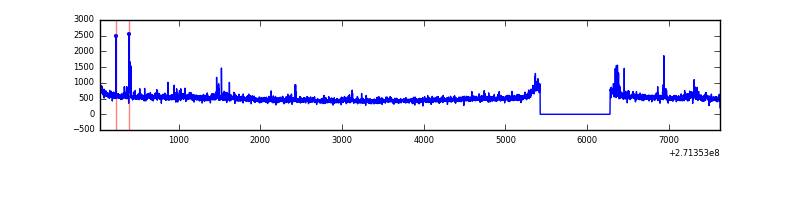 |
| C | 7586 | 6732 | 1 | 1 | 0.01% | 0.01% | 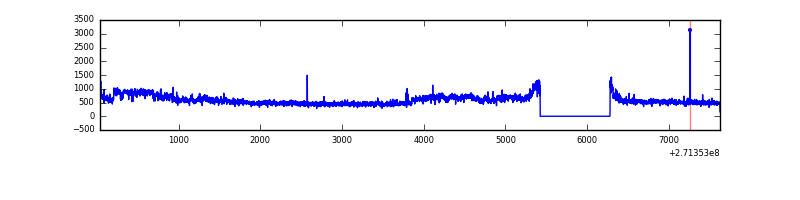 |
| D | 7586 | 6732 | 94 | 94 | 1.24% | 1.40% | 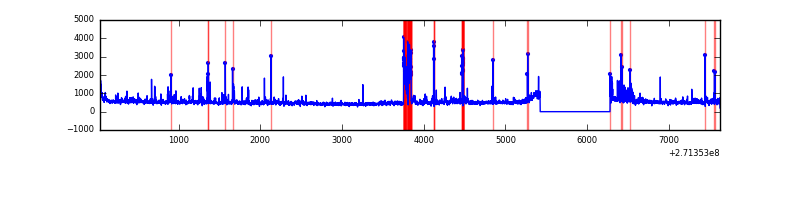 |
Top three noisy pixels from each quadrant. If the there are fewer than three noisy pixels in the level2.evt file, extra rows are filled as -1
| Pixel properties | Quadrant properties | ||||||
|---|---|---|---|---|---|---|---|
| Quadrant | DetID | PixID | Counts | Sigma | Mean | Median | Sigma |
| A | 14 | 238 | 341339 | 1979.3 | 844 | 825 | 172.0 |
| A | 14 | 237 | 111150 | 641.29 | 844 | 825 | 172.0 |
| A | 12 | 96 | 54048 | 309.37 | 844 | 825 | 172.0 |
| B | 0 | 230 | 44200 | 266.2 | 848 | 826 | 162.9 |
| B | 0 | 229 | 28623 | 170.6 | 848 | 826 | 162.9 |
| B | 0 | 189 | 27231 | 162.06 | 848 | 826 | 162.9 |
| C | 3 | 233 | 704474 | 3682.93 | 825 | 831 | 191.1 |
| C | 9 | 54 | 6833 | 31.42 | 825 | 831 | 191.1 |
| C | 13 | 61 | 5970 | 26.9 | 825 | 831 | 191.1 |
| D | 1 | 52 | 208639 | 1030.7 | 826 | 802 | 201.6 |
| D | 2 | 33 | 207718 | 1026.13 | 826 | 802 | 201.6 |
| D | 5 | 222 | 131088 | 646.11 | 826 | 802 | 201.6 |
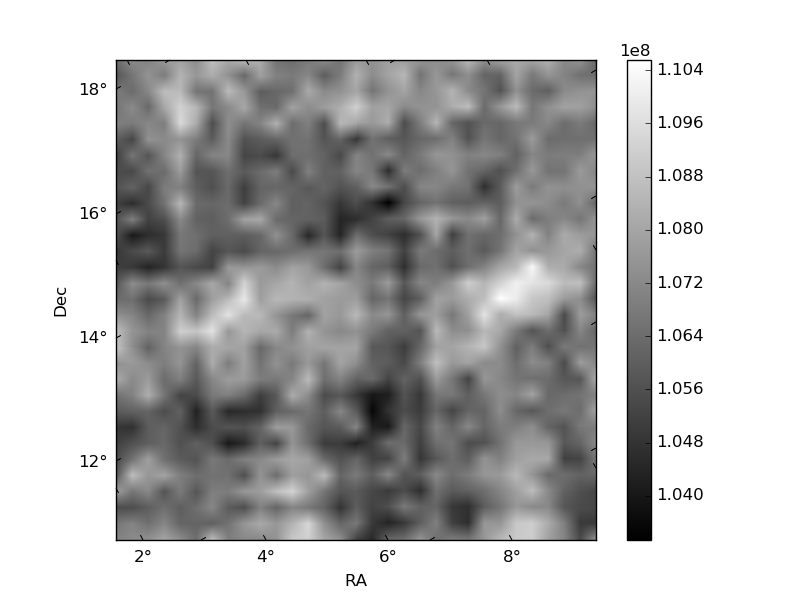
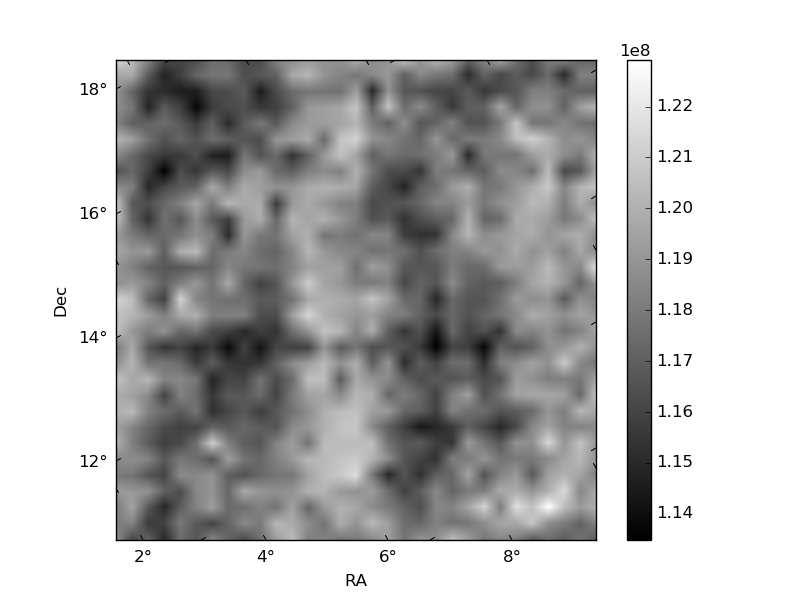
Histogram calculated using DETX and DETY for each event in the final _common_clean file
| Quadrant A |  |
 |
Quadrant B |
|---|---|---|---|
| Quadrant D |  |
 |
Quadrant C |
| Plot type | Count rate plots | Images |
|---|---|---|
| Comparison with Poisson distribution Blue bars denote a histogram of data divided into 1 sec bins. Red curve is a Poisson curve with rate = median count rate of data. |
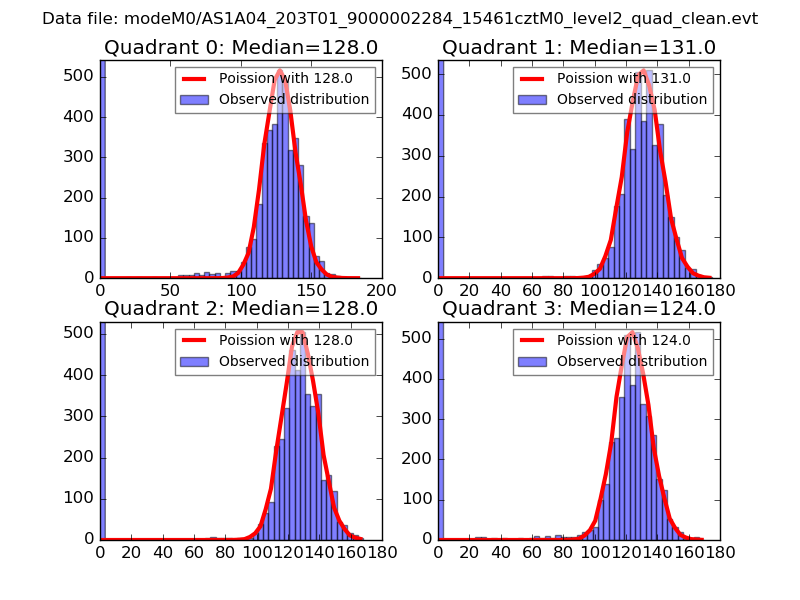 |
 |
| Quadrant-wise count rates Data is divided into 100 sec bins |
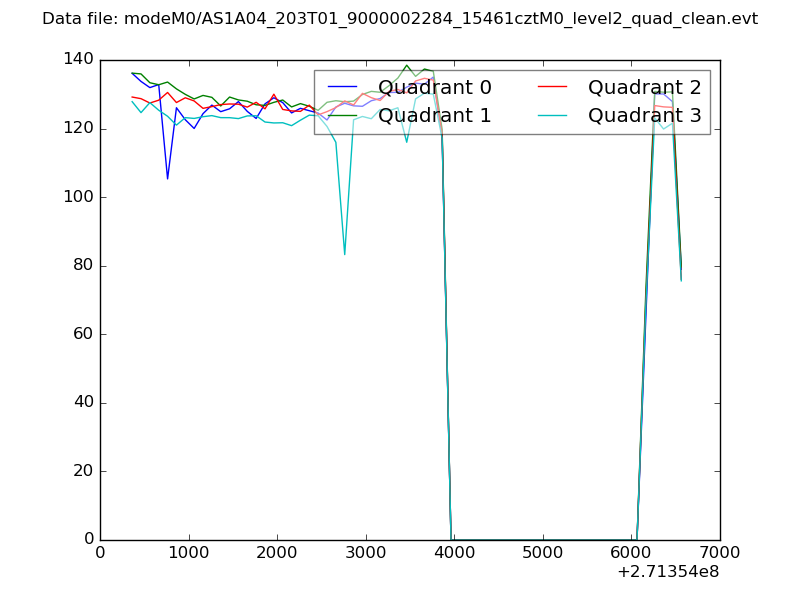 |
|
| Module-wise count rates for Quadrant A Data is divided into 100 sec bins |
 |
 |
| Module-wise count rates for Quadrant B Data is divided into 100 sec bins |
 |
 |
| Module-wise count rates for Quadrant C Data is divided into 100 sec bins |
 |
 |
| Module-wise count rates for Quadrant D Data is divided into 100 sec bins |
 |
 |
| Parameter | Plot |
|---|---|
| CZT HV Monitor |  |
| D_VDD | 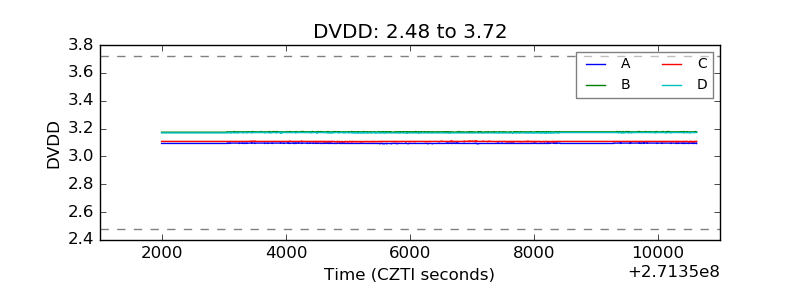 |
| Temperature 1 |  |
| Veto HV Monitor |  |
| Veto LLD |  |
| Alpha Counter |  |
| _CPM_Rate | 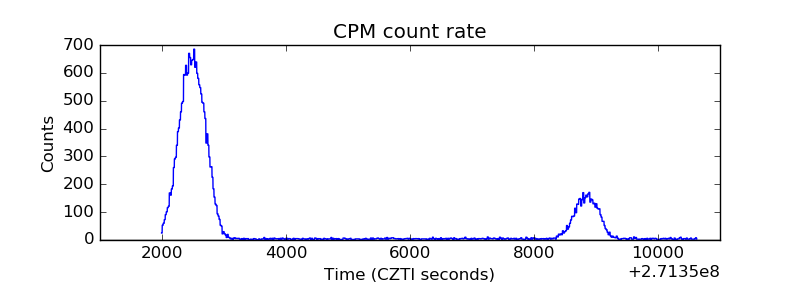 |
| CZT Counter |  |
| +2.5 Volts monitor |  |
| +5 Volts monitor |  |
| _ROLL_ROT |  |
| _Roll_DEC |  |
| _Roll_RA |  |
| Veto Counter |  |