| Param | Original file | Final file |
|---|---|---|
| Filename | modeM0/AS1A04_203T01_9000002284_15462cztM0_level2.evt | modeM0/AS1A04_203T01_9000002284_15462cztM0_level2_quad_clean.evt |
| Size (bytes) | 479,658,240 | 87,975,360 |
| Size | 457.4 MB | 83.9 MB |
| Events in quadrant A | 3,387,696 | 548,546 |
| Events in quadrant B | 3,505,176 | 555,930 |
| Events in quadrant C | 3,472,658 | 543,350 |
| Events in quadrant D | 3,684,513 | 527,696 |
| Mode M0 | |||
|---|---|---|---|
| Quadrant | BADHDUFLAG | Total packets | Discarded packets |
| A | 0 | 14618 | 2 |
| B | 0 | 14915 | 1 |
| C | 0 | 14683 | 1 |
| D | 0 | 15717 | 1 |
| Mode SS | |||
|---|---|---|---|
| Quadrant | BADHDUFLAG | Total packets | Discarded packets |
| A | 0 | 142 | 0 |
| B | 0 | 142 | 0 |
| C | 0 | 142 | 0 |
| D | 0 | 142 | 0 |
| Mode M9 | |||
|---|---|---|---|
| Quadrant | BADHDUFLAG | Total packets | Discarded packets |
| A | 0 | 5 | 0 |
| B | 0 | 5 | 0 |
| C | 0 | 5 | 0 |
| D | 0 | 5 | 0 |
| Quadrant | Total seconds | Saturated seconds | Saturation percentage |
|---|---|---|---|
| A | 7015 | 41 | 0.584462% |
| B | 7015 | 36 | 0.513186% |
| C | 7015 | 33 | 0.470421% |
| D | 7015 | 52 | 0.741269% |
Noise dominated data is calculated using 1-second bins in cleaned event files. If a bin has >2000 counts, and if more than 50% of those come from <1% of pixels, then it is considered to be noise-dominated and hence unusable.
| Quadrant | # 1 sec bins | Bins with >0 counts | Bins with >2000 counts | High rate bins dominated by noise | Noise dominated (total time) | Noise dominated (detector-on time) | Marked lightcurve |
|---|---|---|---|---|---|---|---|
| A | 7511 | 7017 | 10 | 10 | 0.13% | 0.14% | 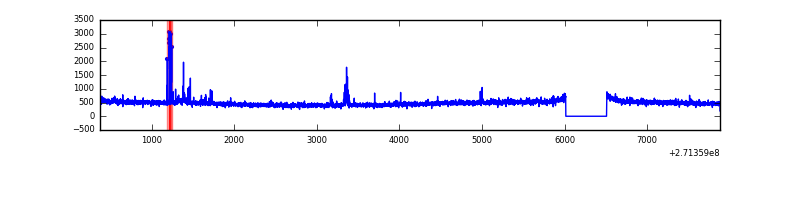 |
| B | 7511 | 7017 | 2 | 2 | 0.03% | 0.03% | 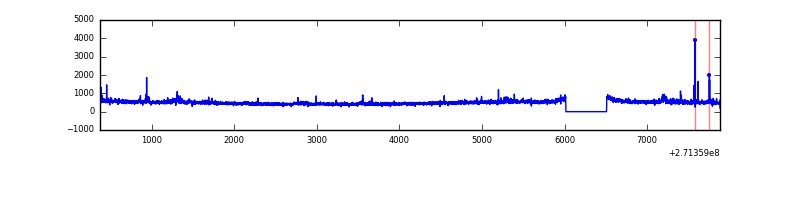 |
| C | 7511 | 7017 | 1 | 1 | 0.01% | 0.01% | 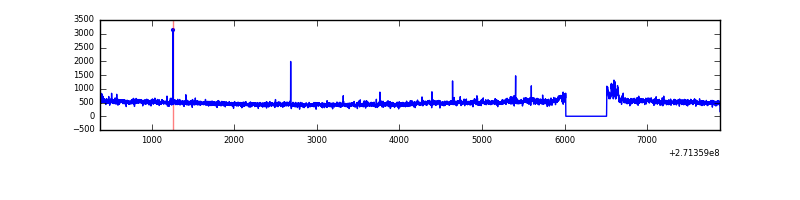 |
| D | 7511 | 7017 | 32 | 32 | 0.43% | 0.46% | 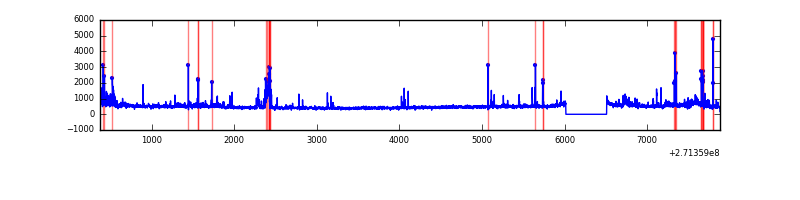 |
Top three noisy pixels from each quadrant. If the there are fewer than three noisy pixels in the level2.evt file, extra rows are filled as -1
| Pixel properties | Quadrant properties | ||||||
|---|---|---|---|---|---|---|---|
| Quadrant | DetID | PixID | Counts | Sigma | Mean | Median | Sigma |
| A | 7 | 16 | 43079 | 241.51 | 855 | 834 | 174.9 |
| A | 14 | 238 | 33758 | 188.22 | 855 | 834 | 174.9 |
| A | 9 | 143 | 13169 | 70.52 | 855 | 834 | 174.9 |
| B | 0 | 189 | 36847 | 220.38 | 855 | 834 | 163.4 |
| B | 4 | 216 | 32133 | 191.53 | 855 | 834 | 163.4 |
| B | 3 | 209 | 22876 | 134.89 | 855 | 834 | 163.4 |
| C | 3 | 233 | 206449 | 1061.34 | 831 | 836 | 193.7 |
| C | 10 | 22 | 9004 | 42.16 | 831 | 836 | 193.7 |
| C | 0 | 207 | 7341 | 33.58 | 831 | 836 | 193.7 |
| D | 5 | 222 | 145657 | 705.46 | 835 | 813 | 205.3 |
| D | 2 | 33 | 138693 | 671.55 | 835 | 813 | 205.3 |
| D | 1 | 52 | 129156 | 625.1 | 835 | 813 | 205.3 |
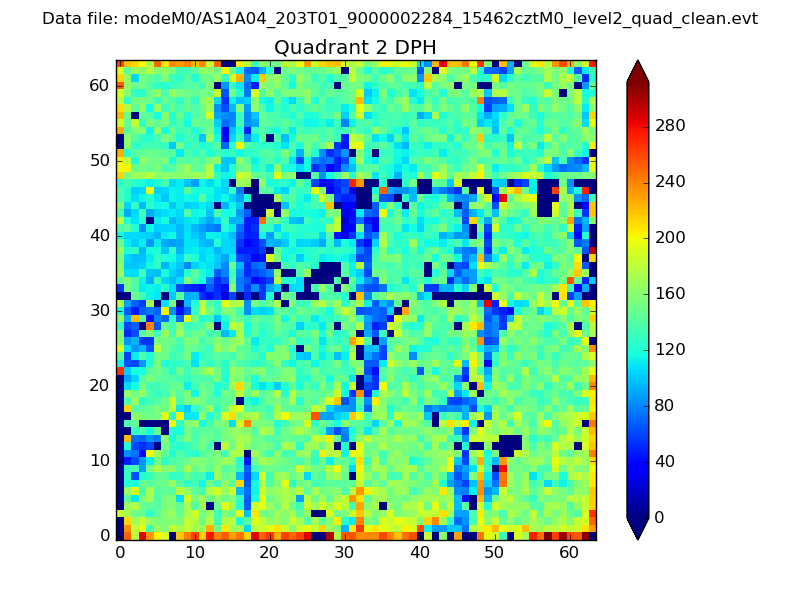
Histogram calculated using DETX and DETY for each event in the final _common_clean file
| Quadrant A | 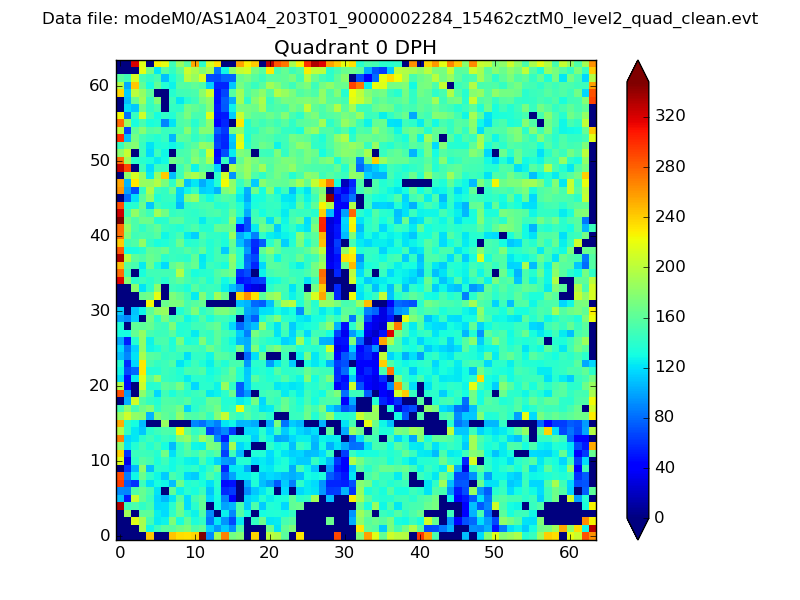 |
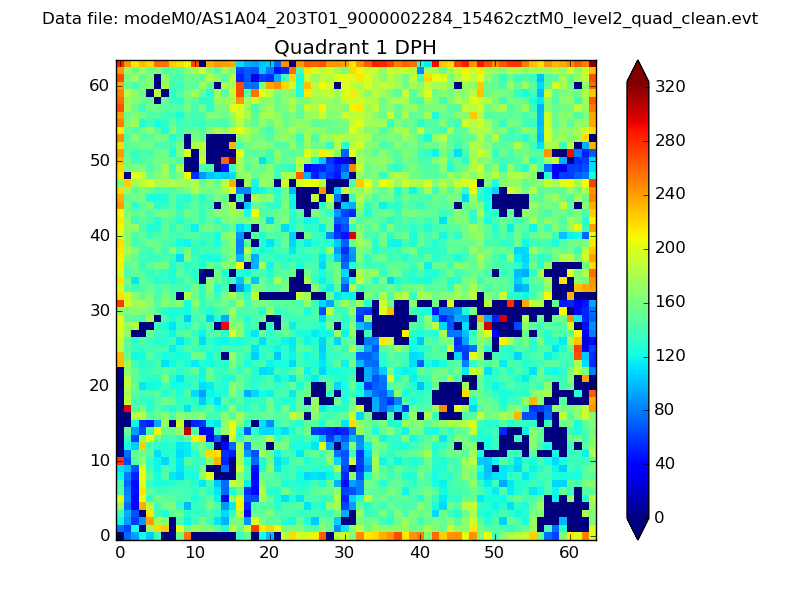 |
Quadrant B |
|---|---|---|---|
| Quadrant D | 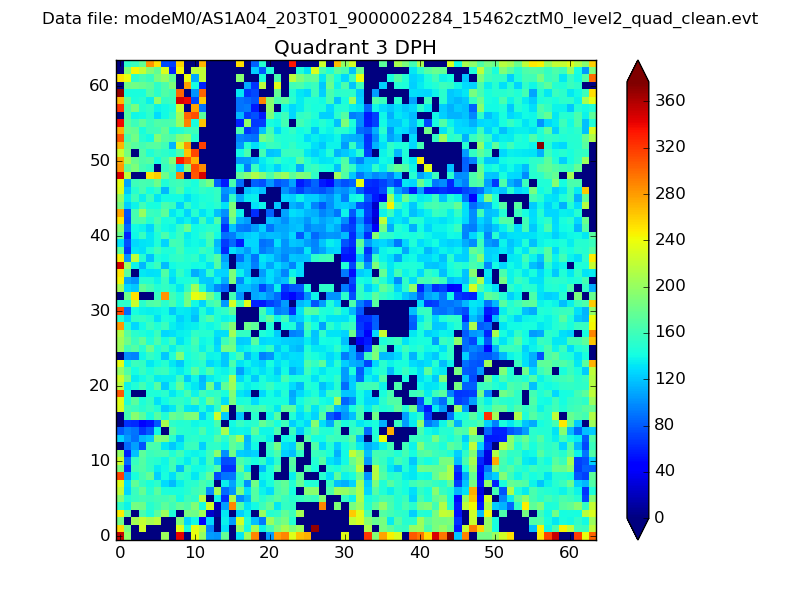 |
 |
Quadrant C |
| Plot type | Count rate plots | Images |
|---|---|---|
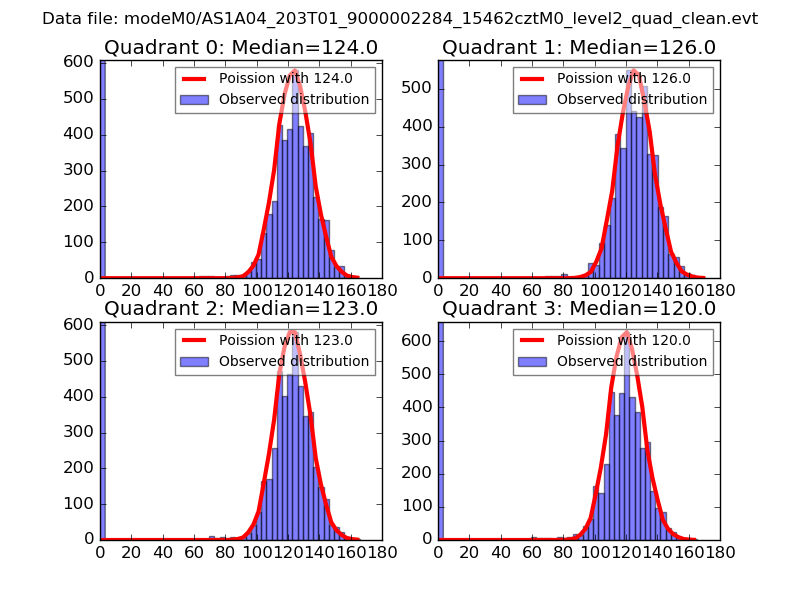
| Comparison with Poisson distribution Blue bars denote a histogram of data divided into 1 sec bins. Red curve is a Poisson curve with rate = median count rate of data. |
 |
 |
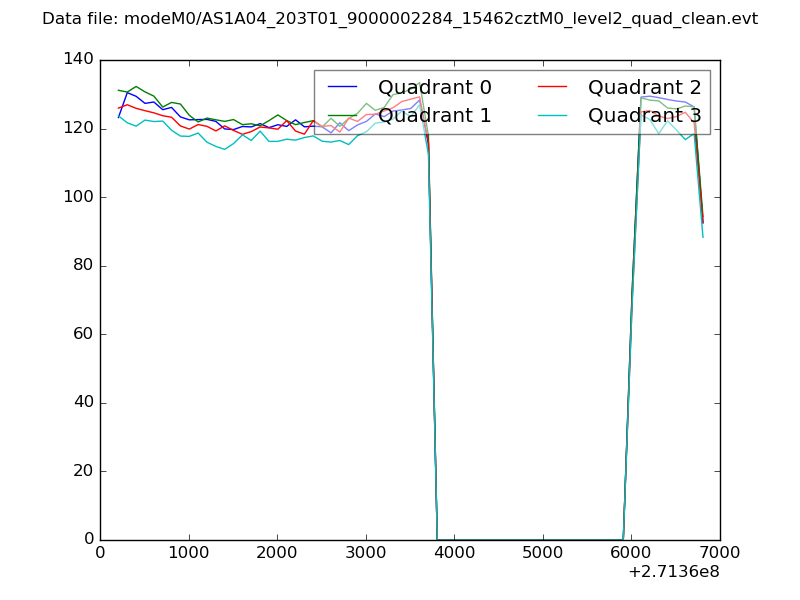
| Quadrant-wise count rates Data is divided into 100 sec bins |
 |
|
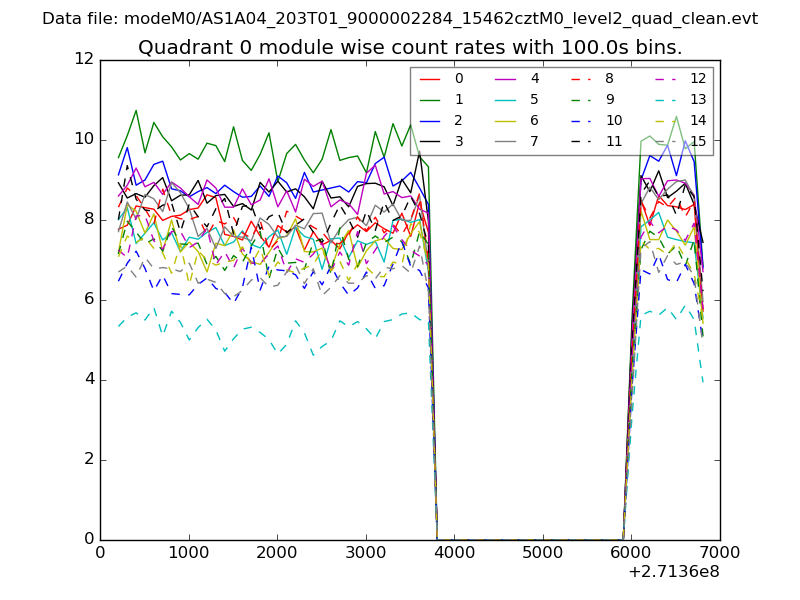
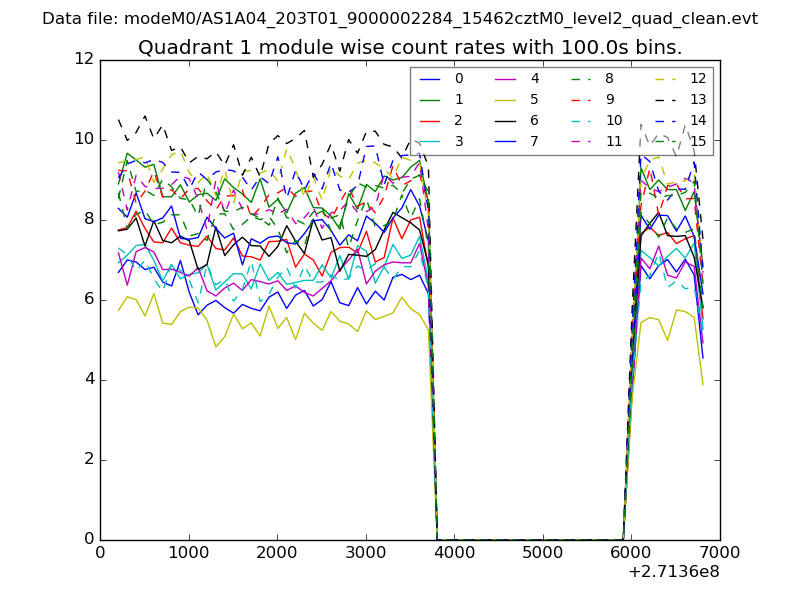
| Module-wise count rates for Quadrant A Data is divided into 100 sec bins |
 |
 |
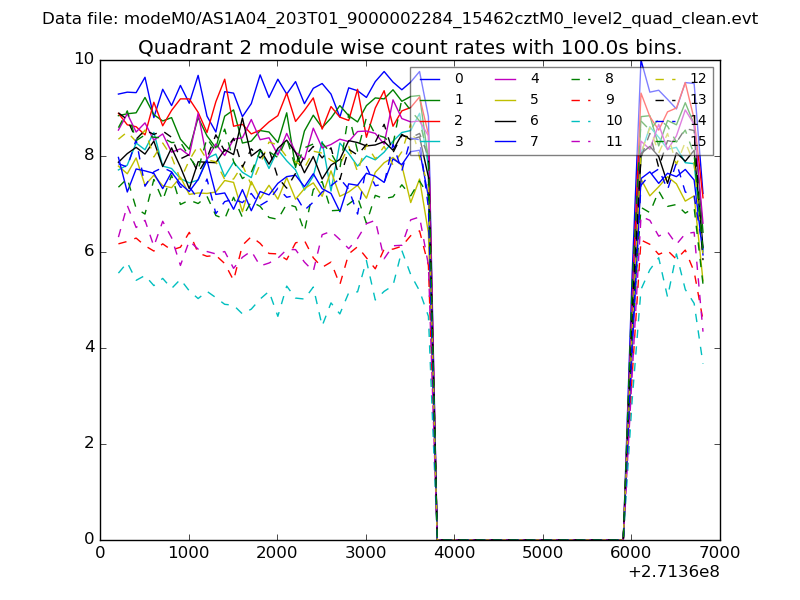
| Module-wise count rates for Quadrant B Data is divided into 100 sec bins |
 |
 |
| Module-wise count rates for Quadrant C Data is divided into 100 sec bins |
 |
 |
| Module-wise count rates for Quadrant D Data is divided into 100 sec bins |
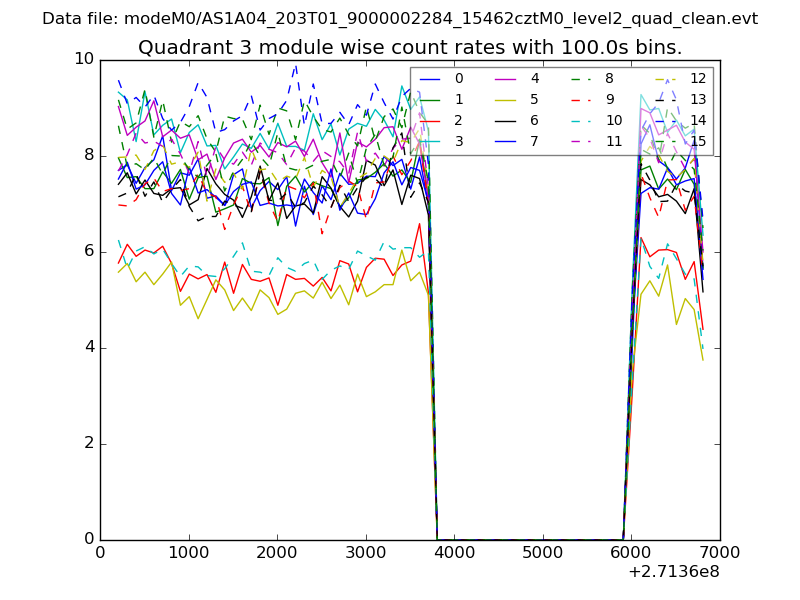 |
 |
| Parameter | Plot |
|---|---|
| CZT HV Monitor | 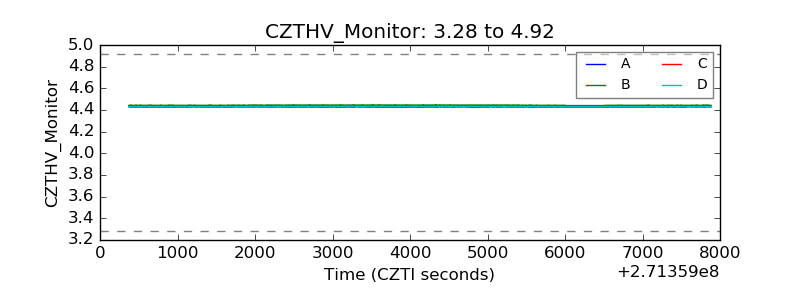 |
| D_VDD | 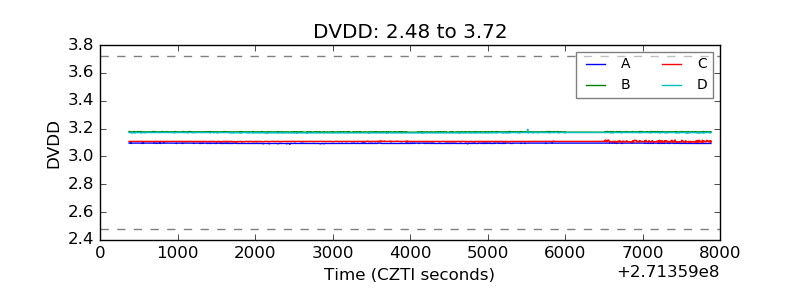 |
| Temperature 1 | 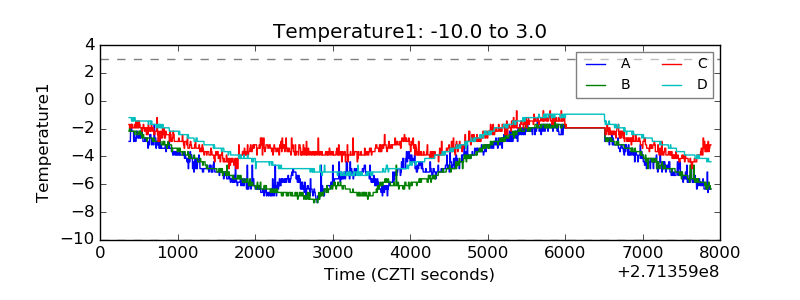 |
| Veto HV Monitor |  |
| Veto LLD | 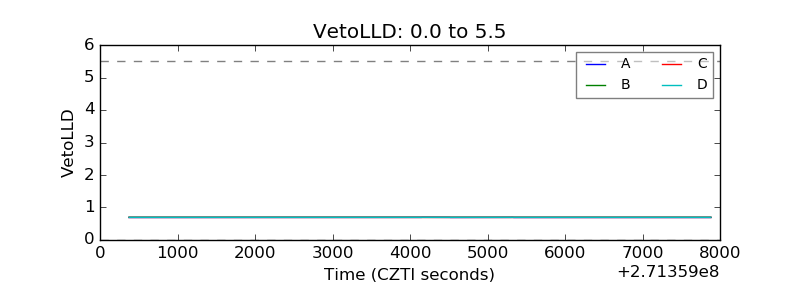 |
| Alpha Counter | 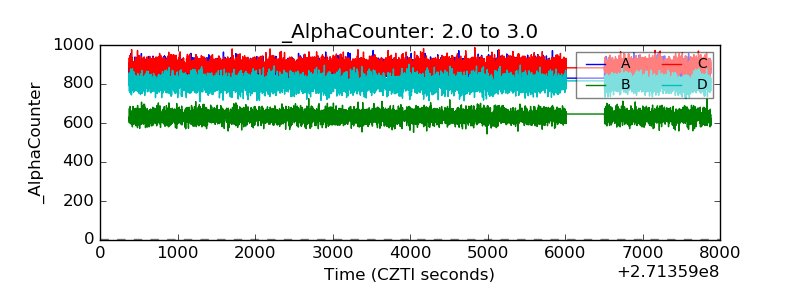 |
| _CPM_Rate | 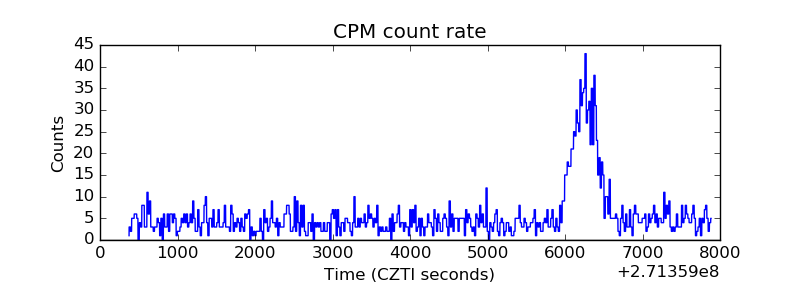 |
| CZT Counter | 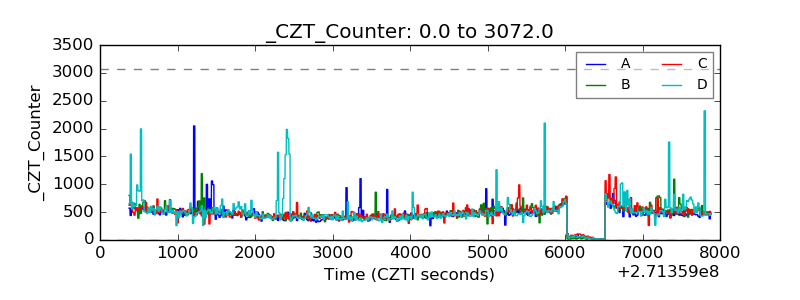 |
| +2.5 Volts monitor | 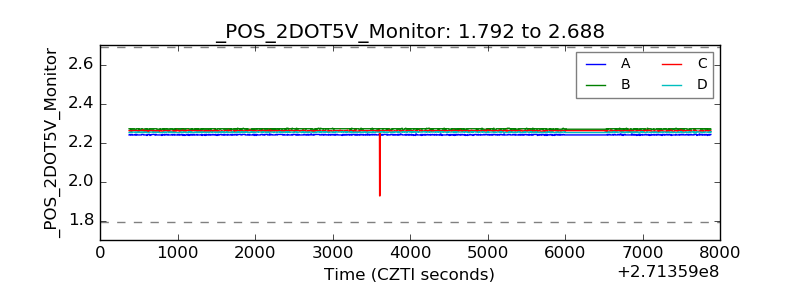 |
| +5 Volts monitor |  |
| _ROLL_ROT | 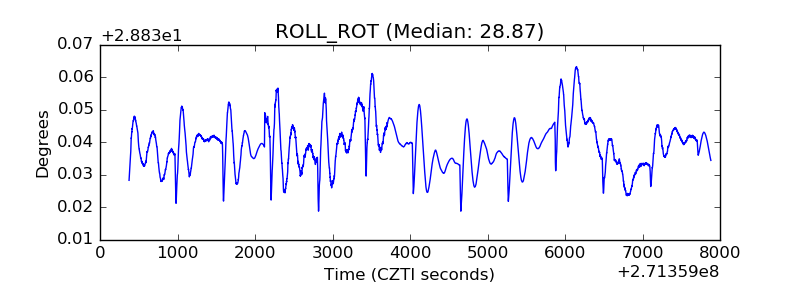 |
| _Roll_DEC | 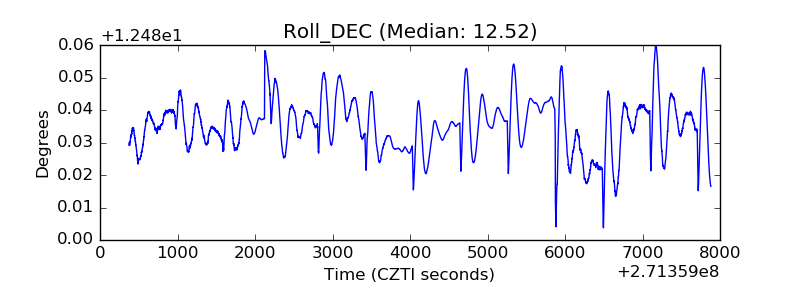 |
| _Roll_RA | 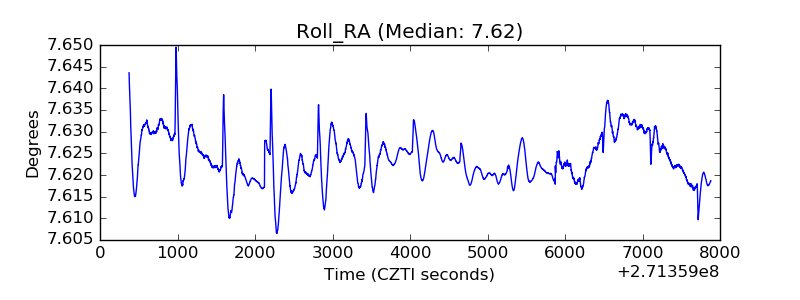 |
| Veto Counter | 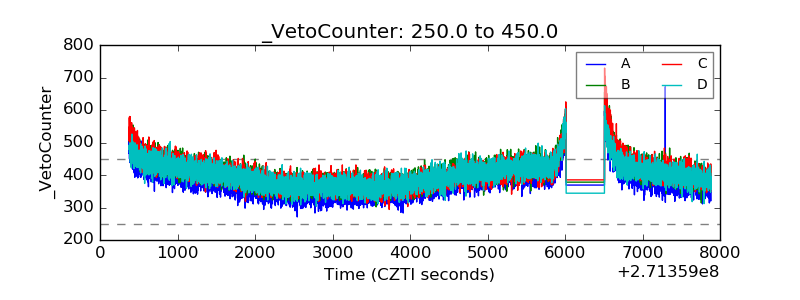 |