| Param | Original file | Final file |
|---|---|---|
| Filename | modeM0/AS1A04_203T01_9000002284_15466cztM0_level2.evt | modeM0/AS1A04_203T01_9000002284_15466cztM0_level2_quad_clean.evt |
| Size (bytes) | 1,044,509,760 | 165,392,640 |
| Size | 996.1 MB | 157.7 MB |
| Events in quadrant A | 6,540,083 | 1,023,945 |
| Events in quadrant B | 6,846,054 | 1,036,390 |
| Events in quadrant C | 7,869,659 | 1,017,477 |
| Events in quadrant D | 9,435,055 | 968,408 |
| Mode M0 | |||
|---|---|---|---|
| Quadrant | BADHDUFLAG | Total packets | Discarded packets |
| A | 0 | 28871 | 4 |
| B | 0 | 29650 | 3 |
| C | 0 | 33011 | 3 |
| D | 0 | 37711 | 3 |
| Mode SS | |||
|---|---|---|---|
| Quadrant | BADHDUFLAG | Total packets | Discarded packets |
| A | 0 | 284 | 0 |
| B | 0 | 284 | 0 |
| C | 0 | 284 | 0 |
| D | 0 | 284 | 0 |
| Mode M9 | |||
|---|---|---|---|
| Quadrant | BADHDUFLAG | Total packets | Discarded packets |
| A | 0 | 17 | 0 |
| B | 0 | 17 | 0 |
| C | 0 | 17 | 0 |
| D | 0 | 17 | 0 |
| Quadrant | Total seconds | Saturated seconds | Saturation percentage |
|---|---|---|---|
| A | 13941 | 127 | 0.910982% |
| B | 13941 | 193 | 1.384406% |
| C | 13941 | 137 | 0.982713% |
| D | 13941 | 742 | 5.322430% |
Noise dominated data is calculated using 1-second bins in cleaned event files. If a bin has >2000 counts, and if more than 50% of those come from <1% of pixels, then it is considered to be noise-dominated and hence unusable.
| Quadrant | # 1 sec bins | Bins with >0 counts | Bins with >2000 counts | High rate bins dominated by noise | Noise dominated (total time) | Noise dominated (detector-on time) | Marked lightcurve |
|---|---|---|---|---|---|---|---|
| A | 15542 | 13944 | 1 | 1 | 0.01% | 0.01% | 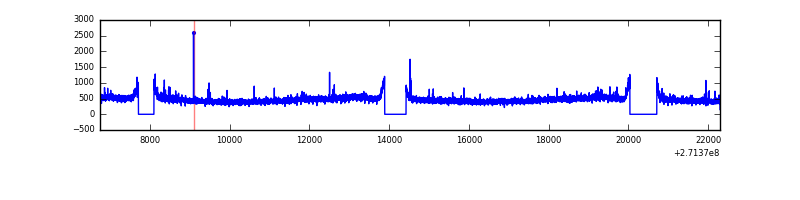 |
| B | 15542 | 13944 | 7 | 7 | 0.05% | 0.05% | 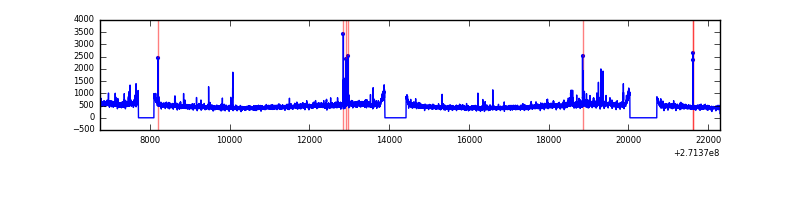 |
| C | 15542 | 13945 | 7 | 7 | 0.05% | 0.05% | 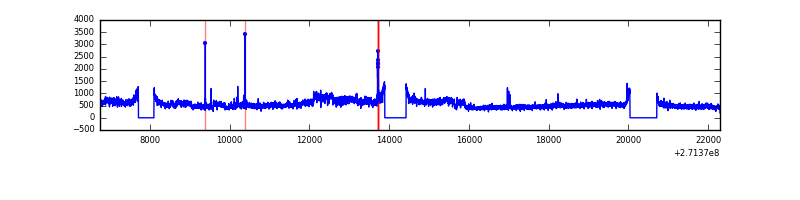 |
| D | 15542 | 13944 | 505 | 505 | 3.25% | 3.62% | 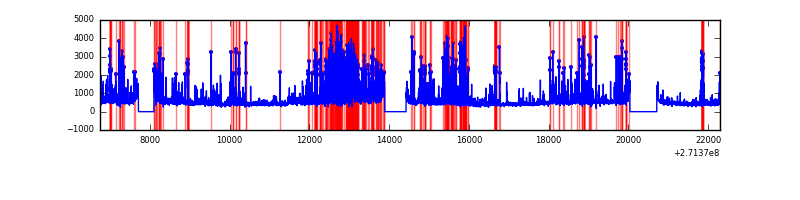 |
Top three noisy pixels from each quadrant. If the there are fewer than three noisy pixels in the level2.evt file, extra rows are filled as -1
| Pixel properties | Quadrant properties | ||||||
|---|---|---|---|---|---|---|---|
| Quadrant | DetID | PixID | Counts | Sigma | Mean | Median | Sigma |
| A | 9 | 143 | 34210 | 95.11 | 1683 | 1643 | 342.4 |
| A | 12 | 96 | 21563 | 58.18 | 1683 | 1643 | 342.4 |
| A | 0 | 226 | 15060 | 39.18 | 1683 | 1643 | 342.4 |
| B | 3 | 209 | 55696 | 164.99 | 1686 | 1641 | 327.6 |
| B | 0 | 230 | 46452 | 136.78 | 1686 | 1641 | 327.6 |
| B | 4 | 142 | 40848 | 119.67 | 1686 | 1641 | 327.6 |
| C | 3 | 233 | 1439847 | 3812.4 | 1628 | 1637 | 377.2 |
| C | 10 | 22 | 22309 | 54.8 | 1628 | 1637 | 377.2 |
| C | 9 | 54 | 22122 | 54.3 | 1628 | 1637 | 377.2 |
| D | 1 | 52 | 2535219 | 6345.35 | 1609 | 1560 | 399.3 |
| D | 2 | 33 | 300929 | 749.75 | 1609 | 1560 | 399.3 |
| D | 7 | 38 | 184808 | 458.93 | 1609 | 1560 | 399.3 |
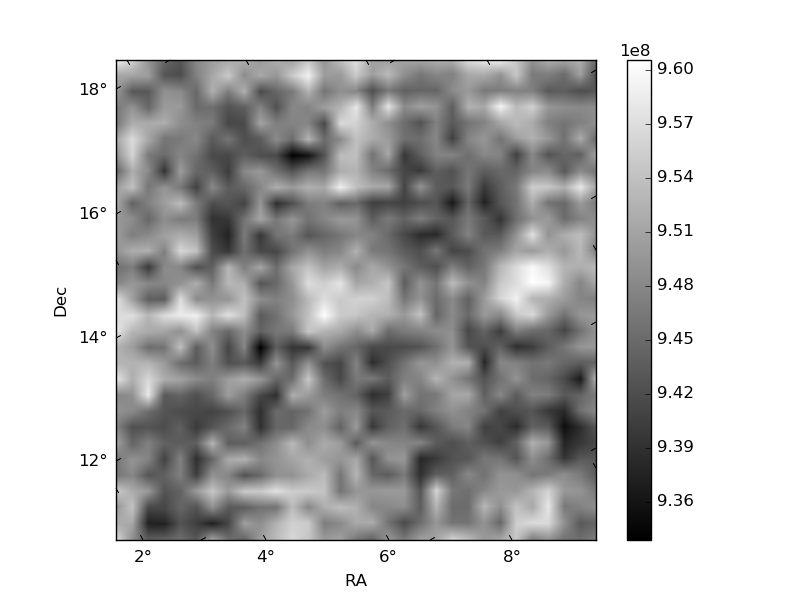
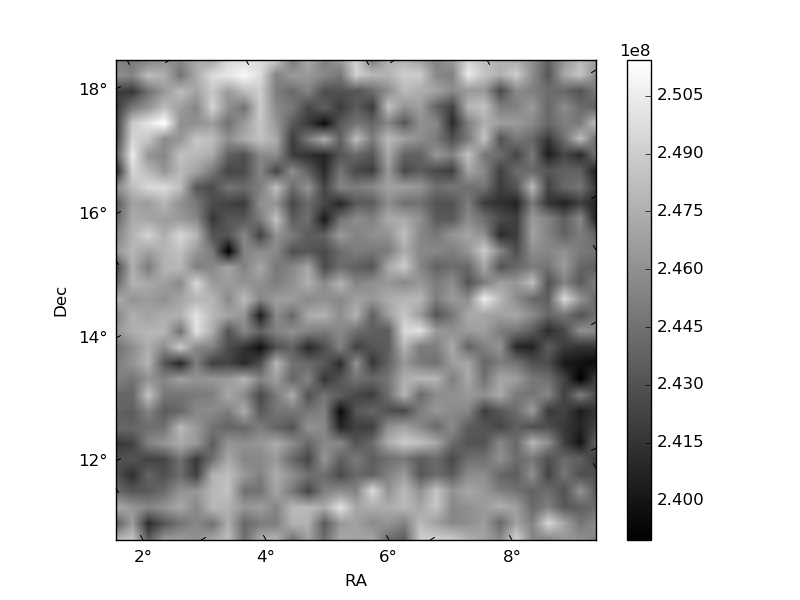
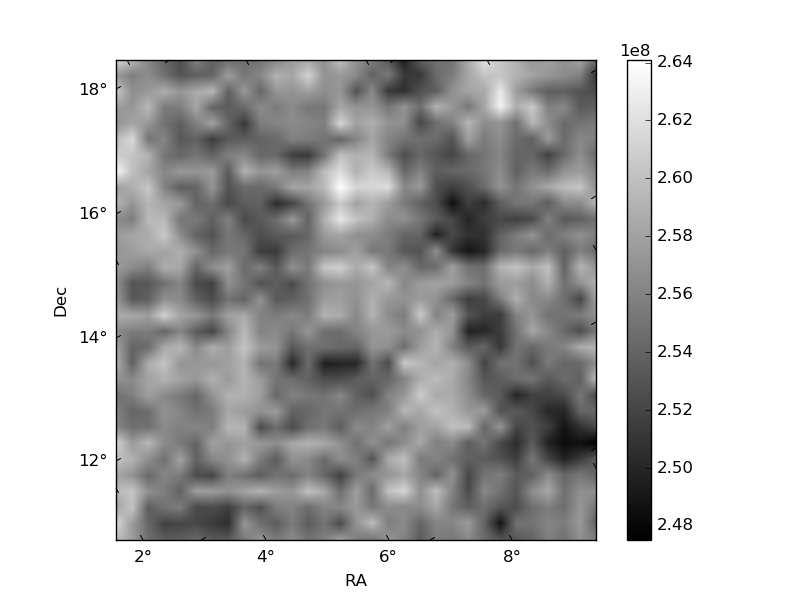
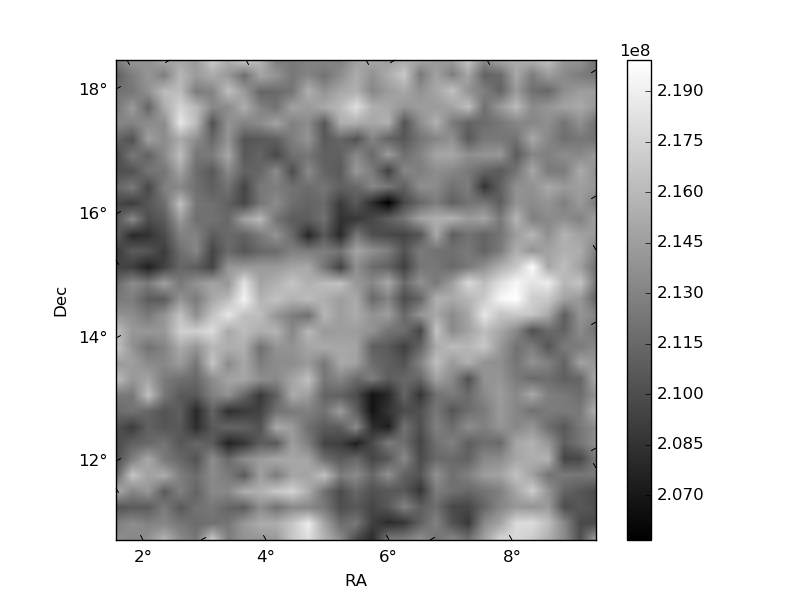
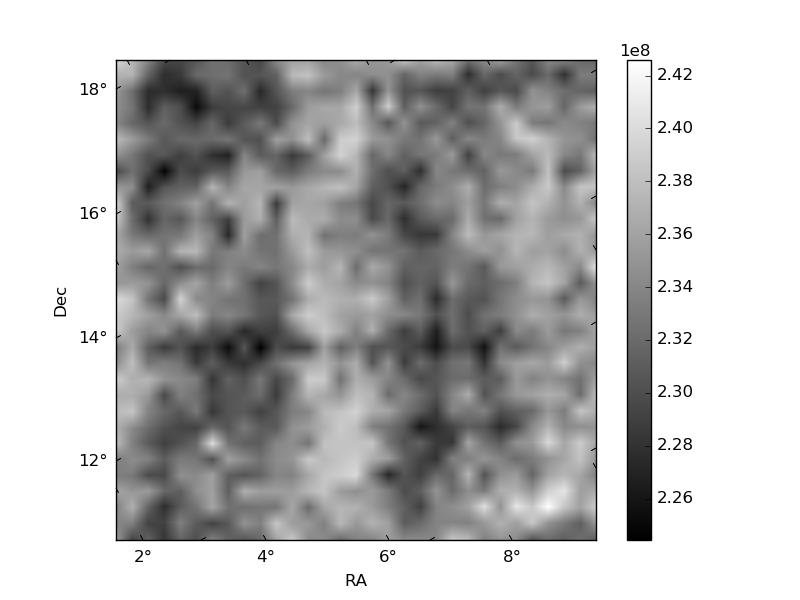
Histogram calculated using DETX and DETY for each event in the final _common_clean file
| Quadrant A | 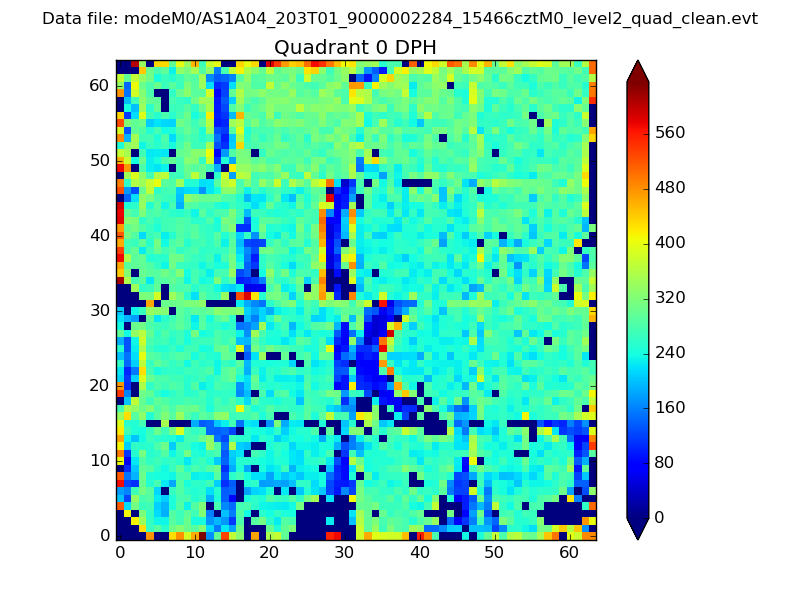 |
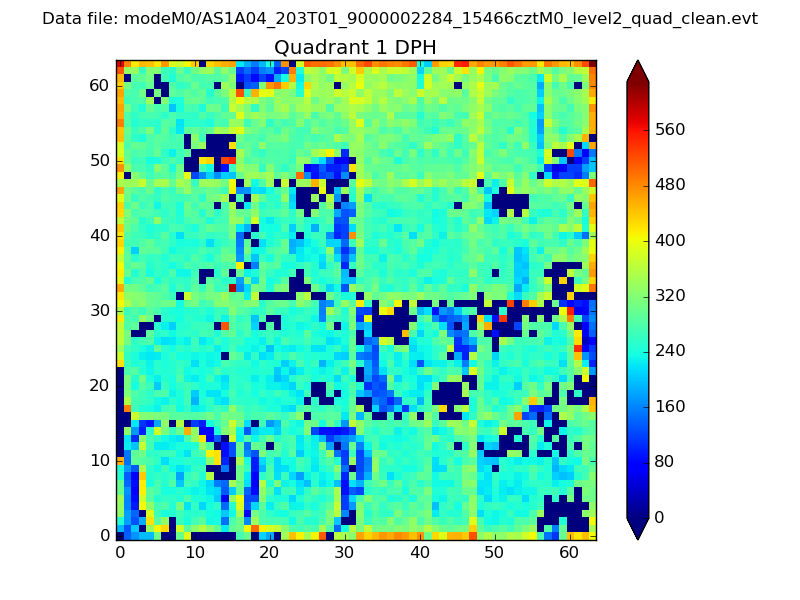 |
Quadrant B |
|---|---|---|---|
| Quadrant D | 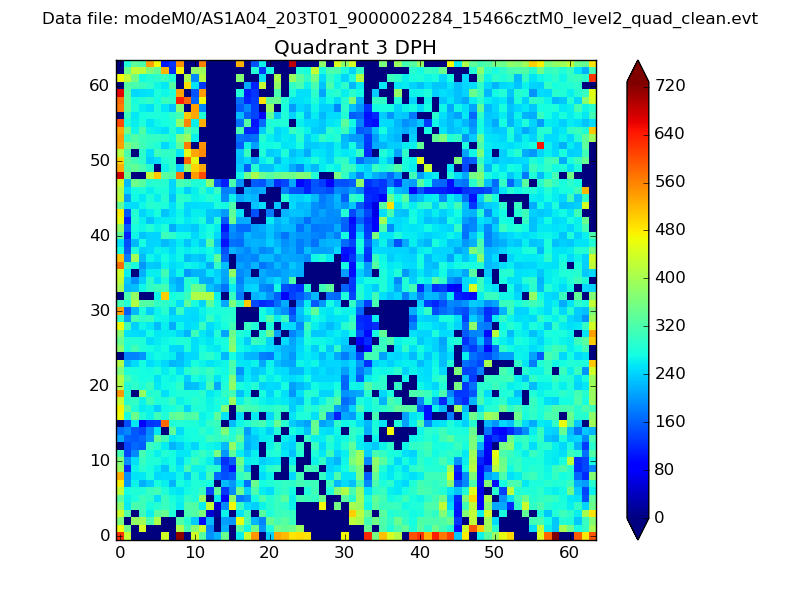 |
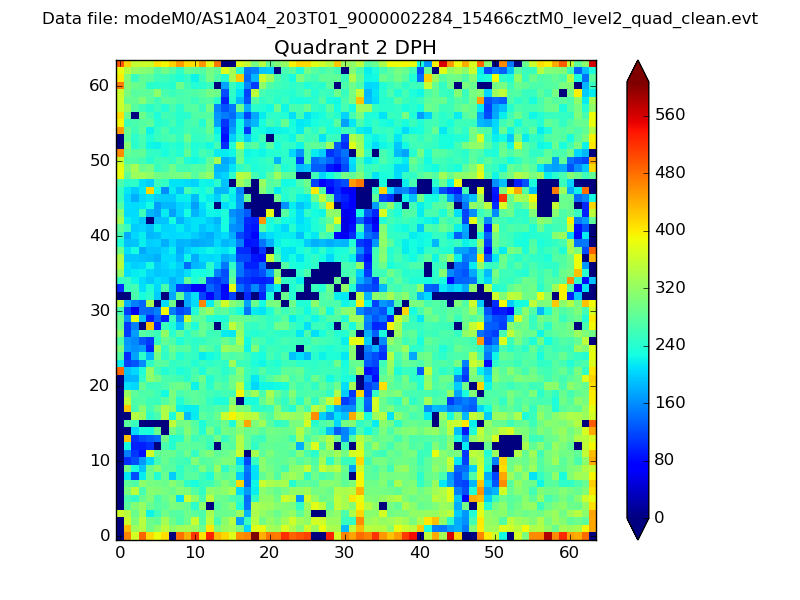 |
Quadrant C |
| Plot type | Count rate plots | Images |
|---|---|---|
| Comparison with Poisson distribution Blue bars denote a histogram of data divided into 1 sec bins. Red curve is a Poisson curve with rate = median count rate of data. |
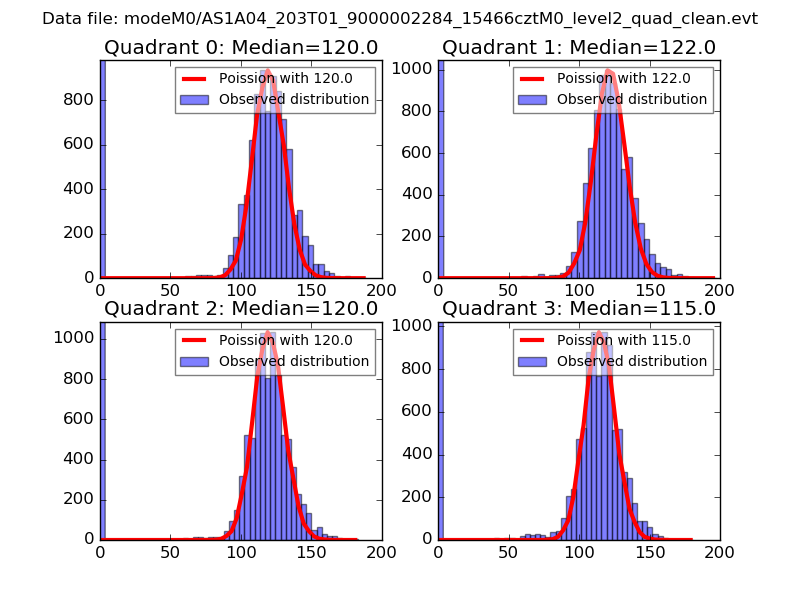 |
 |
| Quadrant-wise count rates Data is divided into 100 sec bins |
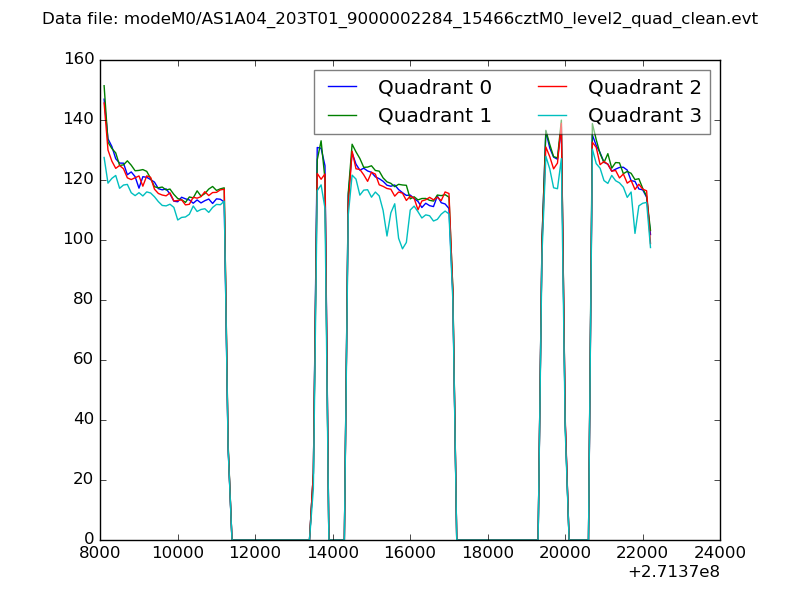 |
|
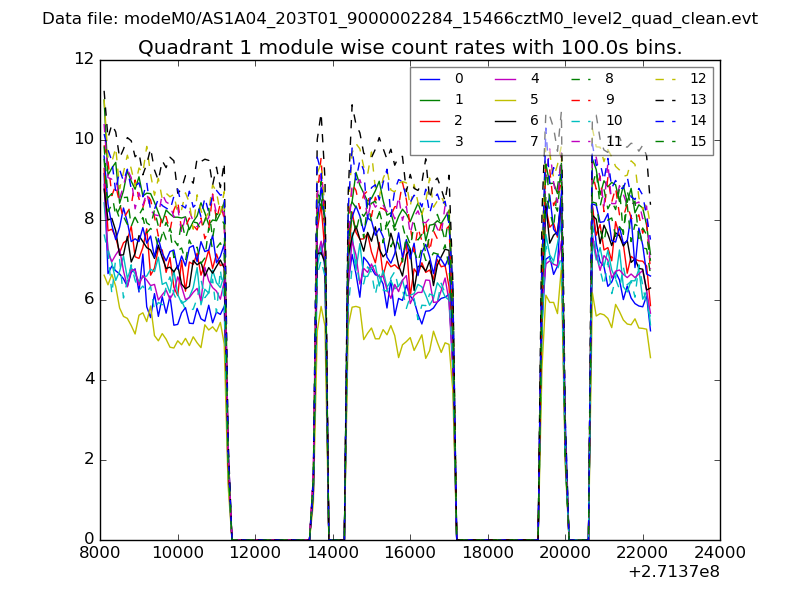
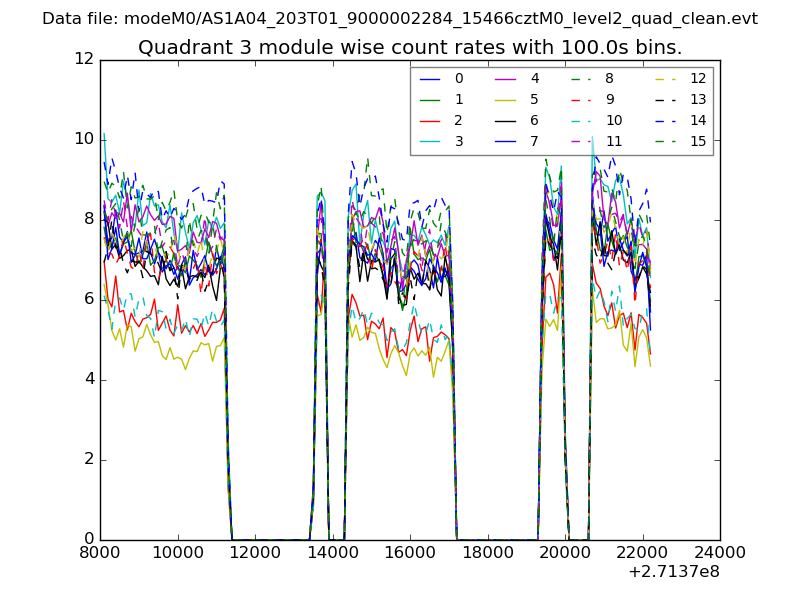
| Module-wise count rates for Quadrant A Data is divided into 100 sec bins |
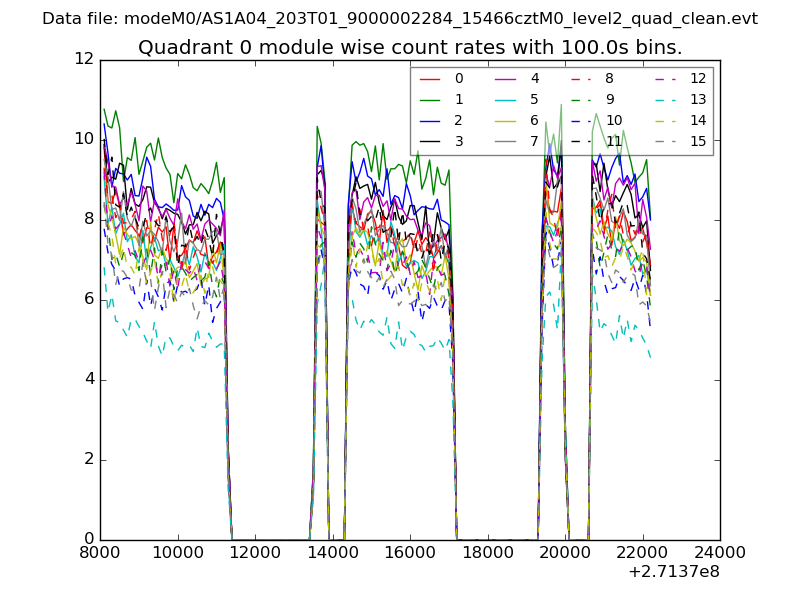 |
 |
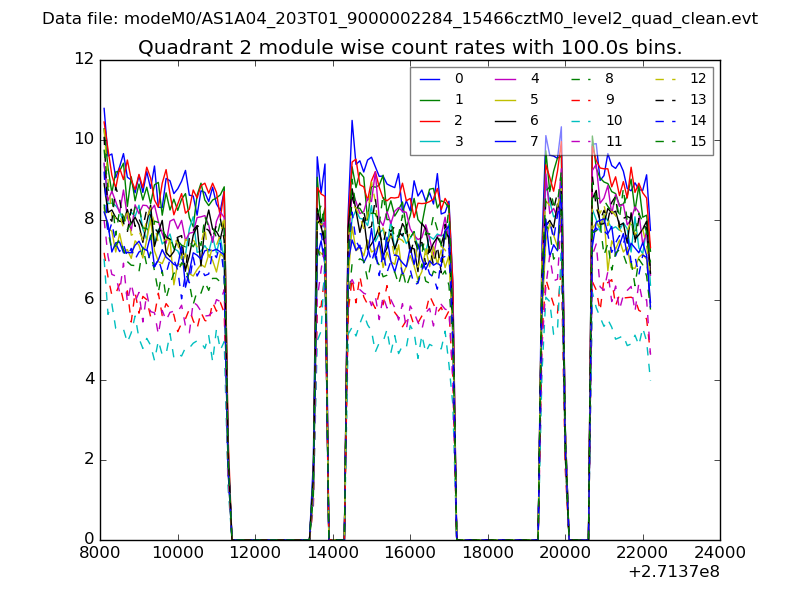
| Module-wise count rates for Quadrant B Data is divided into 100 sec bins |
 |
 |
| Module-wise count rates for Quadrant C Data is divided into 100 sec bins |
 |
 |
| Module-wise count rates for Quadrant D Data is divided into 100 sec bins |
 |
 |
| Parameter | Plot |
|---|---|
| CZT HV Monitor | 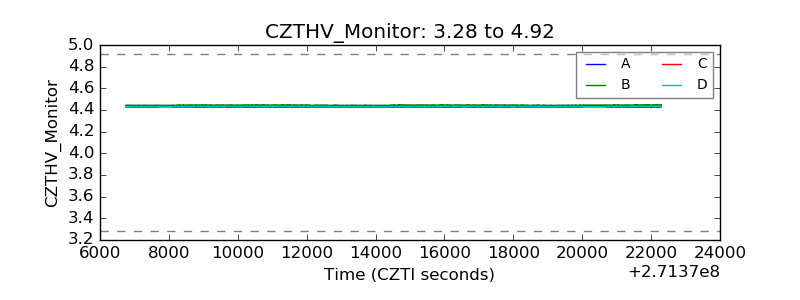 |
| D_VDD | 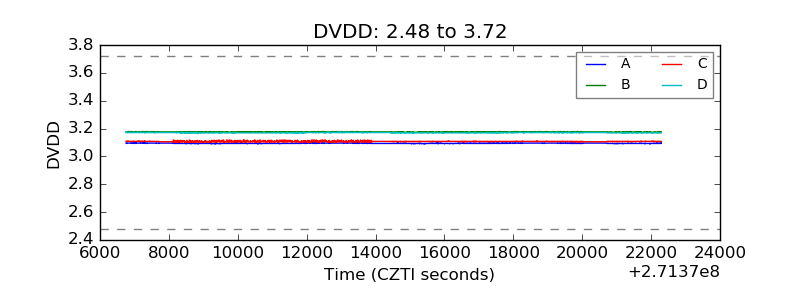 |
| Temperature 1 | 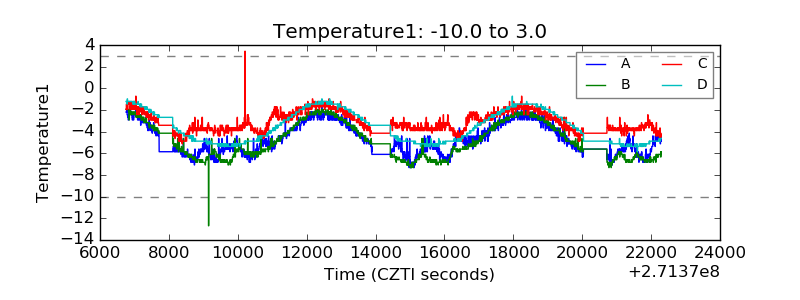 |
| Veto HV Monitor | 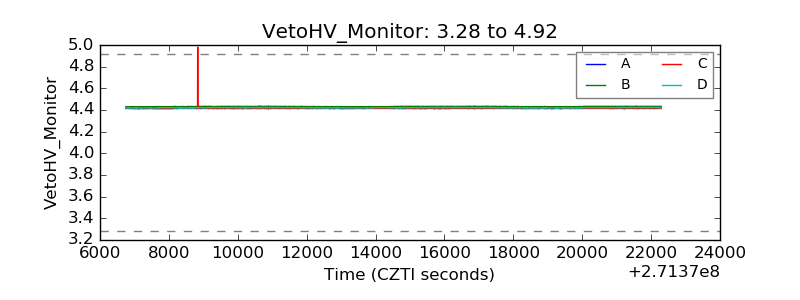 |
| Veto LLD | 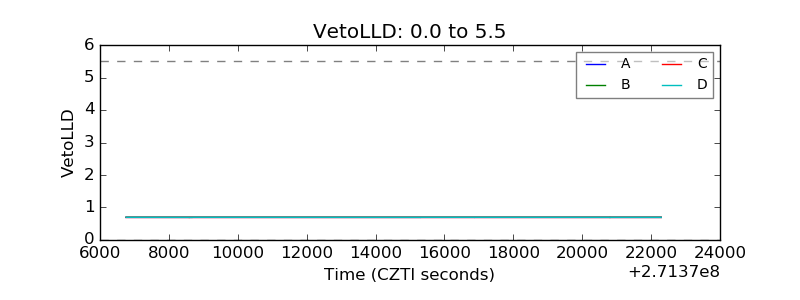 |
| Alpha Counter | 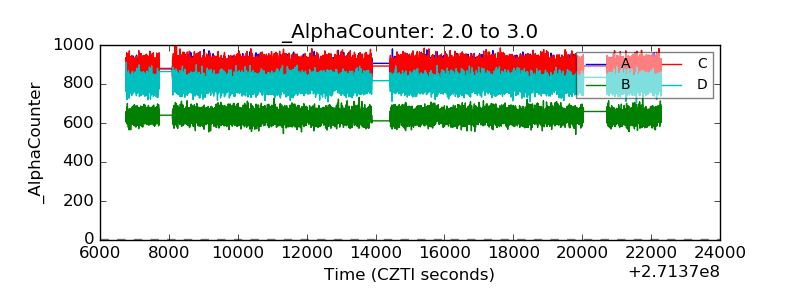 |
| _CPM_Rate | 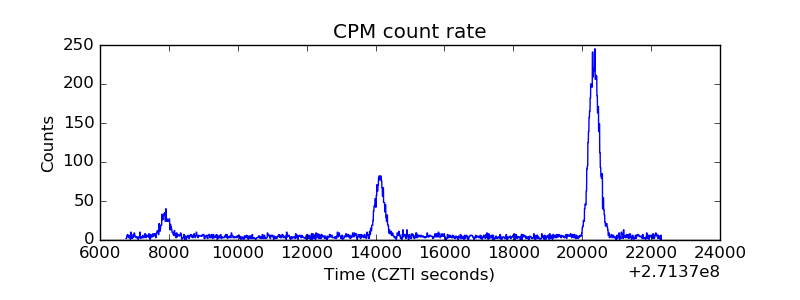 |
| CZT Counter | 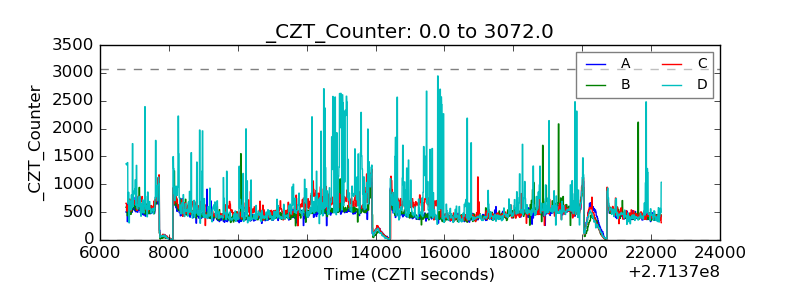 |
| +2.5 Volts monitor |  |
| +5 Volts monitor |  |
| _ROLL_ROT | 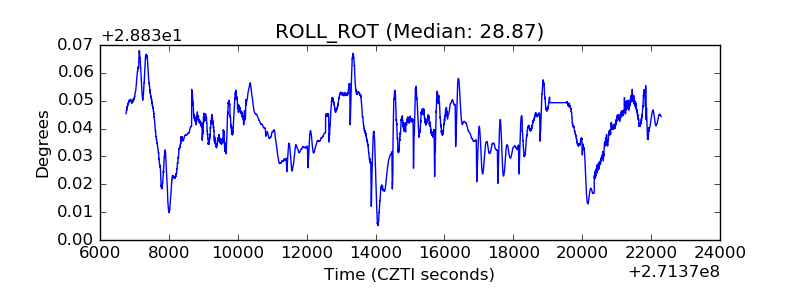 |
| _Roll_DEC | 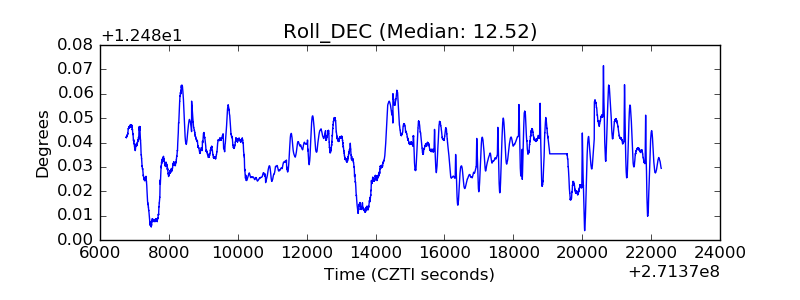 |
| _Roll_RA | 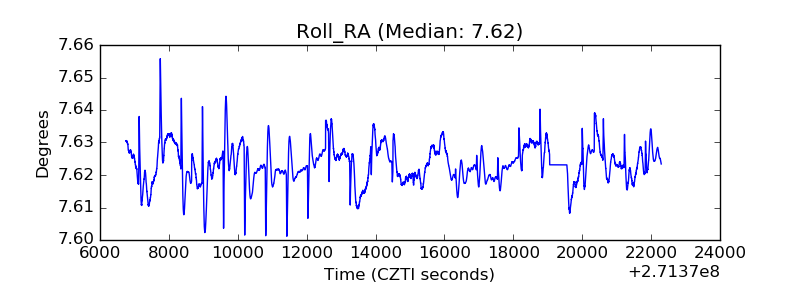 |
| Veto Counter | 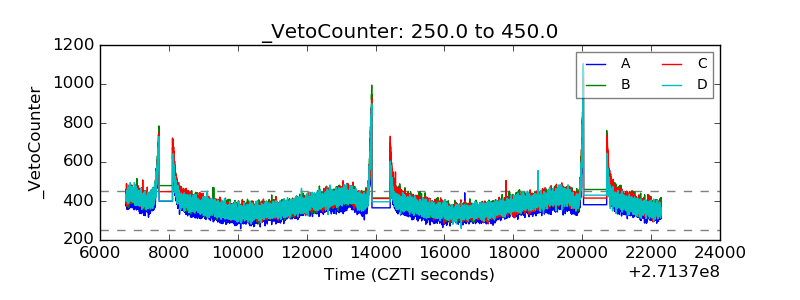 |