| Param | Original file | Final file |
|---|---|---|
| Filename | modeM0/AS1A04_203T01_9000002284_15467cztM0_level2.evt | modeM0/AS1A04_203T01_9000002284_15467cztM0_level2_quad_clean.evt |
| Size (bytes) | 487,918,080 | 93,006,720 |
| Size | 465.3 MB | 88.7 MB |
| Events in quadrant A | 3,268,684 | 589,385 |
| Events in quadrant B | 3,437,329 | 597,342 |
| Events in quadrant C | 3,417,200 | 586,884 |
| Events in quadrant D | 4,181,209 | 558,497 |
| Mode M0 | |||
|---|---|---|---|
| Quadrant | BADHDUFLAG | Total packets | Discarded packets |
| A | 0 | 14397 | 3 |
| B | 0 | 14751 | 2 |
| C | 0 | 14512 | 2 |
| D | 0 | 17180 | 2 |
| Mode SS | |||
|---|---|---|---|
| Quadrant | BADHDUFLAG | Total packets | Discarded packets |
| A | 0 | 142 | 0 |
| B | 0 | 142 | 0 |
| C | 0 | 142 | 0 |
| D | 0 | 142 | 0 |
| Mode M9 | |||
|---|---|---|---|
| Quadrant | BADHDUFLAG | Total packets | Discarded packets |
| A | 0 | 16 | 0 |
| B | 0 | 16 | 0 |
| C | 0 | 16 | 0 |
| D | 0 | 16 | 0 |
| Quadrant | Total seconds | Saturated seconds | Saturation percentage |
|---|---|---|---|
| A | 6957 | 71 | 1.020555% |
| B | 6957 | 105 | 1.509271% |
| C | 6957 | 55 | 0.790571% |
| D | 6957 | 222 | 3.191031% |
Noise dominated data is calculated using 1-second bins in cleaned event files. If a bin has >2000 counts, and if more than 50% of those come from <1% of pixels, then it is considered to be noise-dominated and hence unusable.
| Quadrant | # 1 sec bins | Bins with >0 counts | Bins with >2000 counts | High rate bins dominated by noise | Noise dominated (total time) | Noise dominated (detector-on time) | Marked lightcurve |
|---|---|---|---|---|---|---|---|
| A | 8503 | 6959 | 0 | 0 | 0.00% | 0.00% | 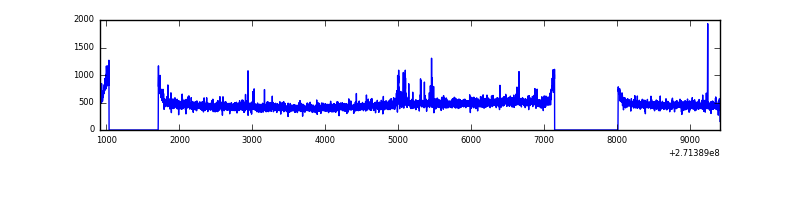 |
| B | 8503 | 6959 | 5 | 5 | 0.06% | 0.07% | 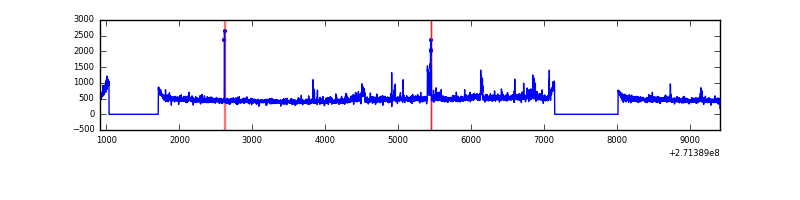 |
| C | 8503 | 6960 | 0 | 0 | 0.00% | 0.00% | 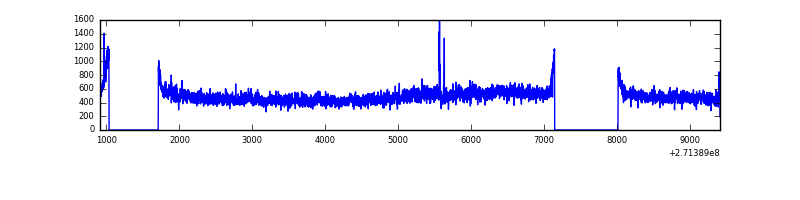 |
| D | 8503 | 6959 | 143 | 143 | 1.68% | 2.05% | 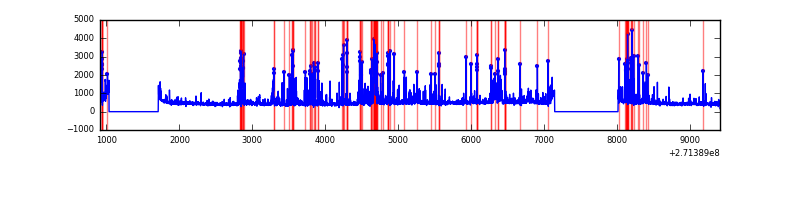 |
Top three noisy pixels from each quadrant. If the there are fewer than three noisy pixels in the level2.evt file, extra rows are filled as -1
| Pixel properties | Quadrant properties | ||||||
|---|---|---|---|---|---|---|---|
| Quadrant | DetID | PixID | Counts | Sigma | Mean | Median | Sigma |
| A | 12 | 96 | 34217 | 195.04 | 837 | 819 | 171.2 |
| A | 9 | 143 | 10722 | 57.83 | 837 | 819 | 171.2 |
| A | 0 | 226 | 7521 | 39.14 | 837 | 819 | 171.2 |
| B | 3 | 209 | 73267 | 443.81 | 837 | 818 | 163.2 |
| B | 0 | 189 | 50939 | 307.03 | 837 | 818 | 163.2 |
| B | 12 | 111 | 19590 | 114.99 | 837 | 818 | 163.2 |
| C | 3 | 233 | 245392 | 1295.54 | 810 | 814 | 188.8 |
| C | 14 | 234 | 8664 | 41.58 | 810 | 814 | 188.8 |
| C | 13 | 61 | 5767 | 26.24 | 810 | 814 | 188.8 |
| D | 1 | 52 | 651195 | 3267.71 | 806 | 780 | 199.0 |
| D | 2 | 33 | 261618 | 1310.46 | 806 | 780 | 199.0 |
| D | 5 | 222 | 89576 | 446.11 | 806 | 780 | 199.0 |
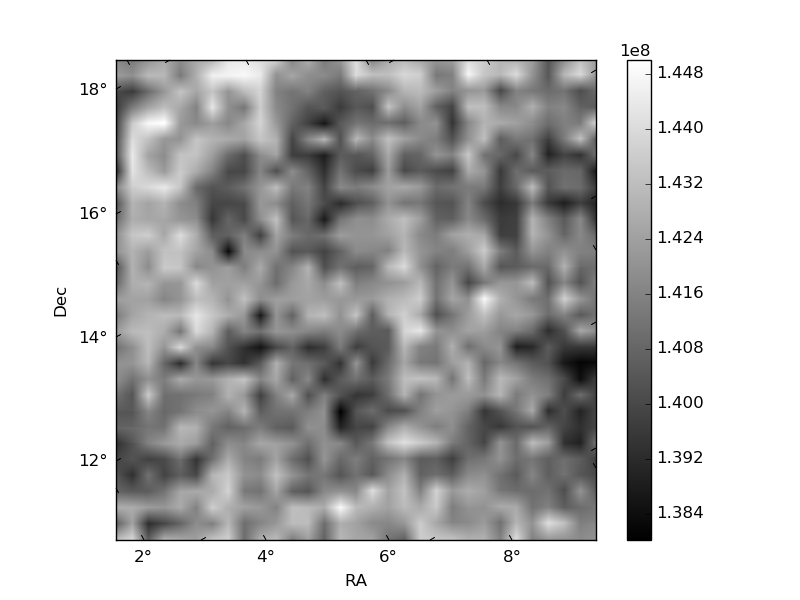
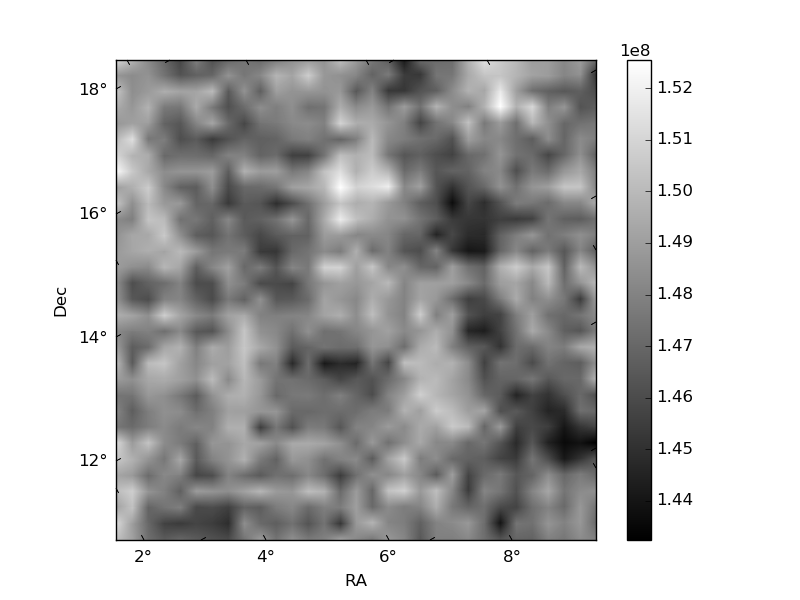
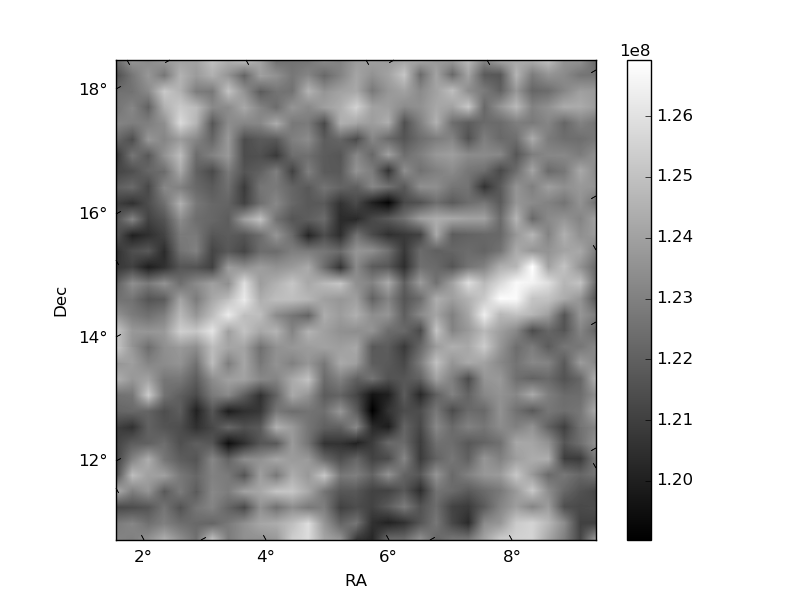
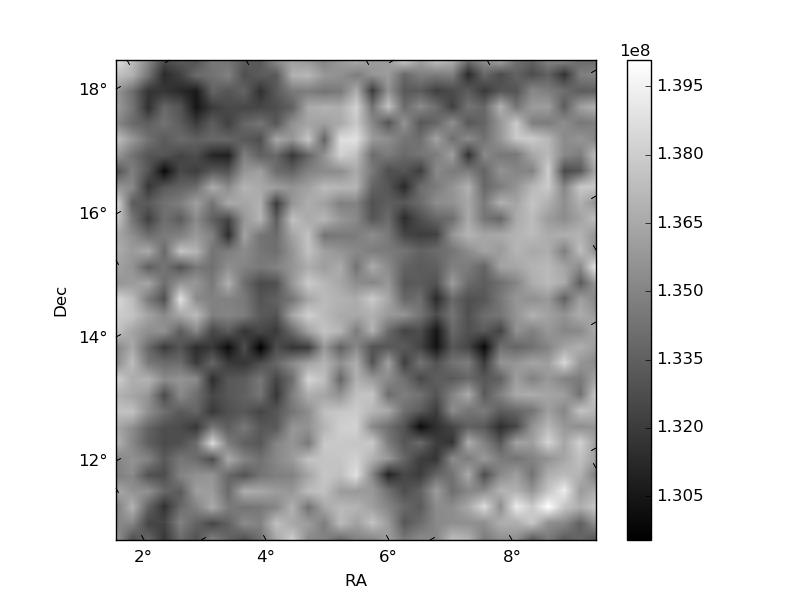
Histogram calculated using DETX and DETY for each event in the final _common_clean file
| Quadrant A | 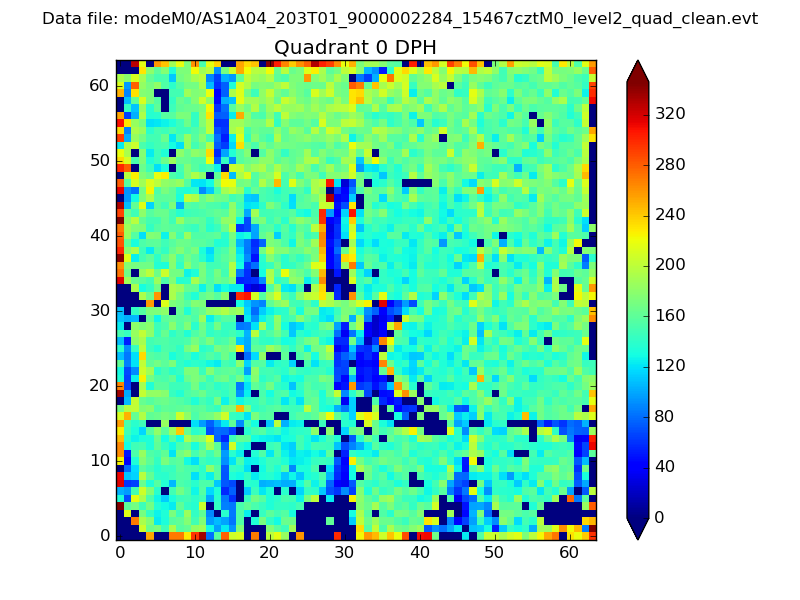 |
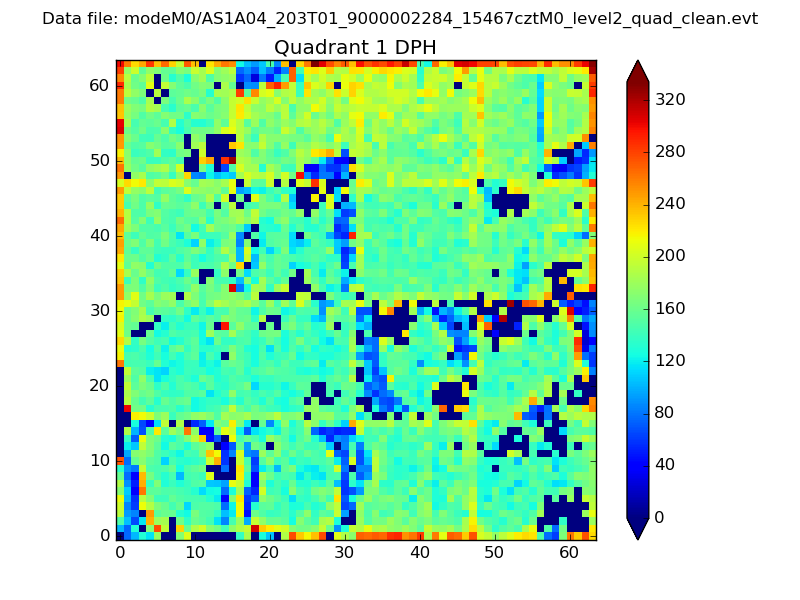 |
Quadrant B |
|---|---|---|---|
| Quadrant D | 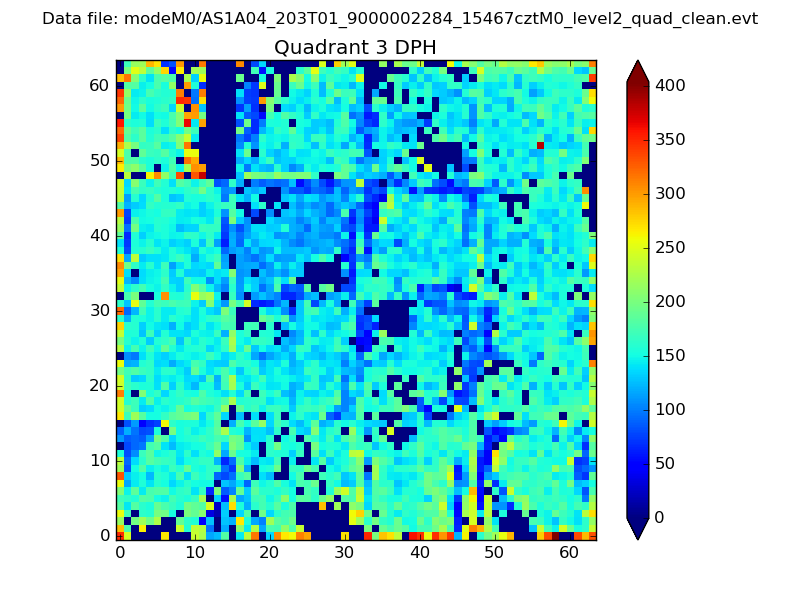 |
 |
Quadrant C |
| Plot type | Count rate plots | Images |
|---|---|---|
| Comparison with Poisson distribution Blue bars denote a histogram of data divided into 1 sec bins. Red curve is a Poisson curve with rate = median count rate of data. |
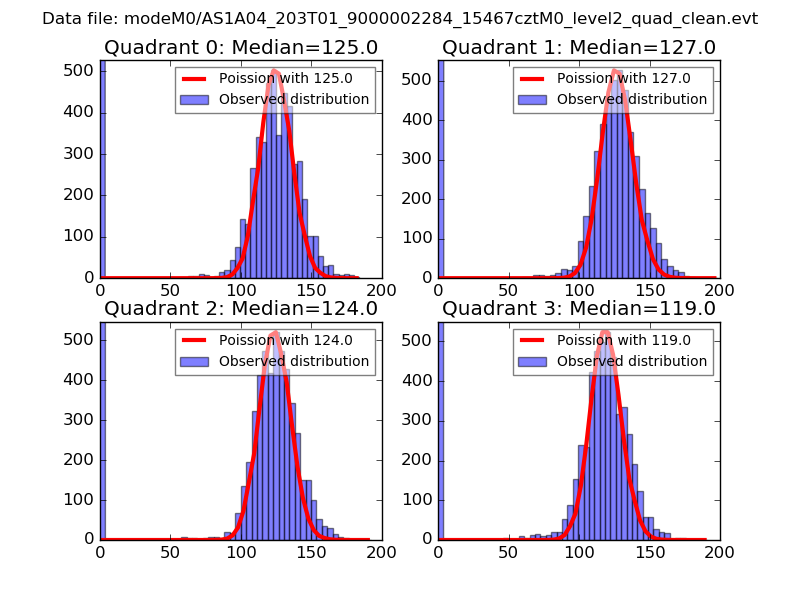 |
 |
| Quadrant-wise count rates Data is divided into 100 sec bins |
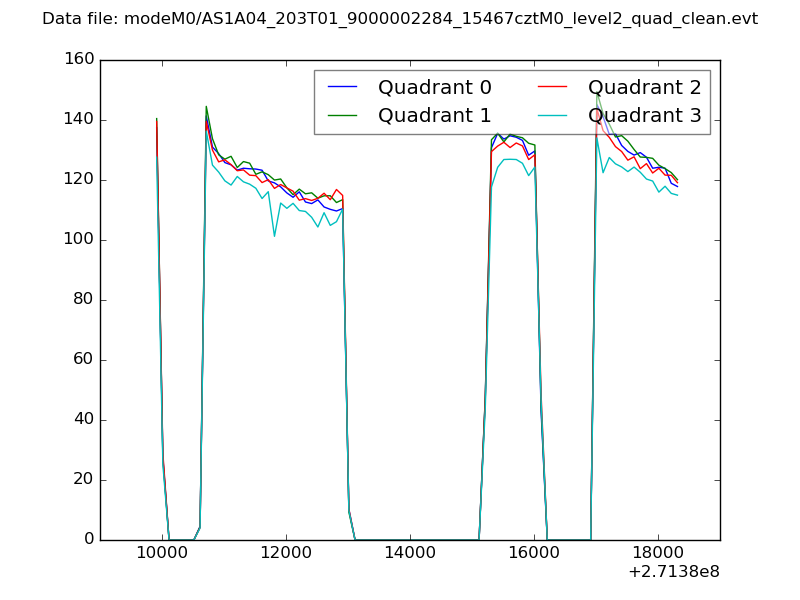 |
|
| Module-wise count rates for Quadrant A Data is divided into 100 sec bins |
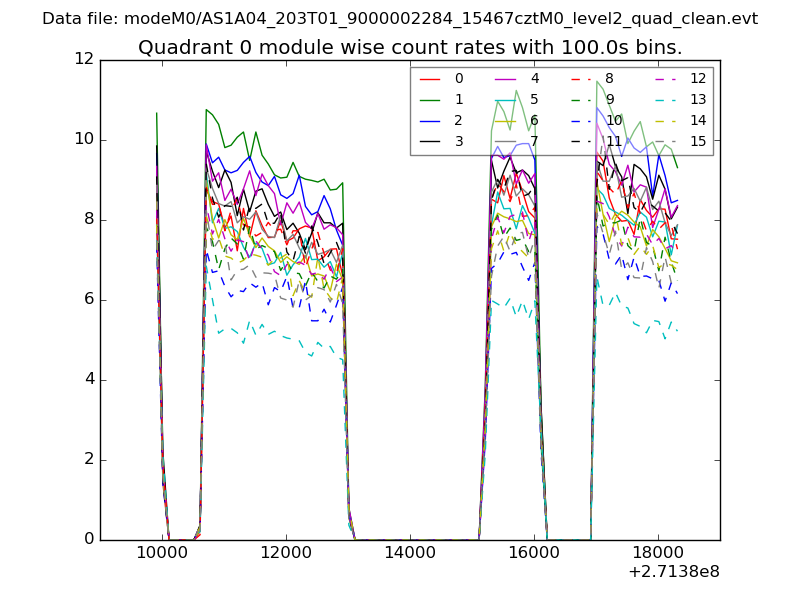 |
 |
| Module-wise count rates for Quadrant B Data is divided into 100 sec bins |
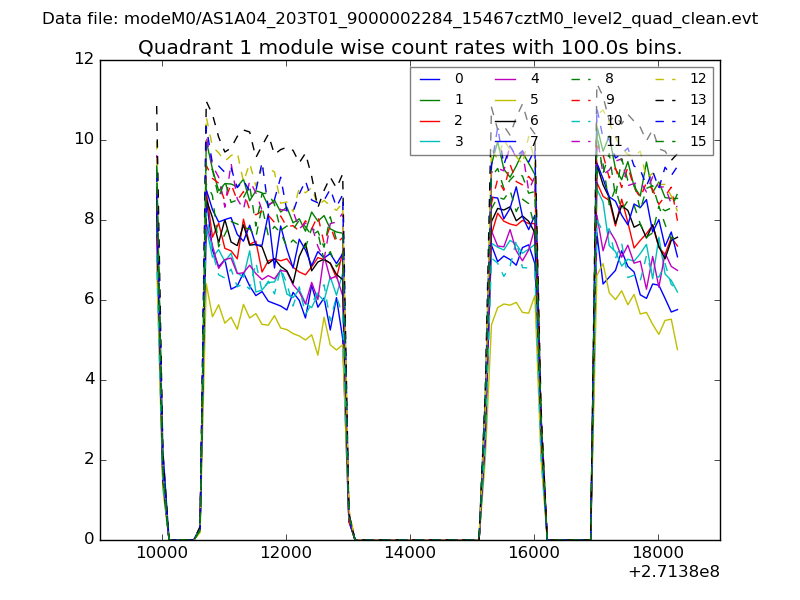 |
 |
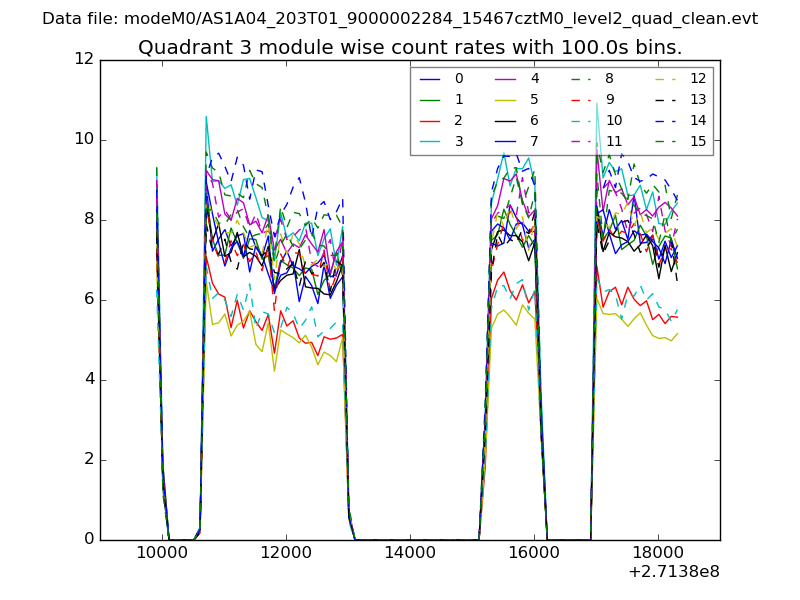
| Module-wise count rates for Quadrant C Data is divided into 100 sec bins |
 |
 |
| Module-wise count rates for Quadrant D Data is divided into 100 sec bins |
 |
 |
| Parameter | Plot |
|---|---|
| CZT HV Monitor | 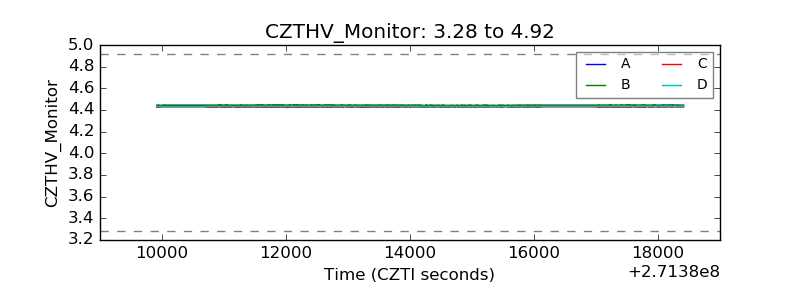 |
| D_VDD | 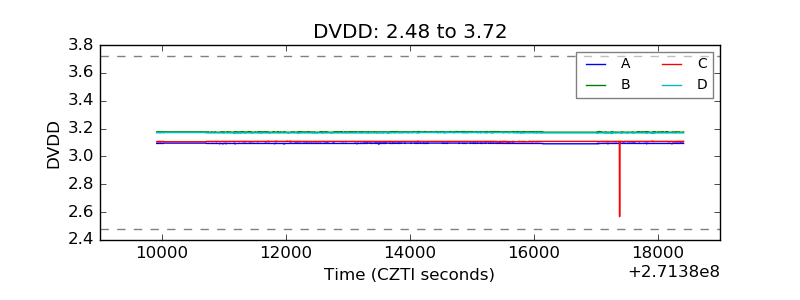 |
| Temperature 1 | 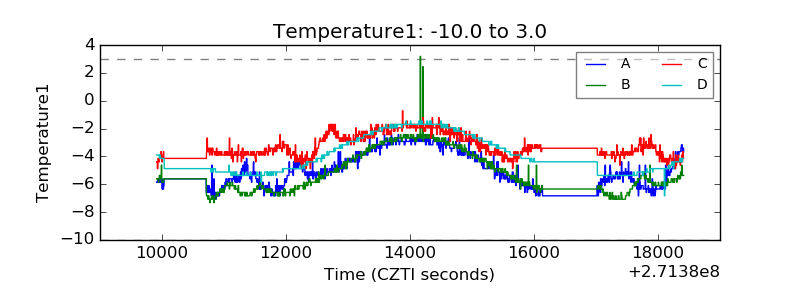 |
| Veto HV Monitor | 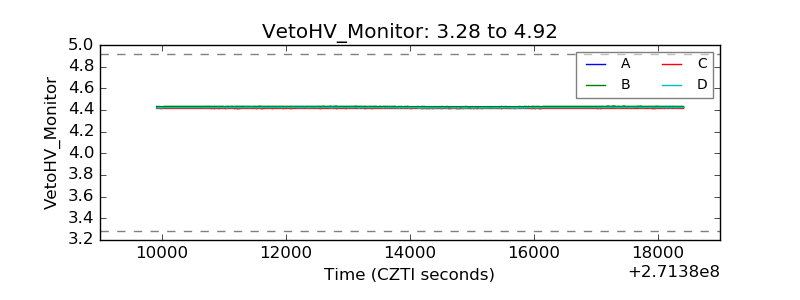 |
| Veto LLD | 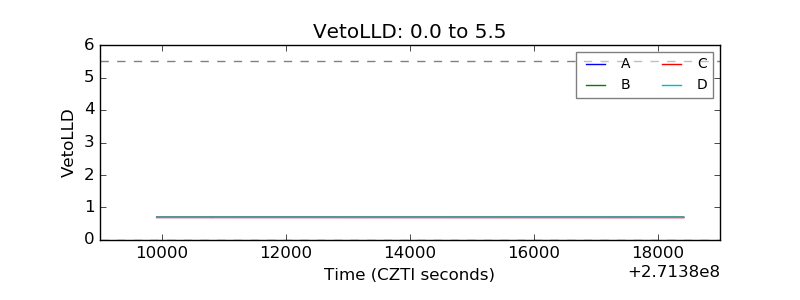 |
| Alpha Counter | 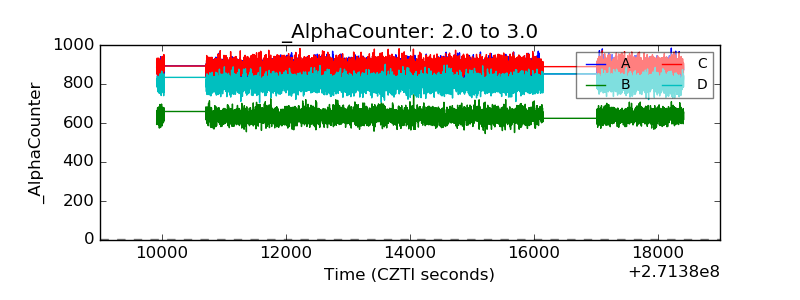 |
| _CPM_Rate | 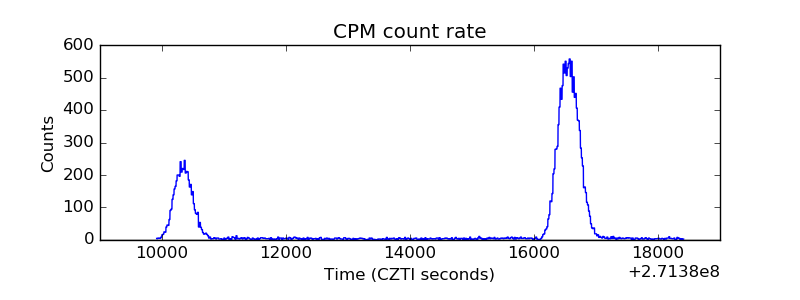 |
| CZT Counter |  |
| +2.5 Volts monitor |  |
| +5 Volts monitor |  |
| _ROLL_ROT | 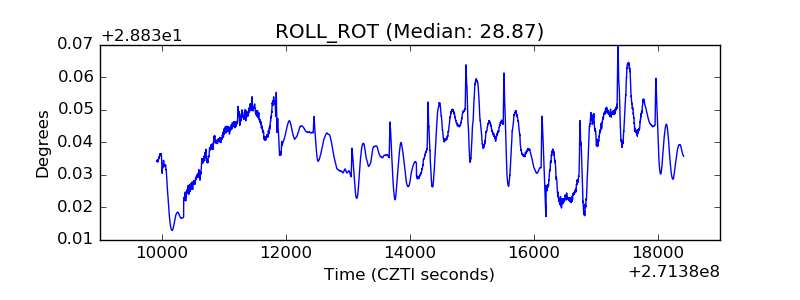 |
| _Roll_DEC | 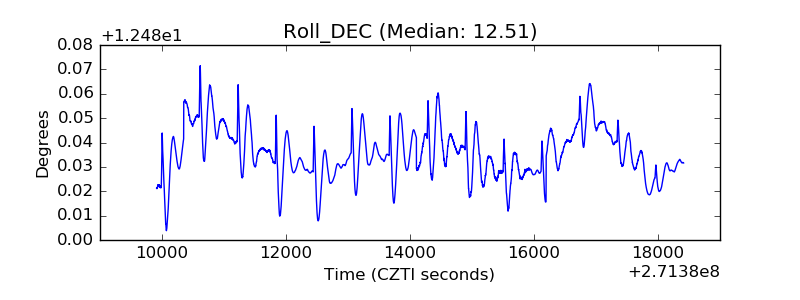 |
| _Roll_RA | 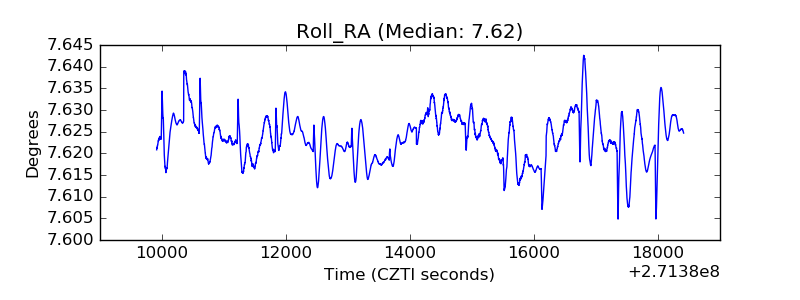 |
| Veto Counter | 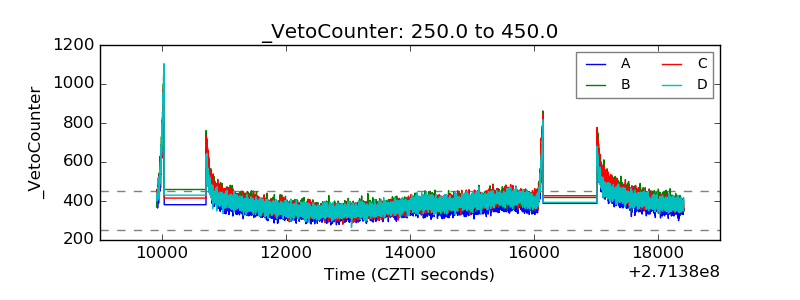 |