| Param | Original file | Final file |
|---|---|---|
| Filename | modeM0/AS1A04_203T01_9000002284_15468cztM0_level2.evt | modeM0/AS1A04_203T01_9000002284_15468cztM0_level2_quad_clean.evt |
| Size (bytes) | 483,943,680 | 92,064,960 |
| Size | 461.5 MB | 87.8 MB |
| Events in quadrant A | 3,226,764 | 587,567 |
| Events in quadrant B | 3,315,655 | 596,246 |
| Events in quadrant C | 3,365,476 | 580,836 |
| Events in quadrant D | 4,290,331 | 553,230 |
| Mode M0 | |||
|---|---|---|---|
| Quadrant | BADHDUFLAG | Total packets | Discarded packets |
| A | 0 | 13814 | 3 |
| B | 0 | 14008 | 2 |
| C | 0 | 14082 | 2 |
| D | 0 | 17219 | 2 |
| Mode SS | |||
|---|---|---|---|
| Quadrant | BADHDUFLAG | Total packets | Discarded packets |
| A | 0 | 134 | 0 |
| B | 0 | 134 | 0 |
| C | 0 | 134 | 0 |
| D | 0 | 134 | 0 |
| Mode M9 | |||
|---|---|---|---|
| Quadrant | BADHDUFLAG | Total packets | Discarded packets |
| A | 0 | 11 | 0 |
| B | 0 | 11 | 0 |
| C | 0 | 11 | 0 |
| D | 0 | 12 | 0 |
| Quadrant | Total seconds | Saturated seconds | Saturation percentage |
|---|---|---|---|
| A | 6756 | 52 | 0.769686% |
| B | 6756 | 70 | 1.036116% |
| C | 6756 | 33 | 0.488455% |
| D | 6756 | 136 | 2.013025% |
Noise dominated data is calculated using 1-second bins in cleaned event files. If a bin has >2000 counts, and if more than 50% of those come from <1% of pixels, then it is considered to be noise-dominated and hence unusable.
| Quadrant | # 1 sec bins | Bins with >0 counts | Bins with >2000 counts | High rate bins dominated by noise | Noise dominated (total time) | Noise dominated (detector-on time) | Marked lightcurve |
|---|---|---|---|---|---|---|---|
| A | 7767 | 6758 | 0 | 0 | 0.00% | 0.00% | 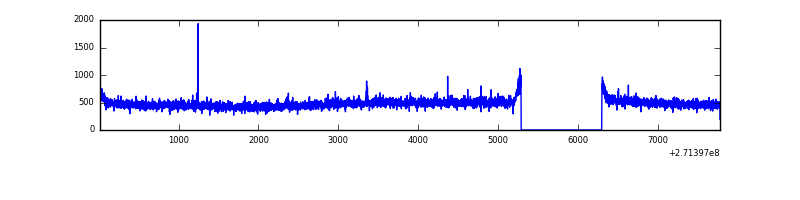 |
| B | 7767 | 6758 | 1 | 1 | 0.01% | 0.01% | 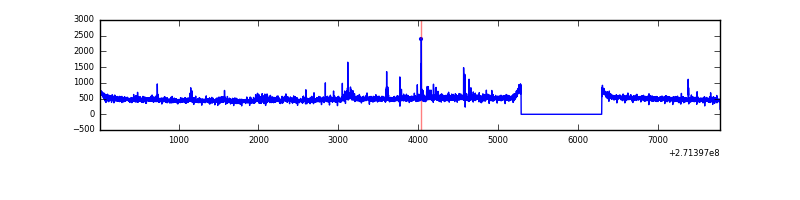 |
| C | 7767 | 6758 | 2 | 2 | 0.03% | 0.03% | 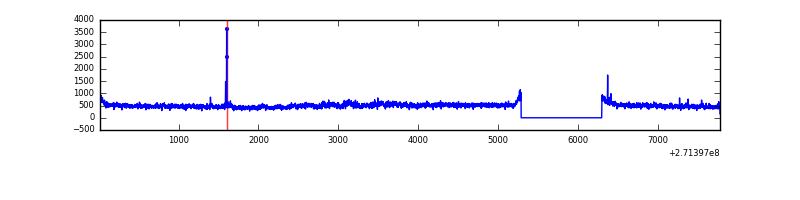 |
| D | 7767 | 6758 | 111 | 111 | 1.43% | 1.64% | 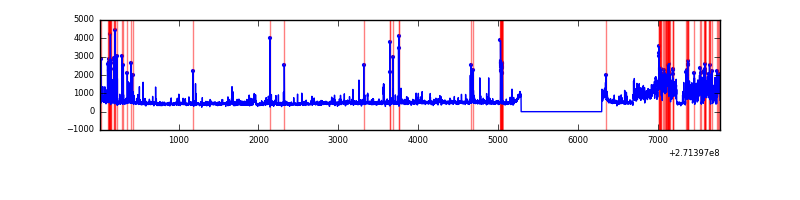 |
Top three noisy pixels from each quadrant. If the there are fewer than three noisy pixels in the level2.evt file, extra rows are filled as -1
| Pixel properties | Quadrant properties | ||||||
|---|---|---|---|---|---|---|---|
| Quadrant | DetID | PixID | Counts | Sigma | Mean | Median | Sigma |
| A | 3 | 1 | 45872 | 269.56 | 825 | 807 | 167.2 |
| A | 9 | 143 | 10046 | 55.26 | 825 | 807 | 167.2 |
| A | 0 | 226 | 7478 | 39.9 | 825 | 807 | 167.2 |
| B | 0 | 189 | 43379 | 271.13 | 819 | 799 | 157.0 |
| B | 4 | 142 | 21825 | 133.89 | 819 | 799 | 157.0 |
| B | 12 | 111 | 18852 | 114.96 | 819 | 799 | 157.0 |
| C | 3 | 233 | 259575 | 1395.09 | 793 | 796 | 185.5 |
| C | 10 | 22 | 14693 | 74.92 | 793 | 796 | 185.5 |
| C | 13 | 61 | 5643 | 26.13 | 793 | 796 | 185.5 |
| D | 1 | 52 | 1017279 | 5221.09 | 794 | 770 | 194.7 |
| D | 2 | 33 | 154670 | 790.47 | 794 | 770 | 194.7 |
| D | 5 | 222 | 44919 | 226.76 | 794 | 770 | 194.7 |
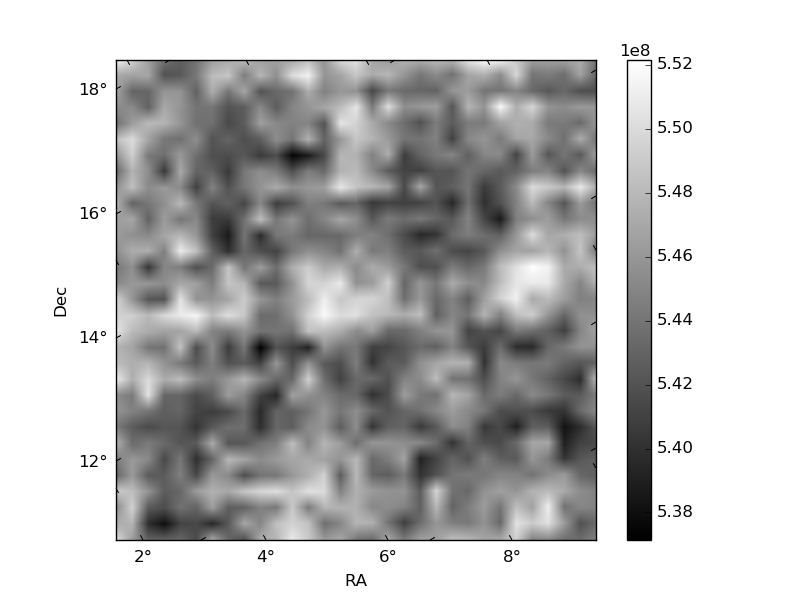
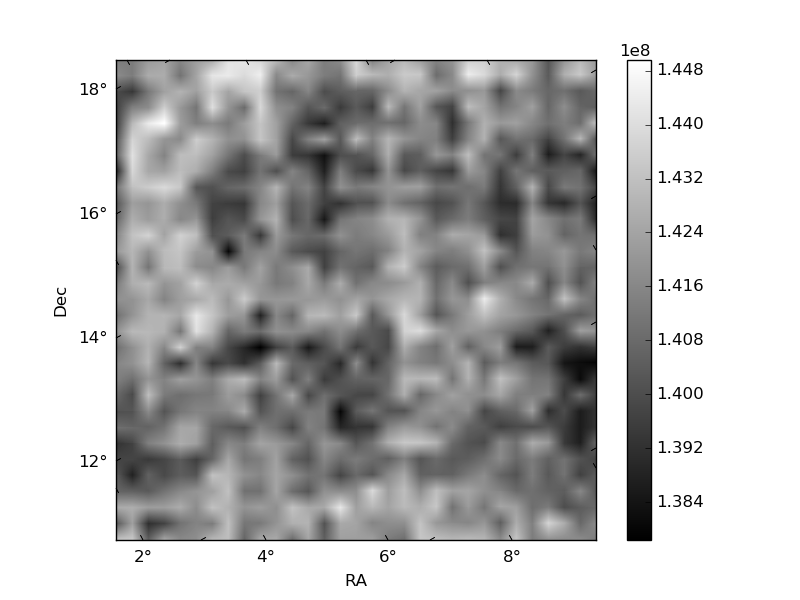
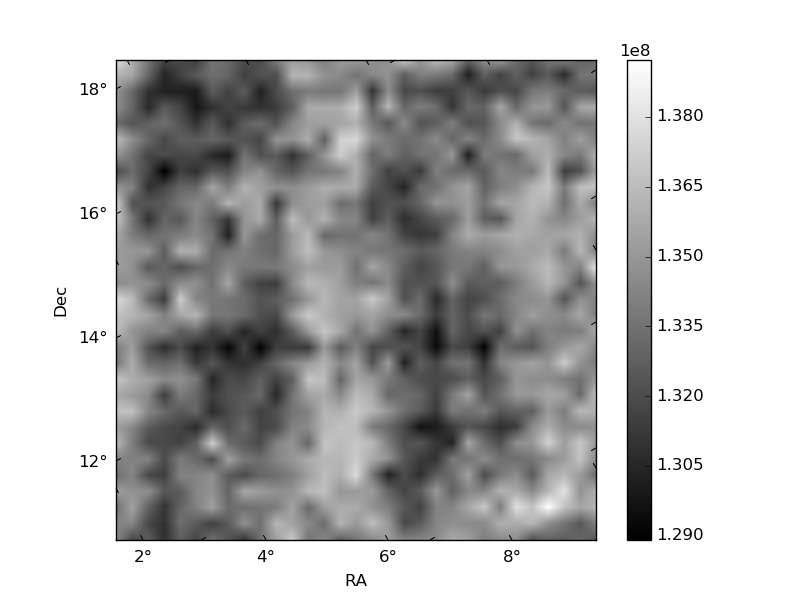
Histogram calculated using DETX and DETY for each event in the final _common_clean file
| Quadrant A | 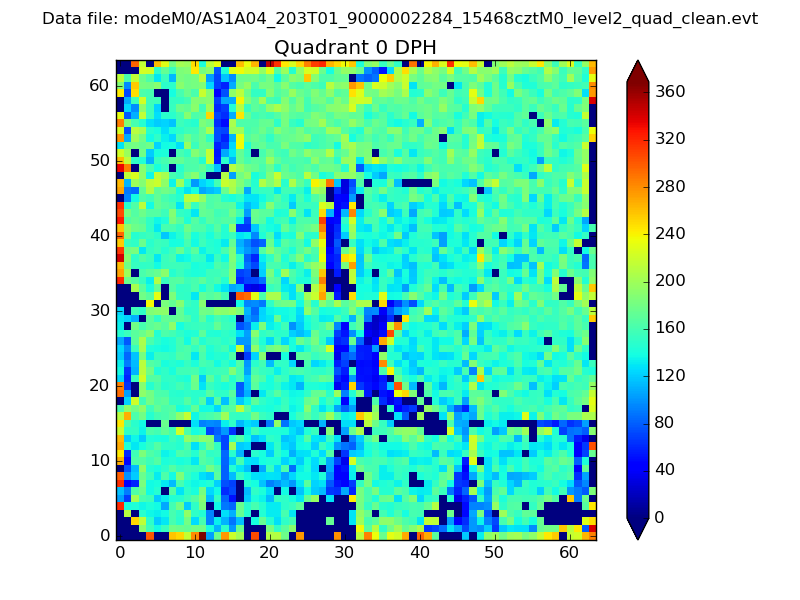 |
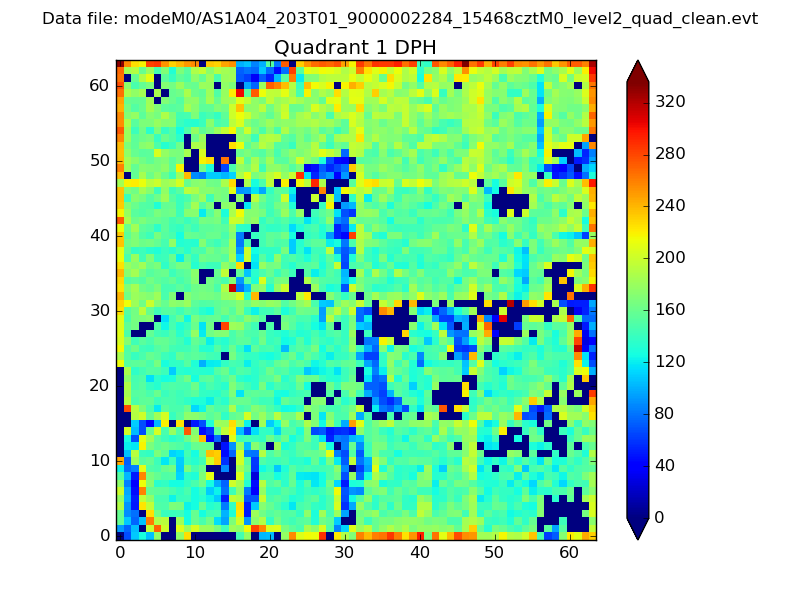 |
Quadrant B |
|---|---|---|---|
| Quadrant D | 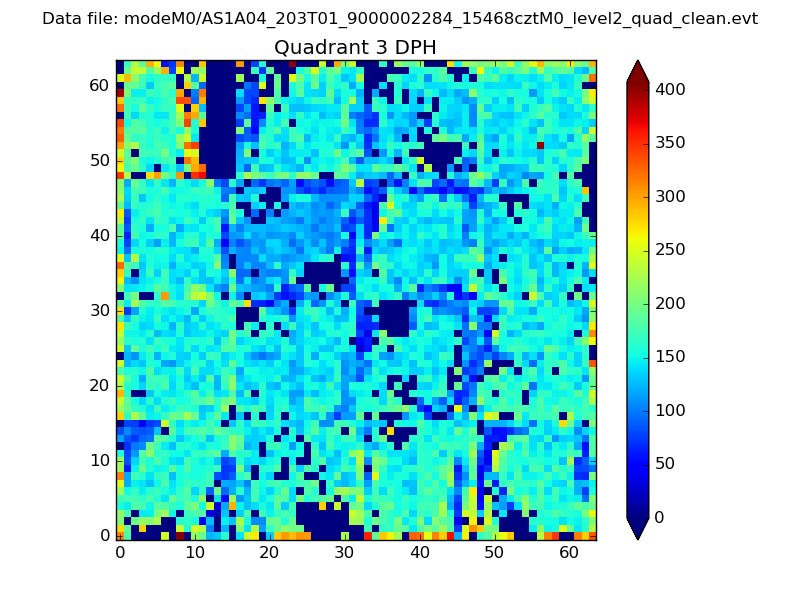 |
 |
Quadrant C |
| Plot type | Count rate plots | Images |
|---|---|---|
| Comparison with Poisson distribution Blue bars denote a histogram of data divided into 1 sec bins. Red curve is a Poisson curve with rate = median count rate of data. |
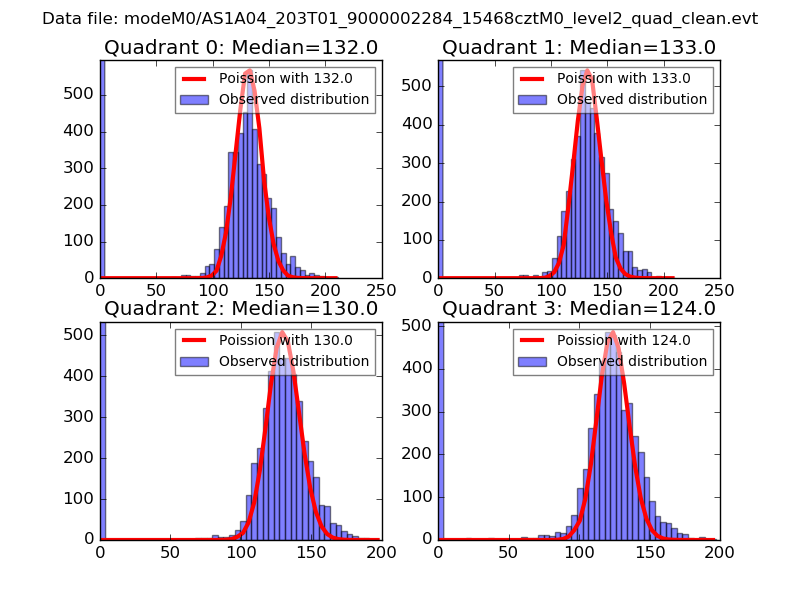 |
 |
| Quadrant-wise count rates Data is divided into 100 sec bins |
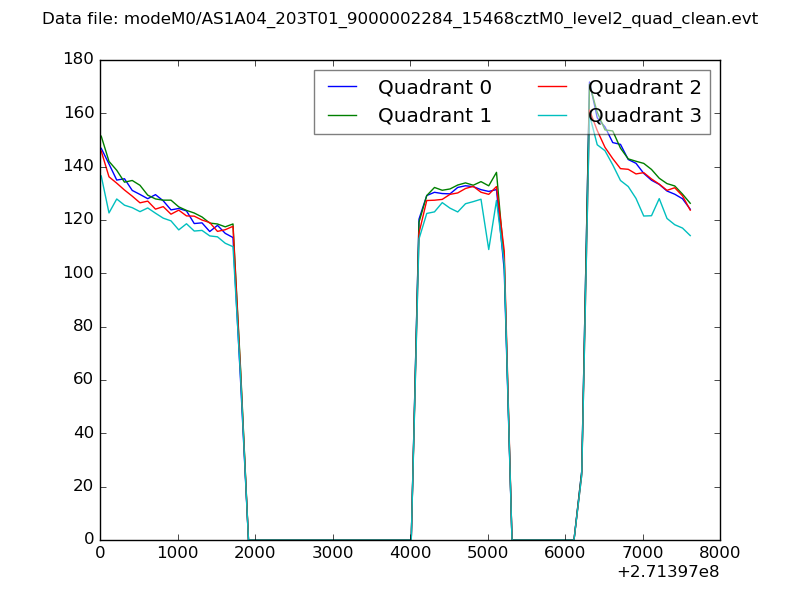 |
|
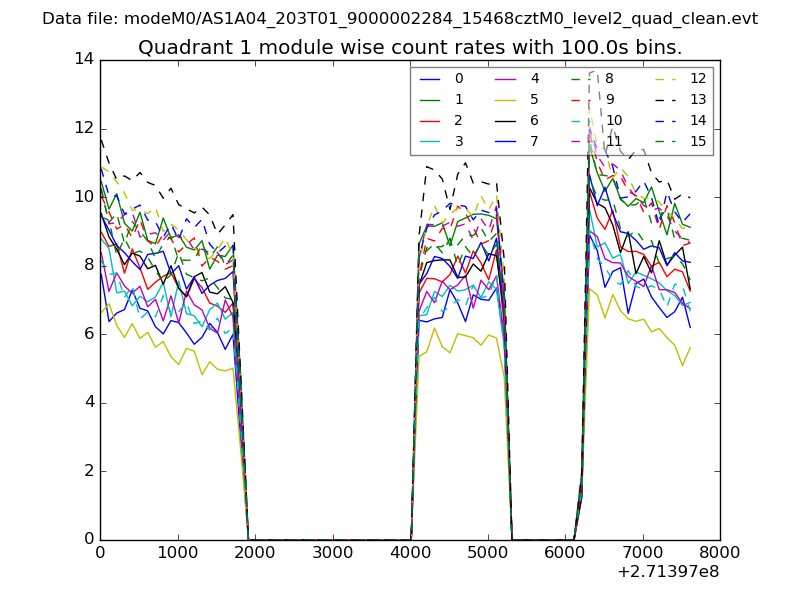
| Module-wise count rates for Quadrant A Data is divided into 100 sec bins |
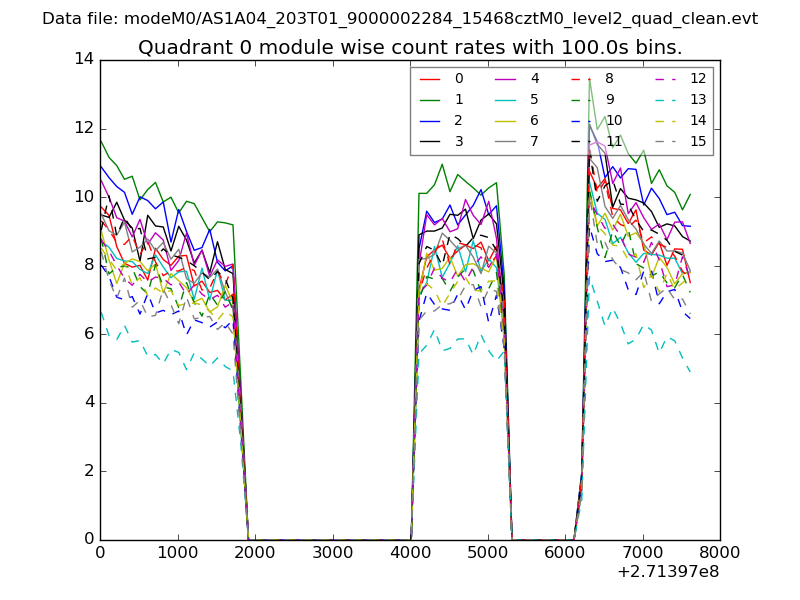 |
 |
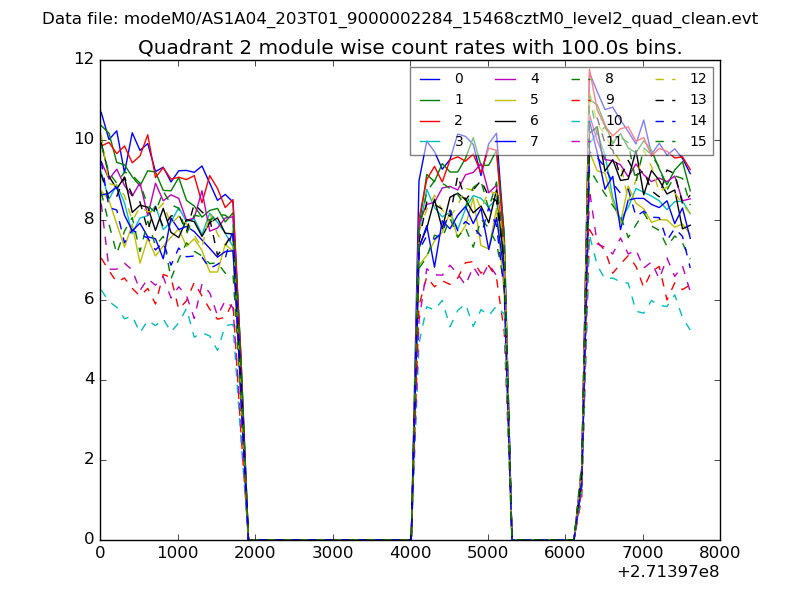
| Module-wise count rates for Quadrant B Data is divided into 100 sec bins |
 |
 |
| Module-wise count rates for Quadrant C Data is divided into 100 sec bins |
 |
 |
| Module-wise count rates for Quadrant D Data is divided into 100 sec bins |
 |
 |
| Parameter | Plot |
|---|---|
| CZT HV Monitor | 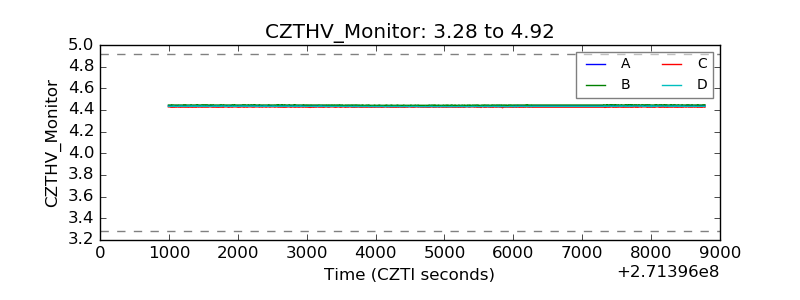 |
| D_VDD | 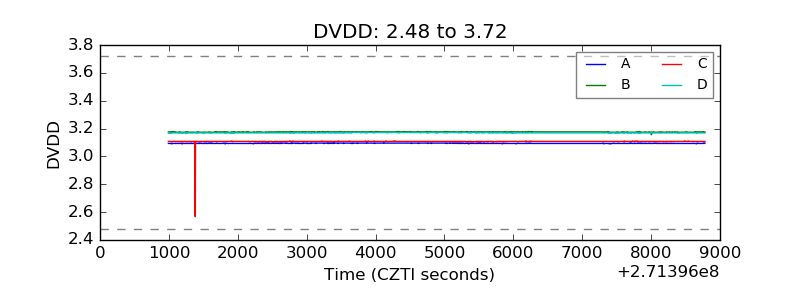 |
| Temperature 1 | 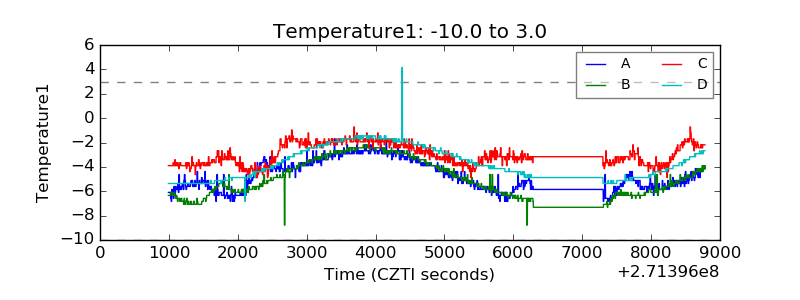 |
| Veto HV Monitor | 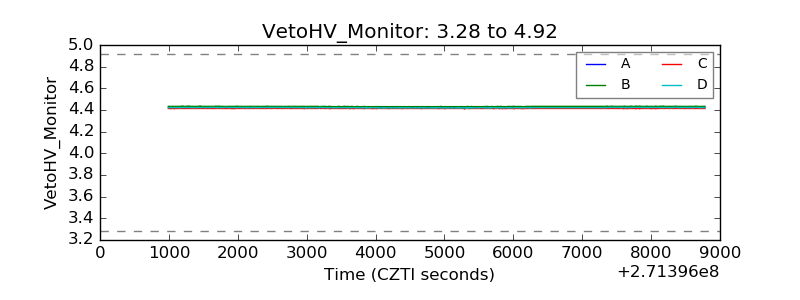 |
| Veto LLD | 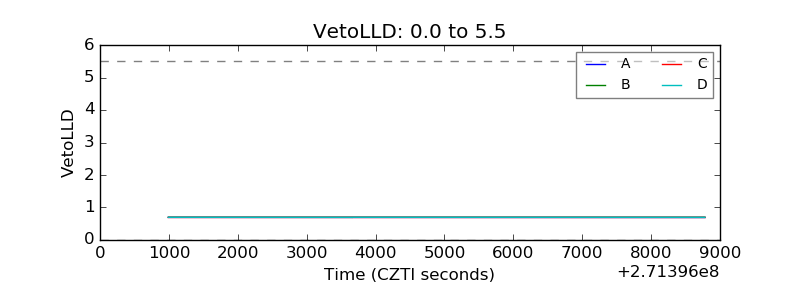 |
| Alpha Counter | 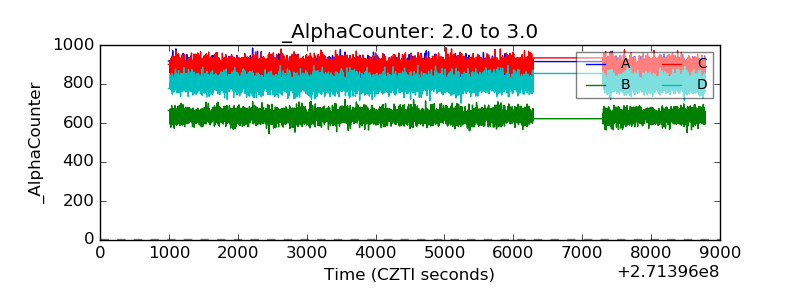 |
| _CPM_Rate | 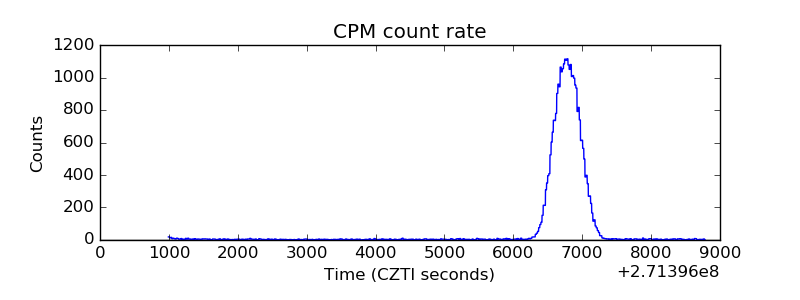 |
| CZT Counter |  |
| +2.5 Volts monitor |  |
| +5 Volts monitor | 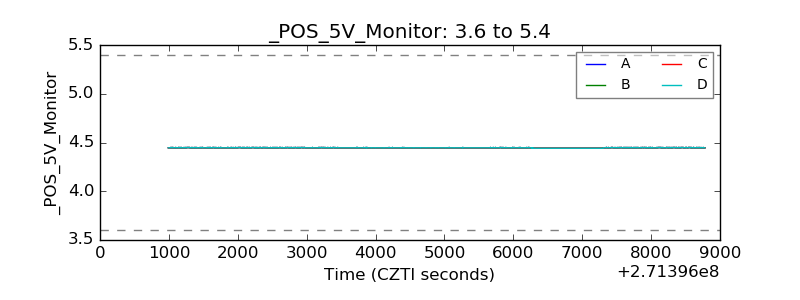 |
| _ROLL_ROT | 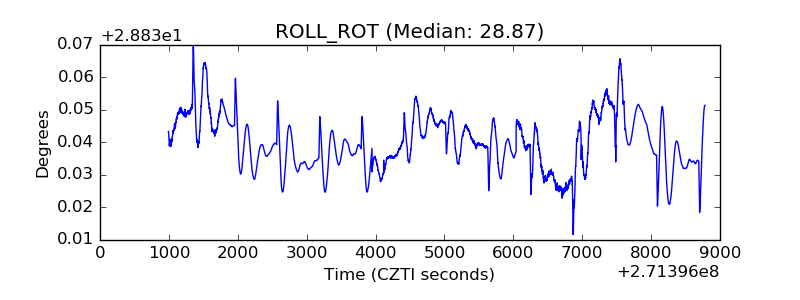 |
| _Roll_DEC | 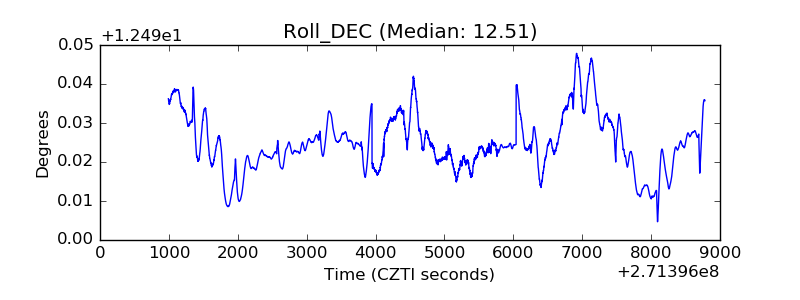 |
| _Roll_RA | 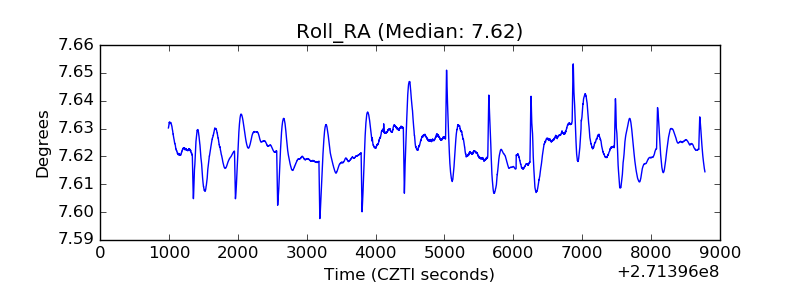 |
| Veto Counter | 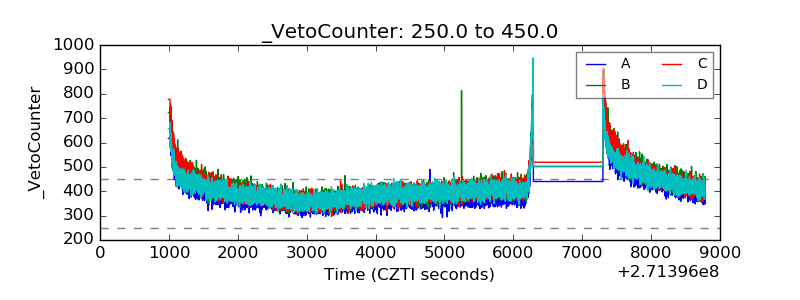 |