| Param | Original file | Final file |
|---|---|---|
| Filename | modeM0/AS1A04_203T01_9000002284_15471cztM0_level2.evt | modeM0/AS1A04_203T01_9000002284_15471cztM0_level2_quad_clean.evt |
| Size (bytes) | 494,357,760 | 80,297,280 |
| Size | 471.5 MB | 76.6 MB |
| Events in quadrant A | 3,414,346 | 508,162 |
| Events in quadrant B | 3,368,192 | 511,995 |
| Events in quadrant C | 3,315,461 | 492,166 |
| Events in quadrant D | 4,440,532 | 473,644 |
| Mode M0 | |||
|---|---|---|---|
| Quadrant | BADHDUFLAG | Total packets | Discarded packets |
| A | 0 | 13928 | 2 |
| B | 0 | 13701 | 1 |
| C | 0 | 13607 | 1 |
| D | 0 | 17356 | 1 |
| Mode SS | |||
|---|---|---|---|
| Quadrant | BADHDUFLAG | Total packets | Discarded packets |
| A | 0 | 128 | 0 |
| B | 0 | 128 | 0 |
| C | 0 | 128 | 0 |
| D | 0 | 128 | 0 |
| Mode M9 | |||
|---|---|---|---|
| Quadrant | BADHDUFLAG | Total packets | Discarded packets |
| A | 0 | 13 | 0 |
| B | 0 | 13 | 0 |
| C | 0 | 13 | 0 |
| D | 0 | 13 | 0 |
| Quadrant | Total seconds | Saturated seconds | Saturation percentage |
|---|---|---|---|
| A | 6389 | 60 | 0.939114% |
| B | 6389 | 52 | 0.813899% |
| C | 6389 | 50 | 0.782595% |
| D | 6389 | 257 | 4.022539% |
Noise dominated data is calculated using 1-second bins in cleaned event files. If a bin has >2000 counts, and if more than 50% of those come from <1% of pixels, then it is considered to be noise-dominated and hence unusable.
| Quadrant | # 1 sec bins | Bins with >0 counts | Bins with >2000 counts | High rate bins dominated by noise | Noise dominated (total time) | Noise dominated (detector-on time) | Marked lightcurve |
|---|---|---|---|---|---|---|---|
| A | 7630 | 6391 | 5 | 5 | 0.07% | 0.08% | 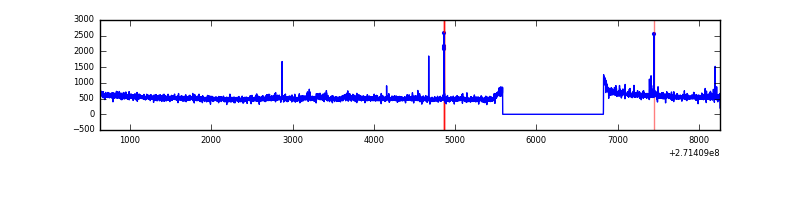 |
| B | 7630 | 6391 | 0 | 0 | 0.00% | 0.00% | 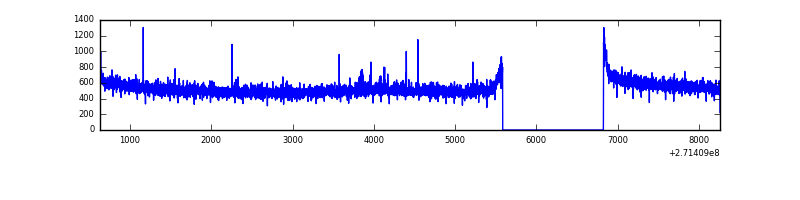 |
| C | 7630 | 6391 | 1 | 1 | 0.01% | 0.02% | 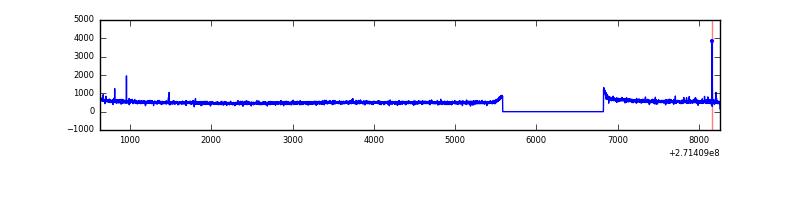 |
| D | 7630 | 6391 | 183 | 183 | 2.40% | 2.86% | 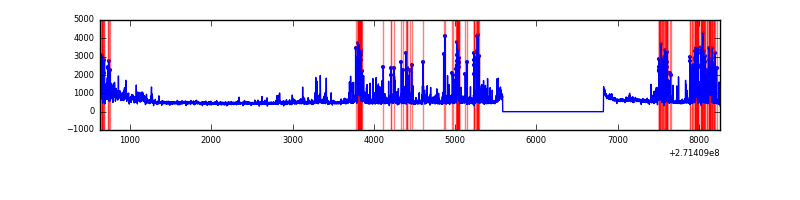 |
Top three noisy pixels from each quadrant. If the there are fewer than three noisy pixels in the level2.evt file, extra rows are filled as -1
| Pixel properties | Quadrant properties | ||||||
|---|---|---|---|---|---|---|---|
| Quadrant | DetID | PixID | Counts | Sigma | Mean | Median | Sigma |
| A | 3 | 1 | 40546 | 228.15 | 865 | 849 | 174.0 |
| A | 15 | 69 | 16118 | 87.76 | 865 | 849 | 174.0 |
| A | 7 | 16 | 15505 | 84.23 | 865 | 849 | 174.0 |
| B | 0 | 189 | 28628 | 171.13 | 852 | 835 | 162.4 |
| B | 12 | 111 | 18172 | 106.75 | 852 | 835 | 162.4 |
| B | 11 | 111 | 15686 | 91.44 | 852 | 835 | 162.4 |
| C | 3 | 233 | 71093 | 377.97 | 816 | 820 | 185.9 |
| C | 14 | 238 | 32650 | 171.2 | 816 | 820 | 185.9 |
| C | 10 | 22 | 19408 | 99.98 | 816 | 820 | 185.9 |
| D | 1 | 52 | 952868 | 4707.46 | 828 | 806 | 202.2 |
| D | 2 | 33 | 185126 | 911.37 | 828 | 806 | 202.2 |
| D | 5 | 222 | 137419 | 675.48 | 828 | 806 | 202.2 |
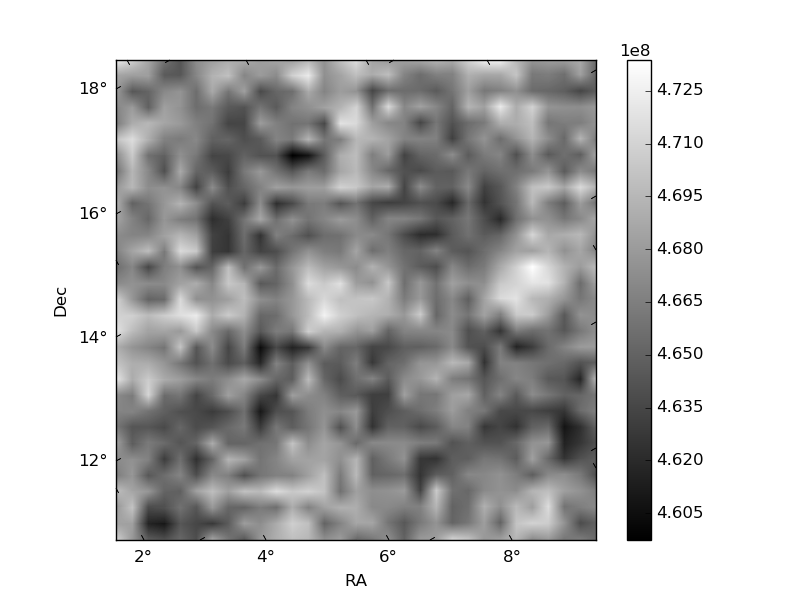
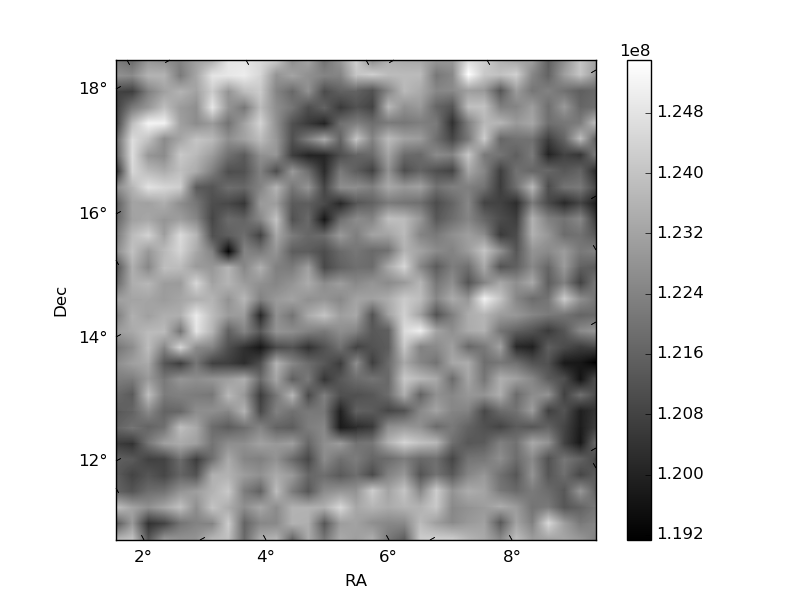
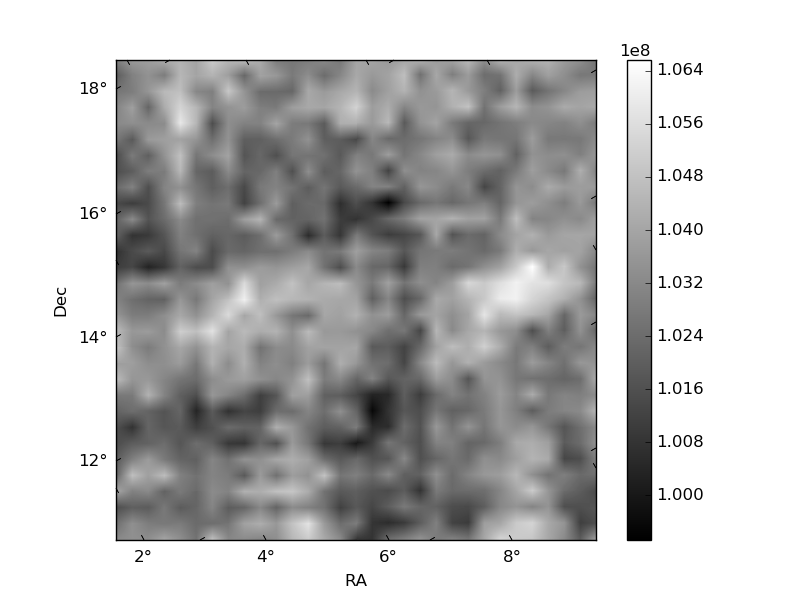
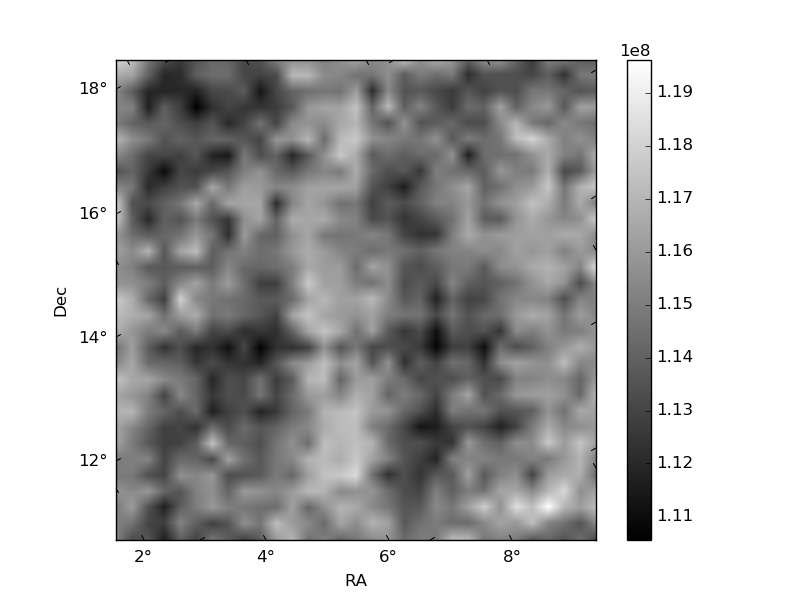
Histogram calculated using DETX and DETY for each event in the final _common_clean file
| Quadrant A | 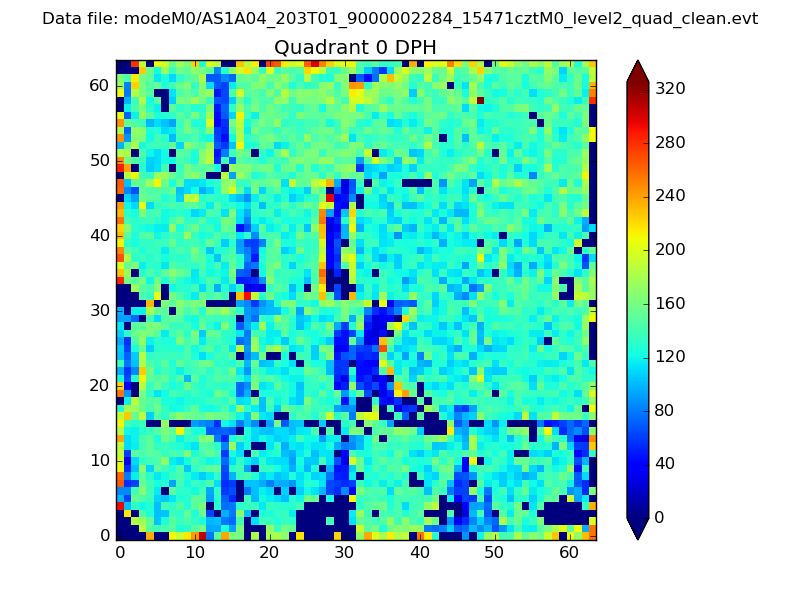 |
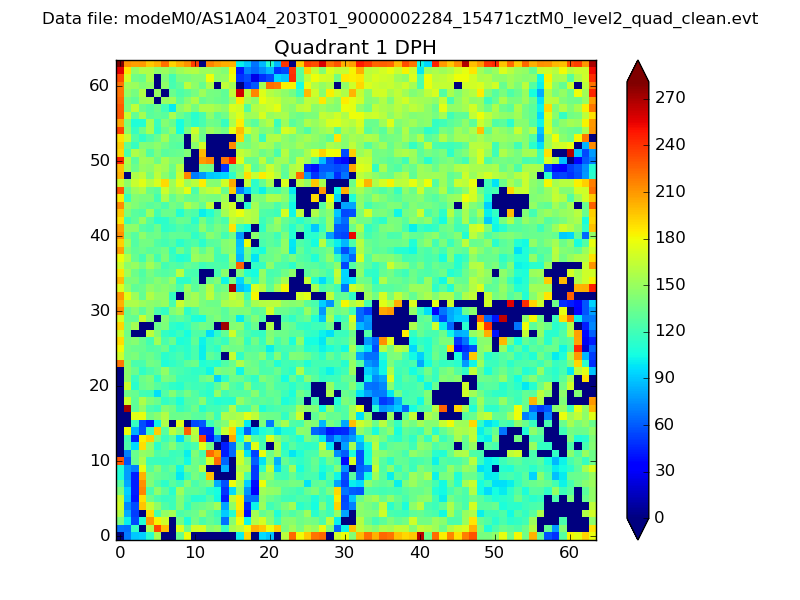 |
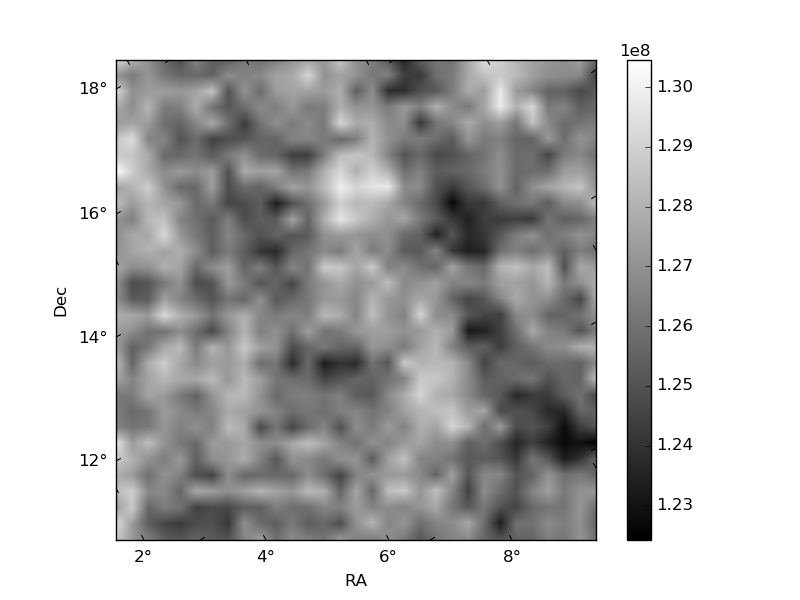
Quadrant B |
|---|---|---|---|
| Quadrant D | 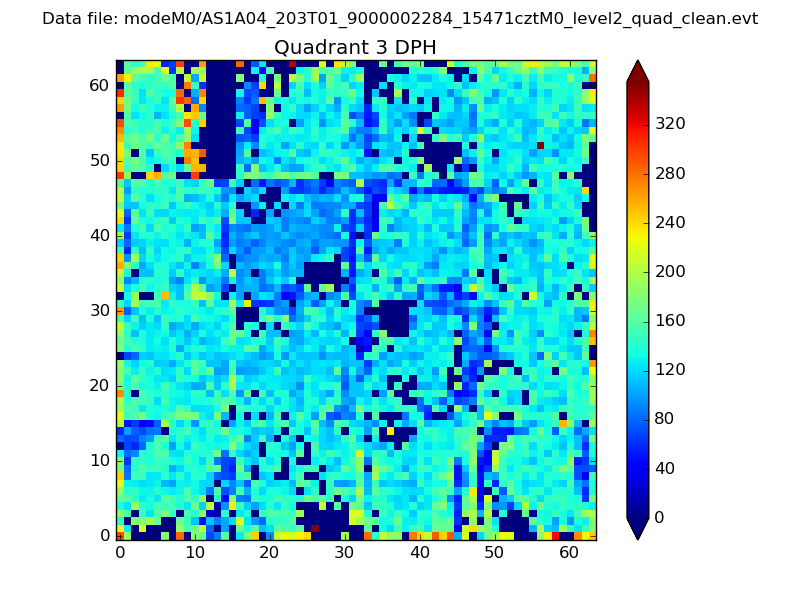 |
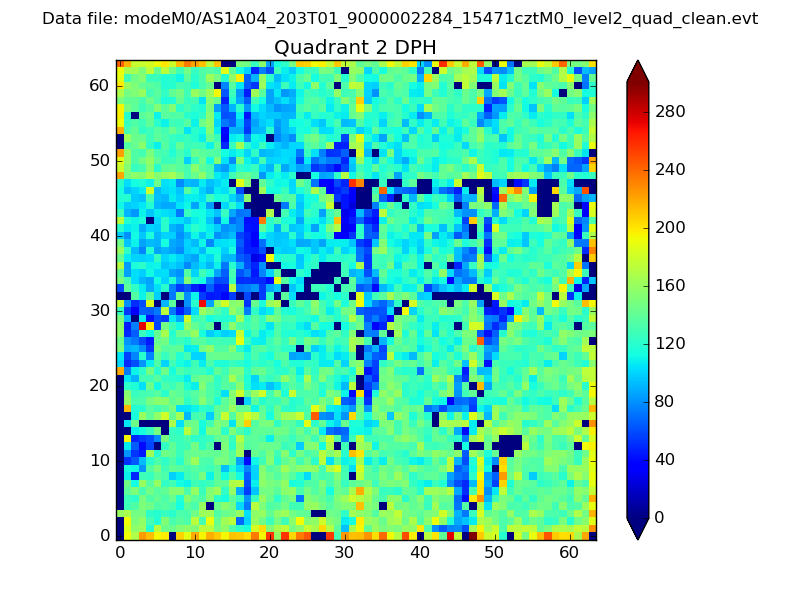 |
Quadrant C |
| Plot type | Count rate plots | Images |
|---|---|---|
| Comparison with Poisson distribution Blue bars denote a histogram of data divided into 1 sec bins. Red curve is a Poisson curve with rate = median count rate of data. |
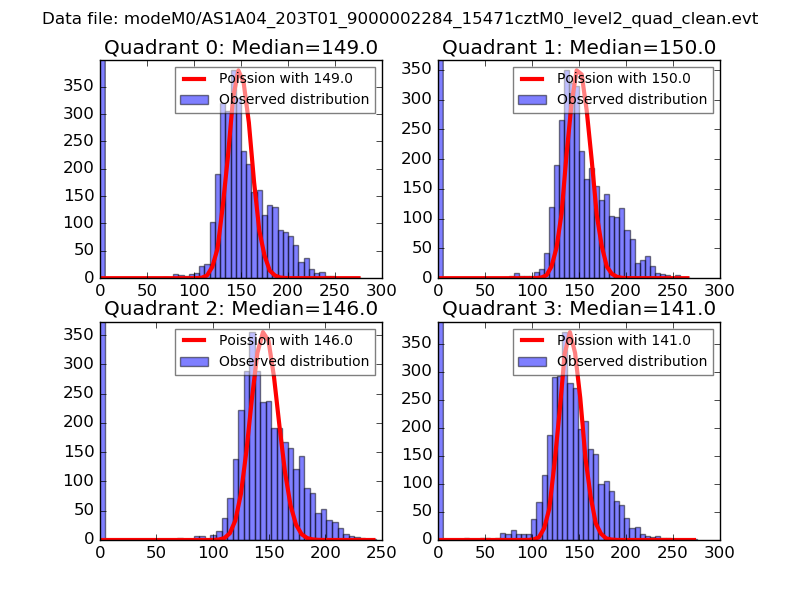 |
 |
| Quadrant-wise count rates Data is divided into 100 sec bins |
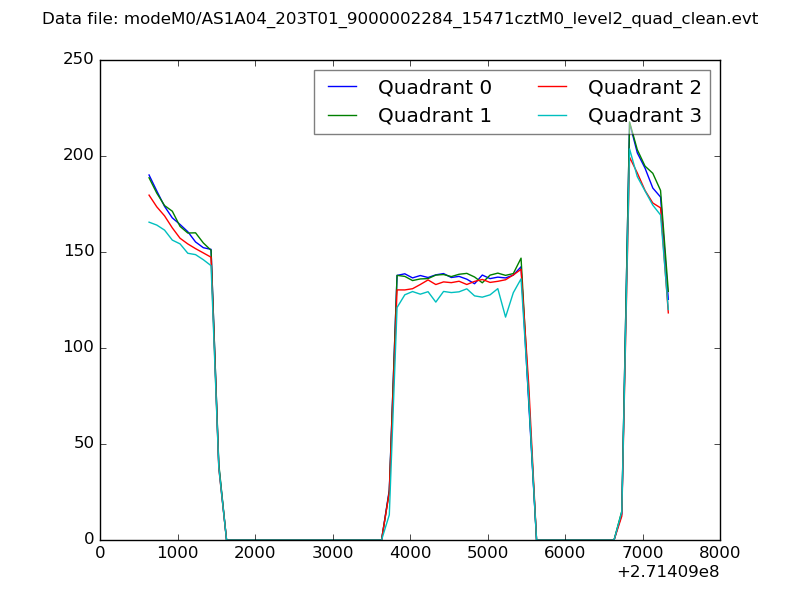 |
|
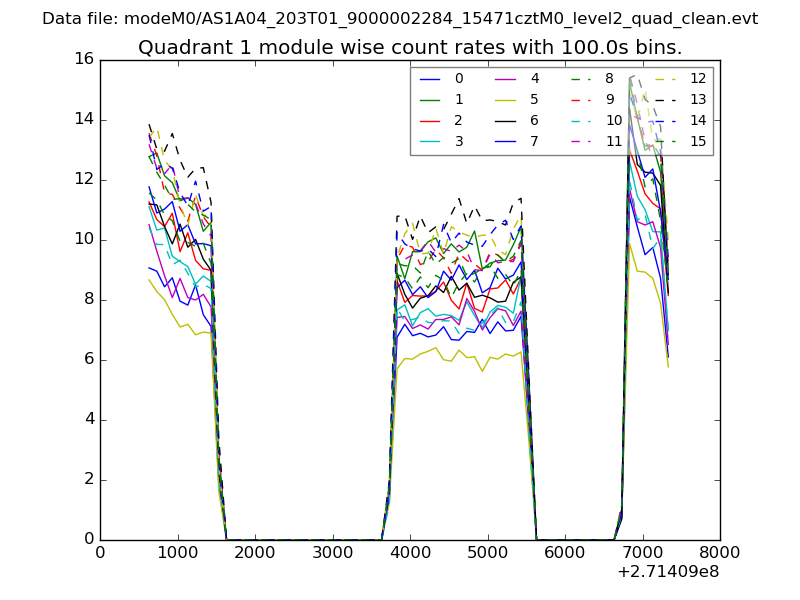
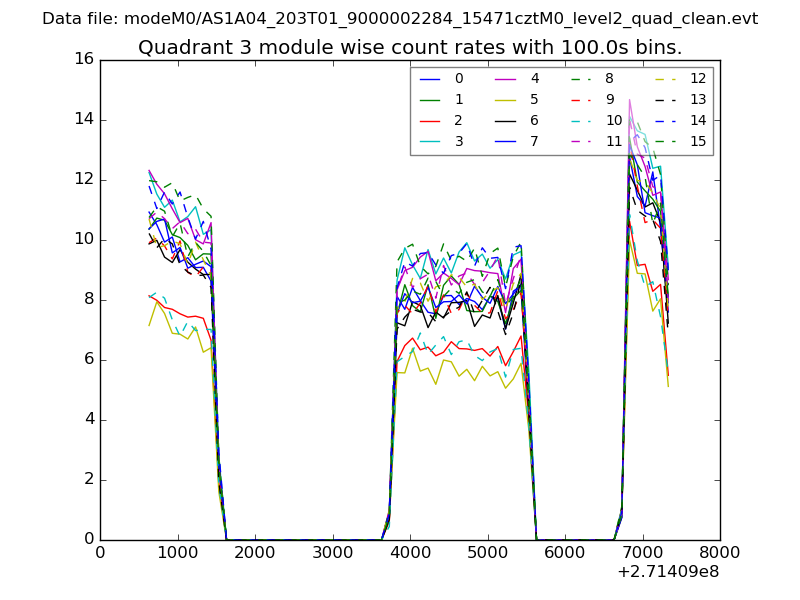
| Module-wise count rates for Quadrant A Data is divided into 100 sec bins |
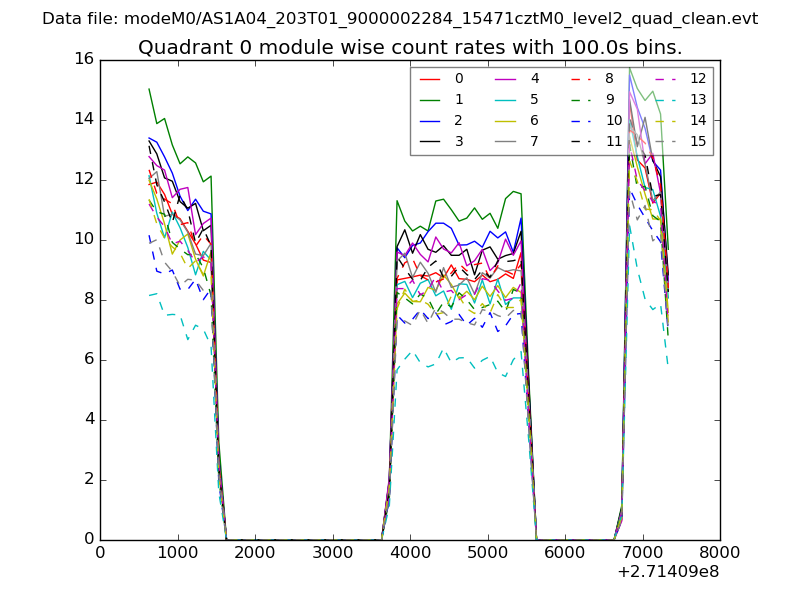 |
 |
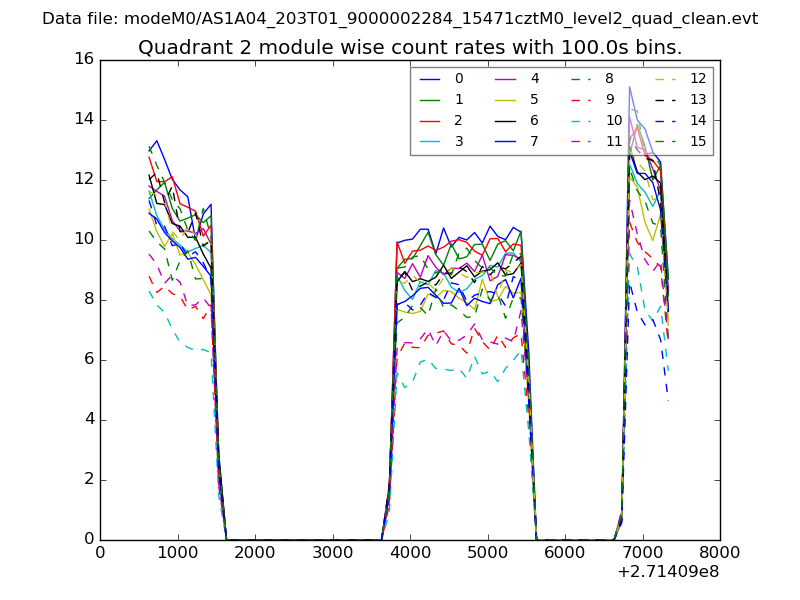
| Module-wise count rates for Quadrant B Data is divided into 100 sec bins |
 |
 |
| Module-wise count rates for Quadrant C Data is divided into 100 sec bins |
 |
 |
| Module-wise count rates for Quadrant D Data is divided into 100 sec bins |
 |
 |
| Parameter | Plot |
|---|---|
| CZT HV Monitor | 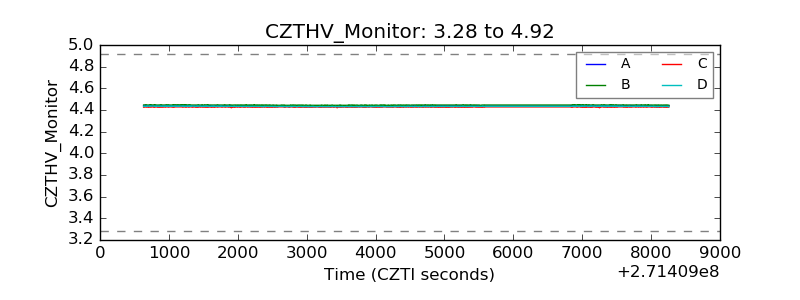 |
| D_VDD | 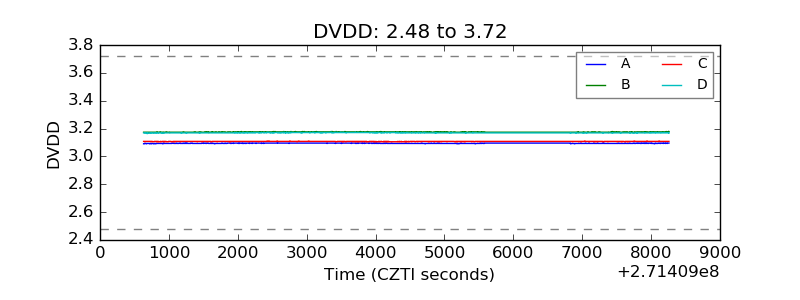 |
| Temperature 1 | 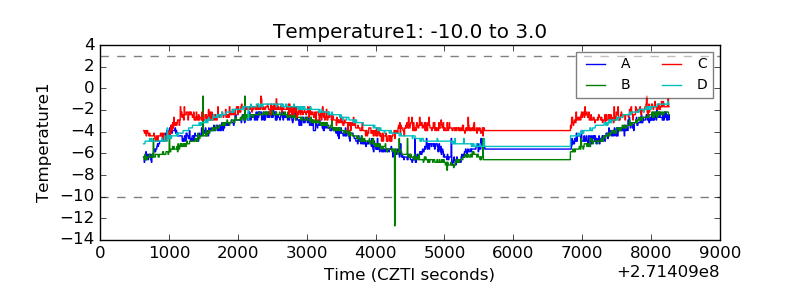 |
| Veto HV Monitor | 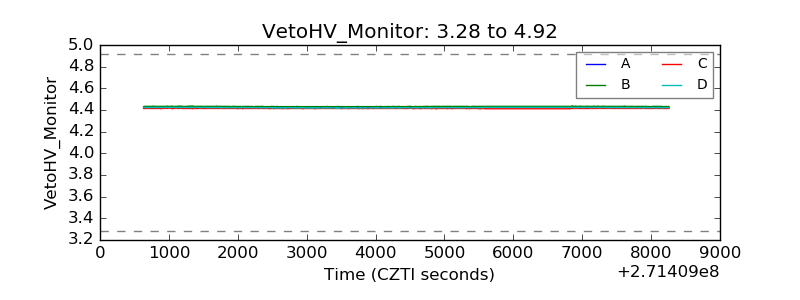 |
| Veto LLD | 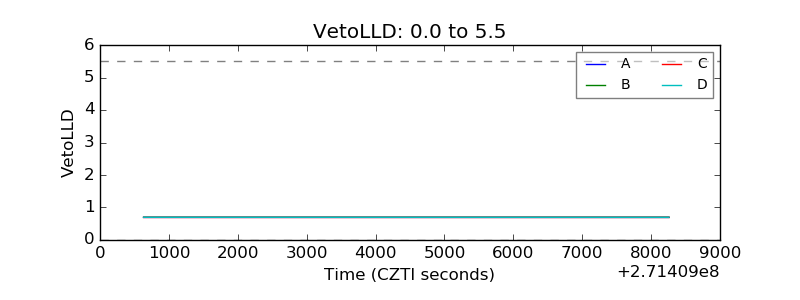 |
| Alpha Counter | 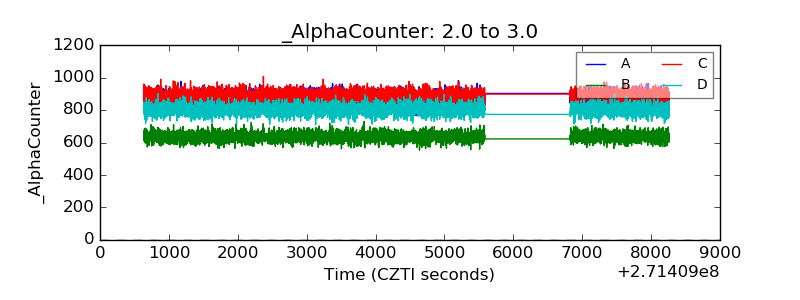 |
| _CPM_Rate | 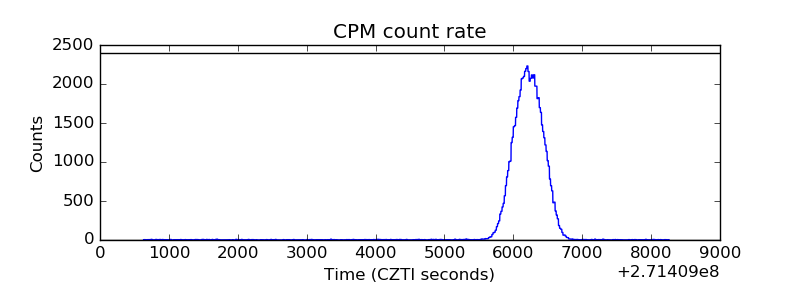 |
| CZT Counter | 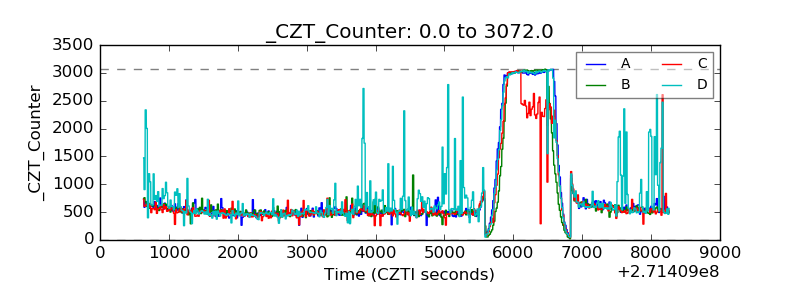 |
| +2.5 Volts monitor |  |
| +5 Volts monitor |  |
| _ROLL_ROT | 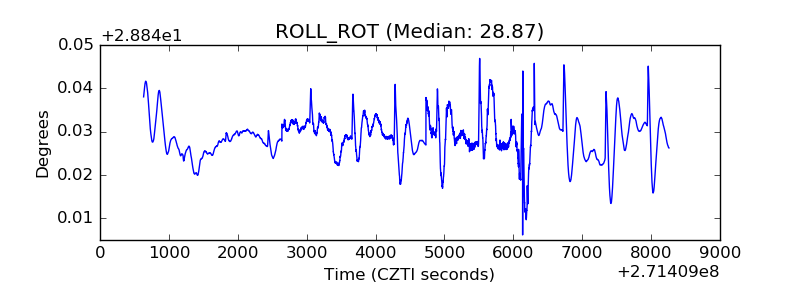 |
| _Roll_DEC | 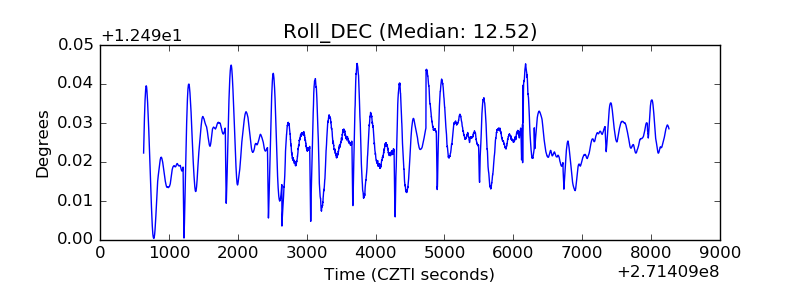 |
| _Roll_RA | 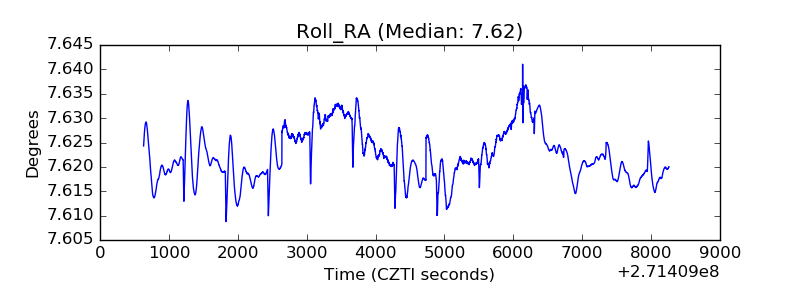 |
| Veto Counter | 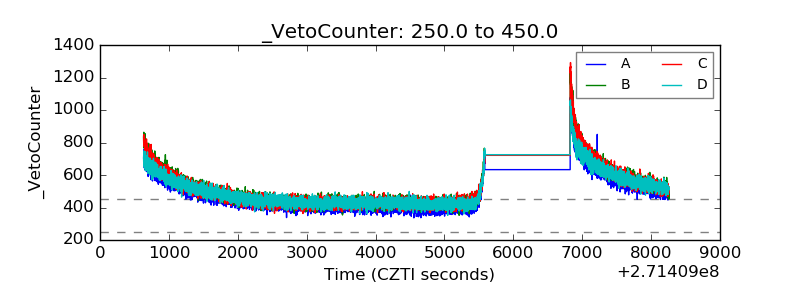 |