| Param | Original file | Final file |
|---|---|---|
| Filename | modeM0/AS1A04_203T01_9000002284_15472cztM0_level2.evt | modeM0/AS1A04_203T01_9000002284_15472cztM0_level2_quad_clean.evt |
| Size (bytes) | 548,942,400 | 69,344,640 |
| Size | 523.5 MB | 66.1 MB |
| Events in quadrant A | 3,413,359 | 430,697 |
| Events in quadrant B | 3,457,290 | 435,360 |
| Events in quadrant C | 3,404,630 | 411,416 |
| Events in quadrant D | 5,925,934 | 385,591 |
| Mode M0 | |||
|---|---|---|---|
| Quadrant | BADHDUFLAG | Total packets | Discarded packets |
| A | 0 | 13934 | 2 |
| B | 0 | 14043 | 1 |
| C | 0 | 13728 | 1 |
| D | 0 | 21819 | 1 |
| Mode SS | |||
|---|---|---|---|
| Quadrant | BADHDUFLAG | Total packets | Discarded packets |
| A | 0 | 126 | 0 |
| B | 0 | 126 | 0 |
| C | 0 | 126 | 0 |
| D | 0 | 126 | 0 |
| Mode M9 | |||
|---|---|---|---|
| Quadrant | BADHDUFLAG | Total packets | Discarded packets |
| A | 0 | 13 | 0 |
| B | 0 | 13 | 0 |
| C | 0 | 13 | 0 |
| D | 0 | 13 | 0 |
| Quadrant | Total seconds | Saturated seconds | Saturation percentage |
|---|---|---|---|
| A | 6255 | 71 | 1.135092% |
| B | 6255 | 74 | 1.183054% |
| C | 6255 | 84 | 1.342926% |
| D | 6255 | 786 | 12.565947% |
Noise dominated data is calculated using 1-second bins in cleaned event files. If a bin has >2000 counts, and if more than 50% of those come from <1% of pixels, then it is considered to be noise-dominated and hence unusable.
| Quadrant | # 1 sec bins | Bins with >0 counts | Bins with >2000 counts | High rate bins dominated by noise | Noise dominated (total time) | Noise dominated (detector-on time) | Marked lightcurve |
|---|---|---|---|---|---|---|---|
| A | 7576 | 6256 | 1 | 1 | 0.01% | 0.02% | 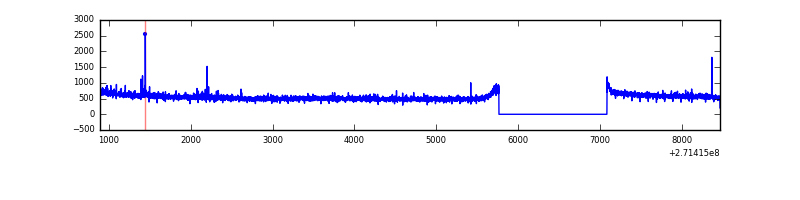 |
| B | 7576 | 6257 | 0 | 0 | 0.00% | 0.00% | 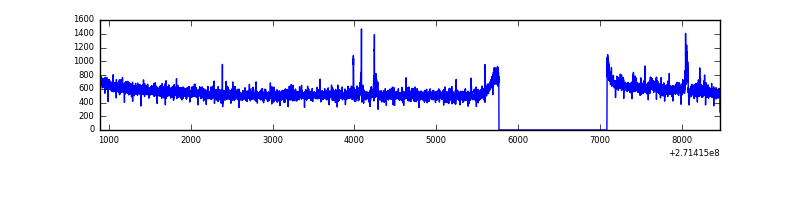 |
| C | 7576 | 6256 | 1 | 1 | 0.01% | 0.02% | 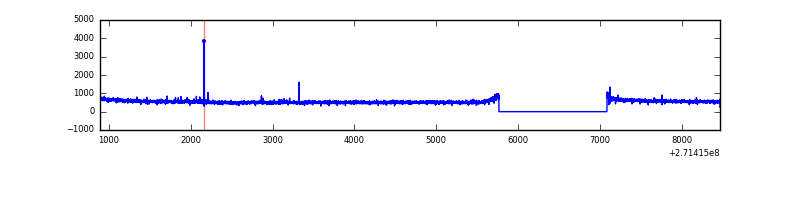 |
| D | 7576 | 6257 | 625 | 625 | 8.25% | 9.99% | 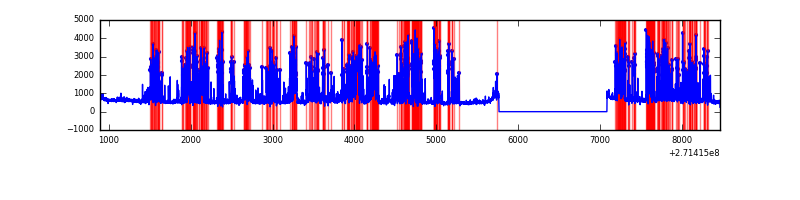 |
Top three noisy pixels from each quadrant. If the there are fewer than three noisy pixels in the level2.evt file, extra rows are filled as -1
| Pixel properties | Quadrant properties | ||||||
|---|---|---|---|---|---|---|---|
| Quadrant | DetID | PixID | Counts | Sigma | Mean | Median | Sigma |
| A | 9 | 143 | 16073 | 86.43 | 879 | 864 | 176.0 |
| A | 7 | 16 | 15204 | 81.49 | 879 | 864 | 176.0 |
| A | 0 | 226 | 7801 | 39.42 | 879 | 864 | 176.0 |
| B | 0 | 230 | 26831 | 161.42 | 866 | 849 | 161.0 |
| B | 12 | 111 | 18275 | 108.26 | 866 | 849 | 161.0 |
| B | 11 | 111 | 15613 | 91.73 | 866 | 849 | 161.0 |
| C | 14 | 238 | 128519 | 672.8 | 824 | 832 | 189.8 |
| C | 3 | 233 | 41367 | 213.59 | 824 | 832 | 189.8 |
| C | 10 | 22 | 18613 | 93.69 | 824 | 832 | 189.8 |
| D | 1 | 52 | 2111085 | 10654.78 | 813 | 791 | 198.1 |
| D | 2 | 33 | 306845 | 1545.25 | 813 | 791 | 198.1 |
| D | 12 | 221 | 299316 | 1507.24 | 813 | 791 | 198.1 |
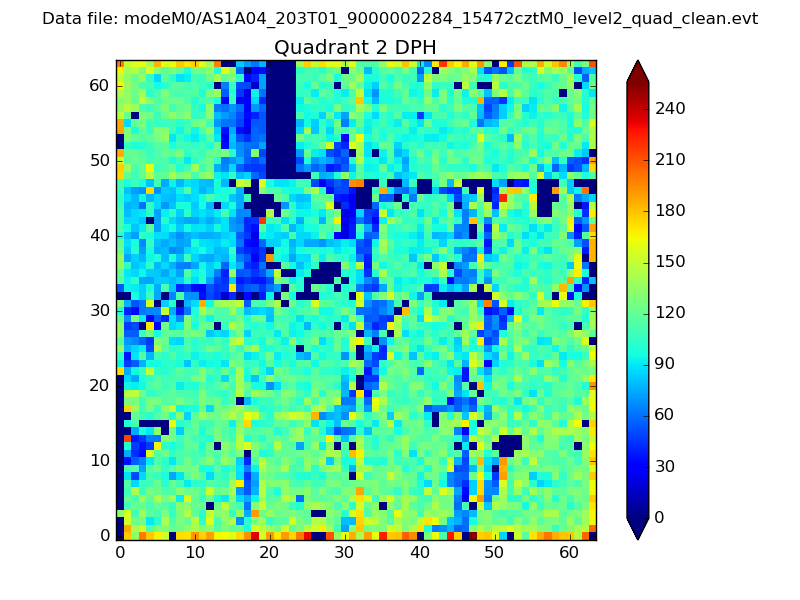
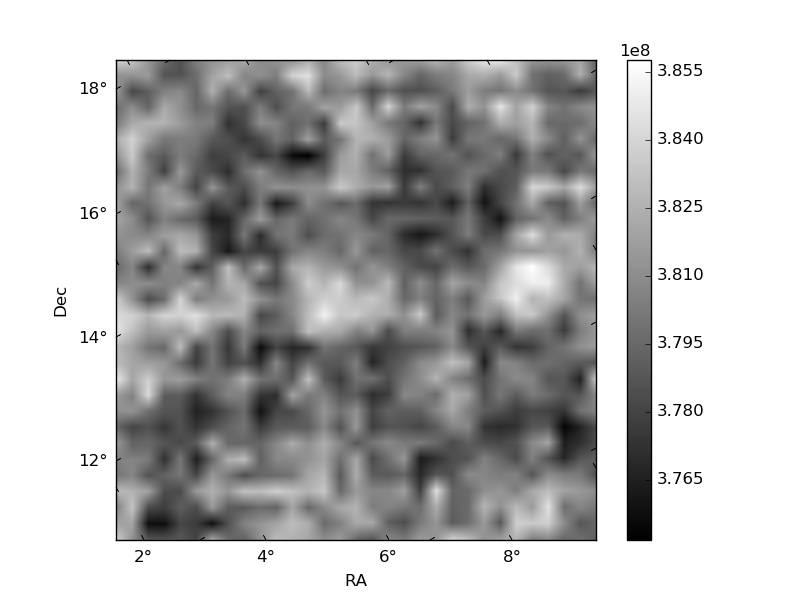
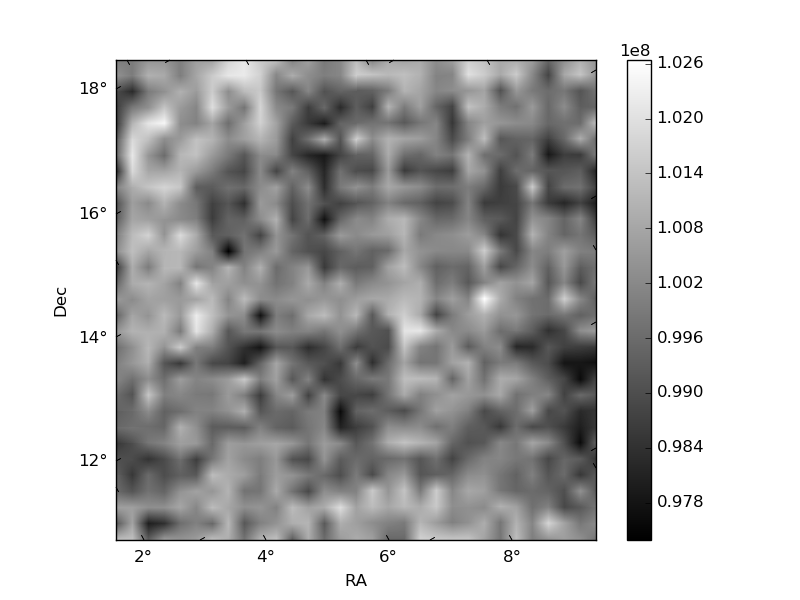
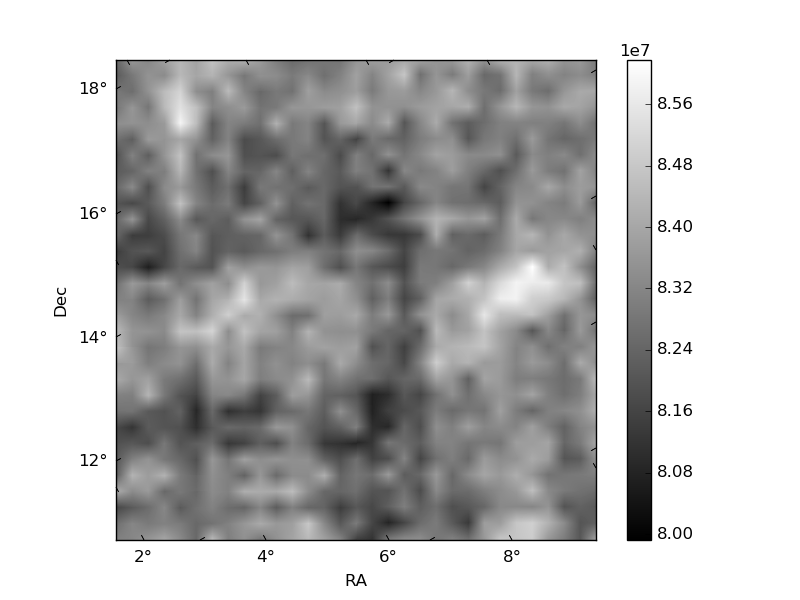
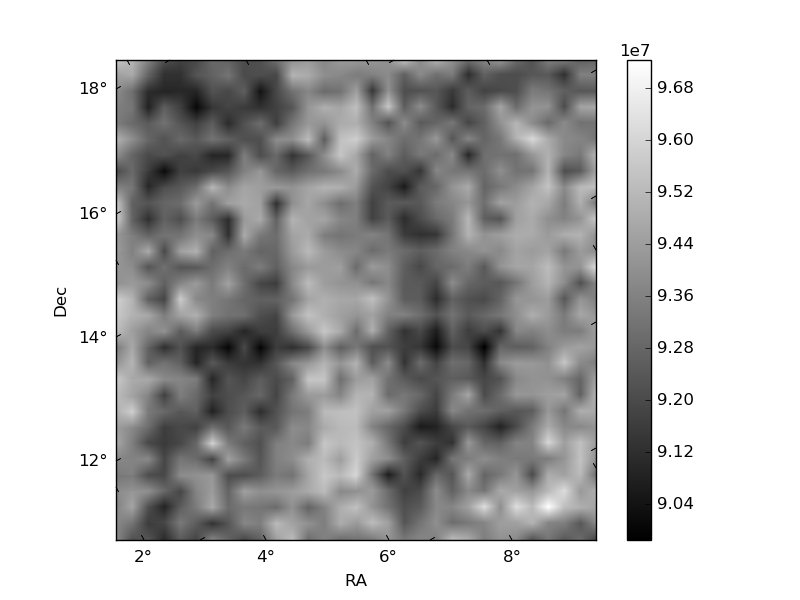
Histogram calculated using DETX and DETY for each event in the final _common_clean file
| Quadrant A | 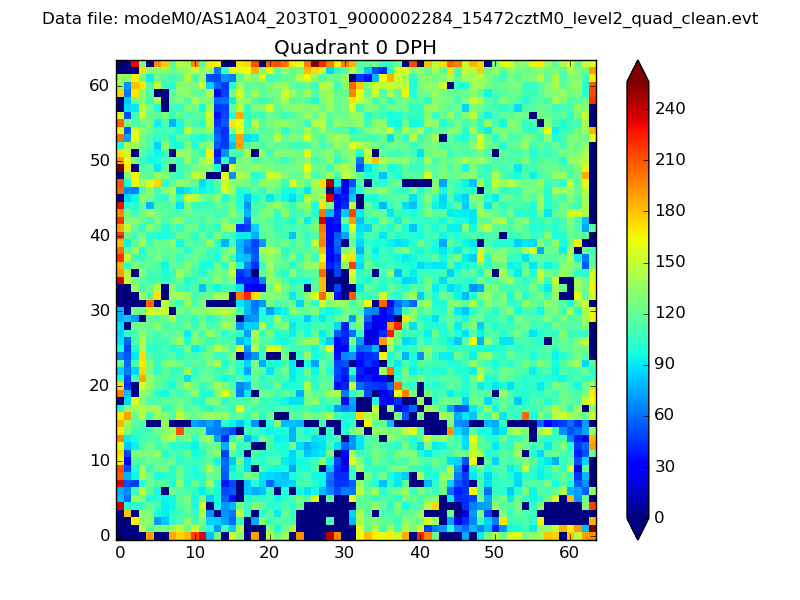 |
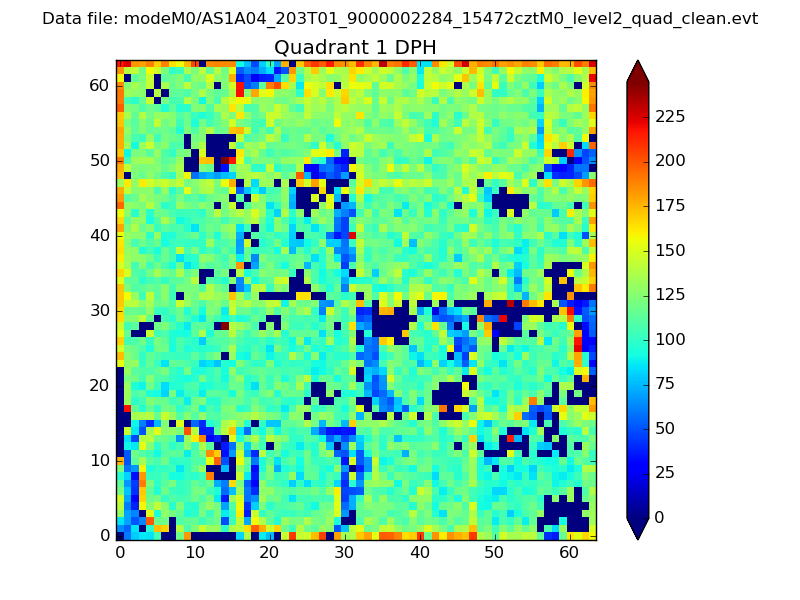 |
Quadrant B |
|---|---|---|---|
| Quadrant D | 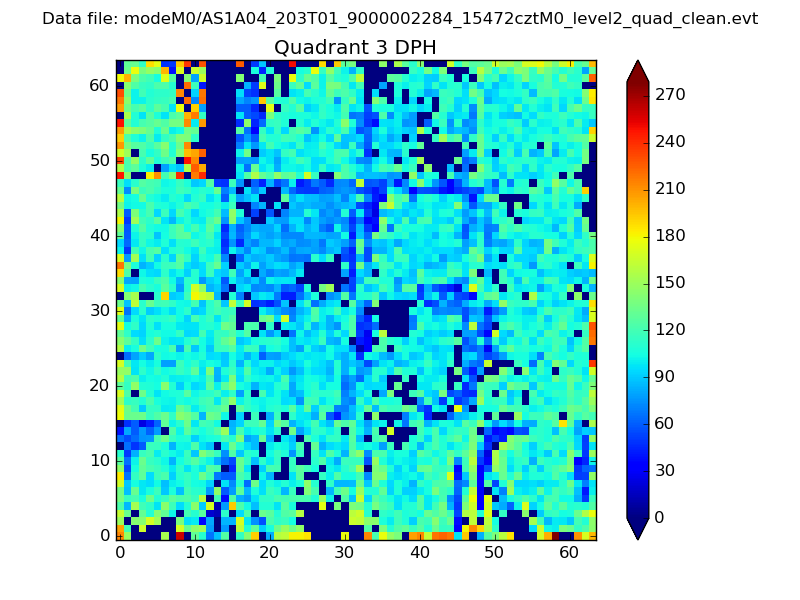 |
 |
Quadrant C |
| Plot type | Count rate plots | Images |
|---|---|---|
| Comparison with Poisson distribution Blue bars denote a histogram of data divided into 1 sec bins. Red curve is a Poisson curve with rate = median count rate of data. |
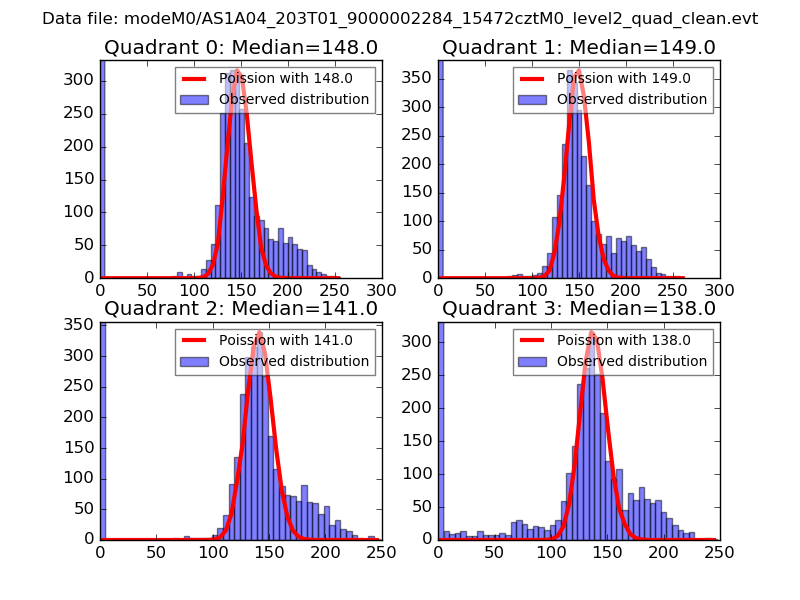 |
 |
| Quadrant-wise count rates Data is divided into 100 sec bins |
 |
|
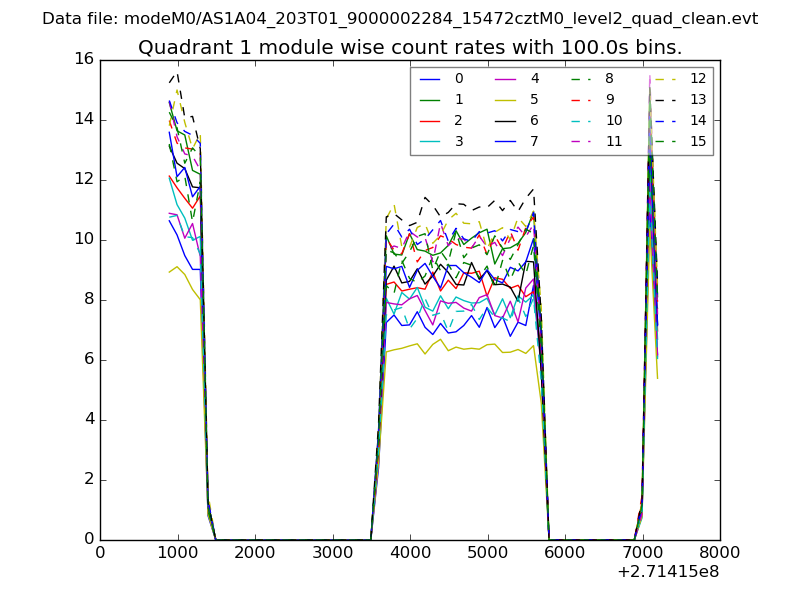
| Module-wise count rates for Quadrant A Data is divided into 100 sec bins |
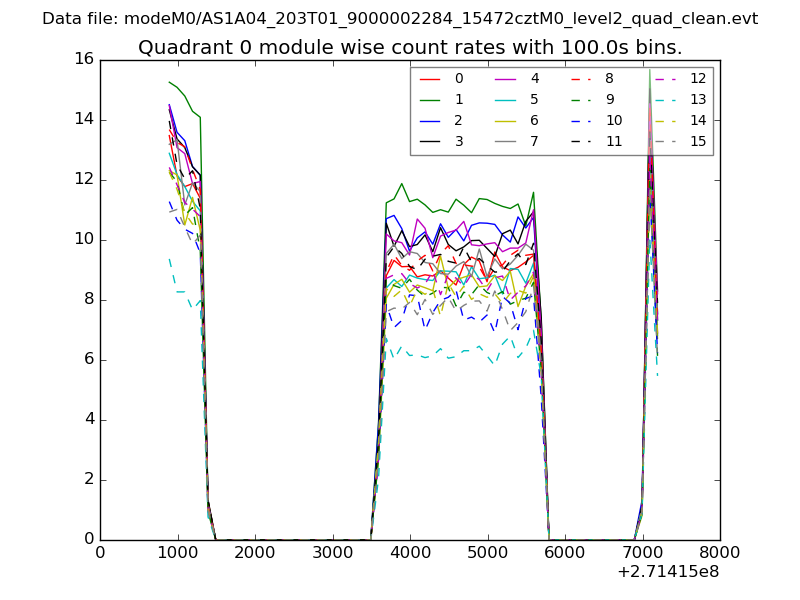 |
 |
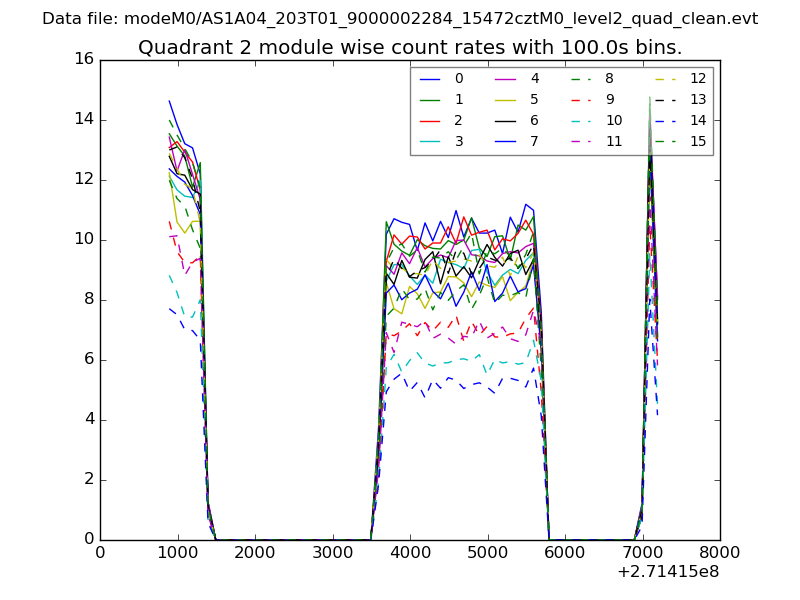
| Module-wise count rates for Quadrant B Data is divided into 100 sec bins |
 |
 |
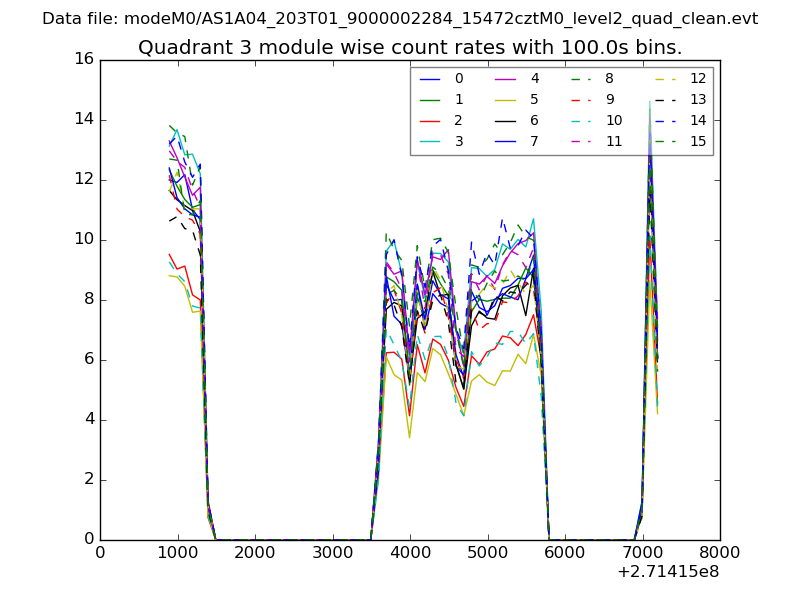
| Module-wise count rates for Quadrant C Data is divided into 100 sec bins |
 |
 |
| Module-wise count rates for Quadrant D Data is divided into 100 sec bins |
 |
 |
| Parameter | Plot |
|---|---|
| CZT HV Monitor | 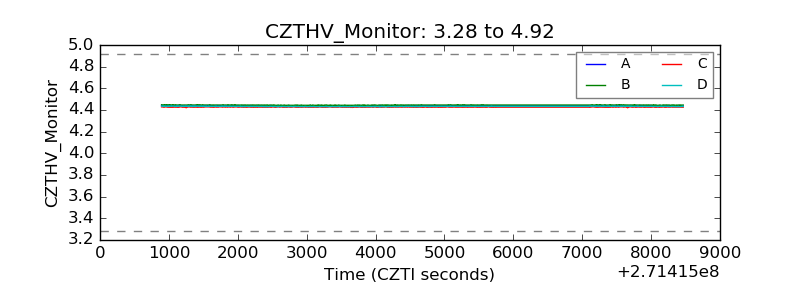 |
| D_VDD | 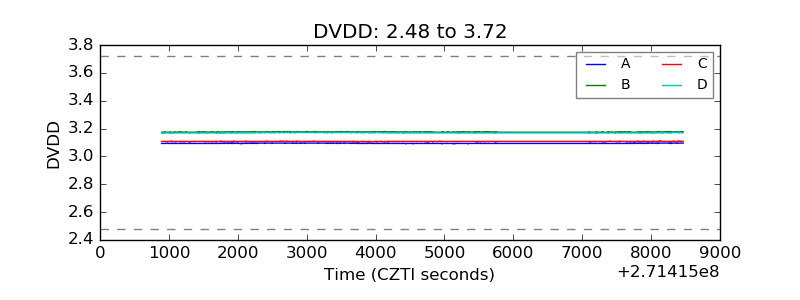 |
| Temperature 1 | 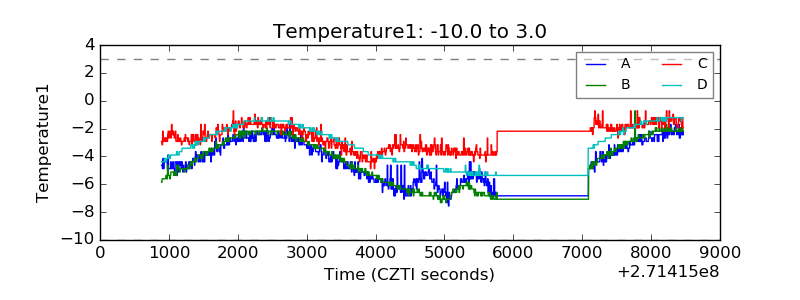 |
| Veto HV Monitor | 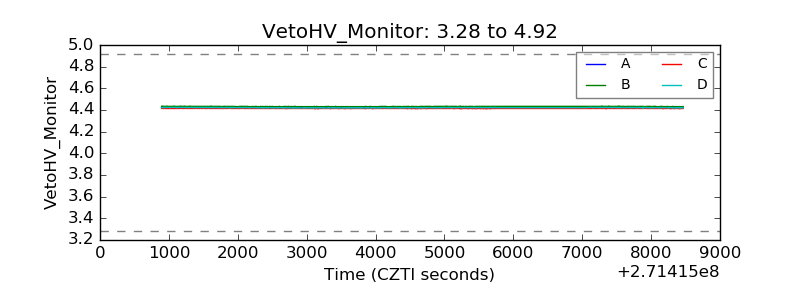 |
| Veto LLD |  |
| Alpha Counter |  |
| _CPM_Rate | 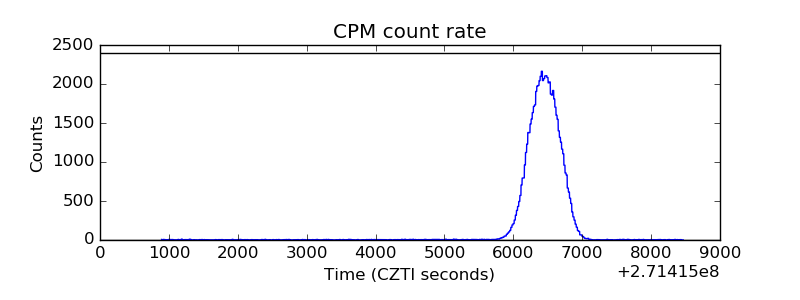 |
| CZT Counter | 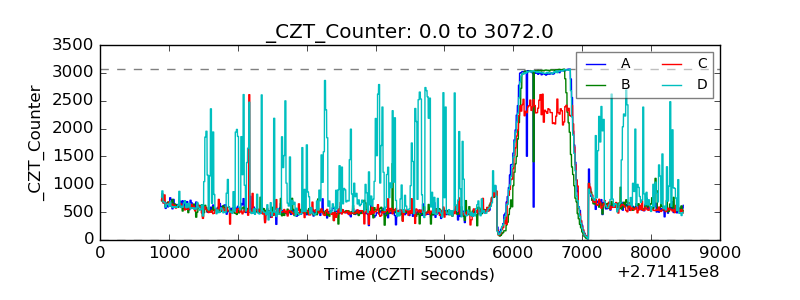 |
| +2.5 Volts monitor | 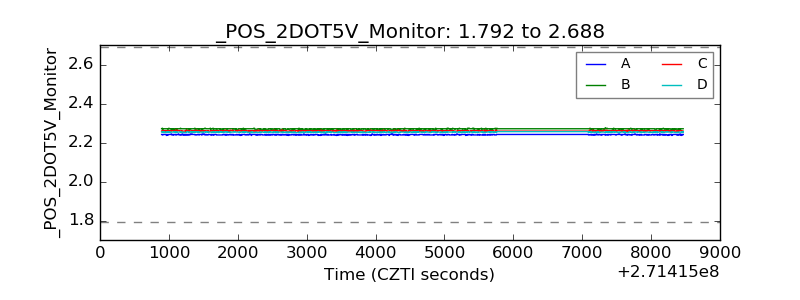 |
| +5 Volts monitor |  |
| _ROLL_ROT | 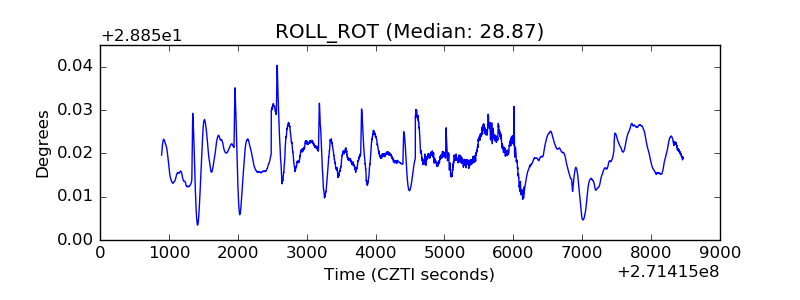 |
| _Roll_DEC | 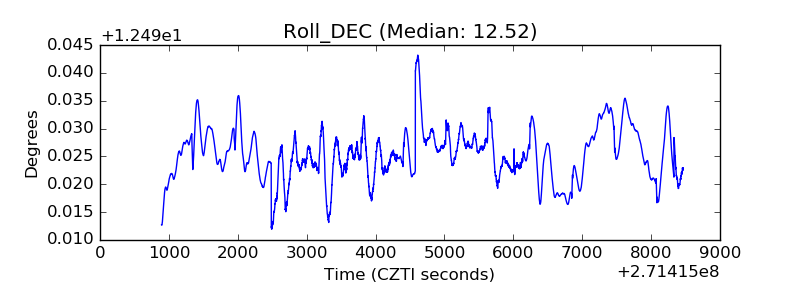 |
| _Roll_RA | 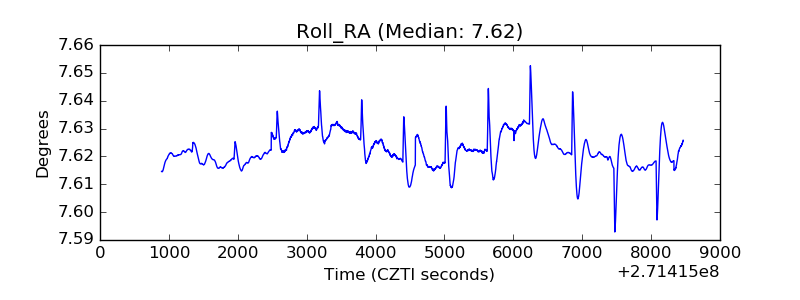 |
| Veto Counter | 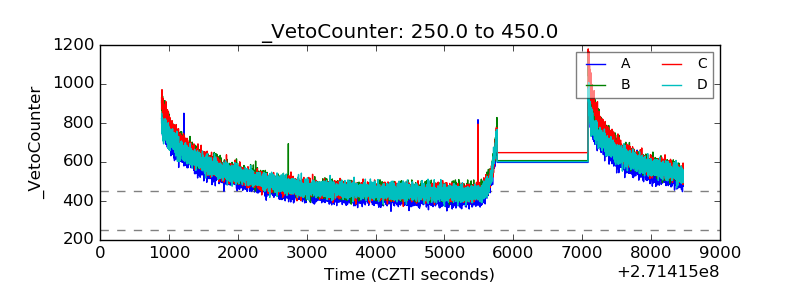 |