| Param | Original file | Final file |
|---|---|---|
| Filename | modeM0/AS1A04_203T01_9000002284_15473cztM0_level2.evt | modeM0/AS1A04_203T01_9000002284_15473cztM0_level2_quad_clean.evt |
| Size (bytes) | 529,848,000 | 65,044,800 |
| Size | 505.3 MB | 62.0 MB |
| Events in quadrant A | 3,476,595 | 393,602 |
| Events in quadrant B | 3,707,533 | 393,435 |
| Events in quadrant C | 3,468,380 | 376,412 |
| Events in quadrant D | 4,962,162 | 361,454 |
| Mode M0 | |||
|---|---|---|---|
| Quadrant | BADHDUFLAG | Total packets | Discarded packets |
| A | 0 | 14155 | 3 |
| B | 0 | 15066 | 2 |
| C | 0 | 13968 | 2 |
| D | 0 | 18813 | 2 |
| Mode SS | |||
|---|---|---|---|
| Quadrant | BADHDUFLAG | Total packets | Discarded packets |
| A | 0 | 130 | 0 |
| B | 0 | 130 | 0 |
| C | 0 | 130 | 0 |
| D | 0 | 130 | 0 |
| Mode M9 | |||
|---|---|---|---|
| Quadrant | BADHDUFLAG | Total packets | Discarded packets |
| A | 0 | 20 | 0 |
| B | 0 | 20 | 0 |
| C | 0 | 20 | 0 |
| D | 0 | 21 | 0 |
| Quadrant | Total seconds | Saturated seconds | Saturation percentage |
|---|---|---|---|
| A | 6363 | 110 | 1.728744% |
| B | 6363 | 157 | 2.467390% |
| C | 6363 | 122 | 1.917335% |
| D | 6363 | 529 | 8.313689% |
Noise dominated data is calculated using 1-second bins in cleaned event files. If a bin has >2000 counts, and if more than 50% of those come from <1% of pixels, then it is considered to be noise-dominated and hence unusable.
| Quadrant | # 1 sec bins | Bins with >0 counts | Bins with >2000 counts | High rate bins dominated by noise | Noise dominated (total time) | Noise dominated (detector-on time) | Marked lightcurve |
|---|---|---|---|---|---|---|---|
| A | 7694 | 6364 | 0 | 0 | 0.00% | 0.00% | 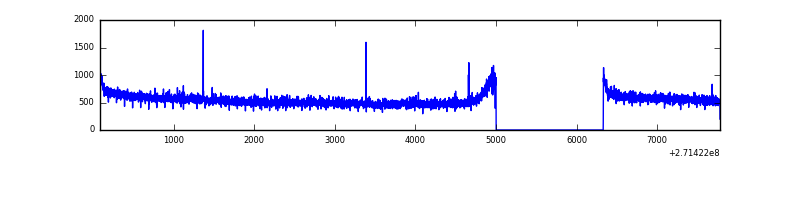 |
| B | 7694 | 6364 | 28 | 28 | 0.36% | 0.44% | 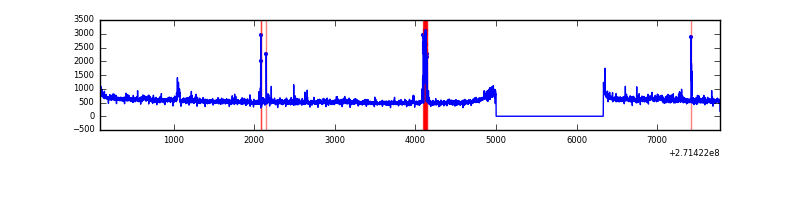 |
| C | 7694 | 6364 | 0 | 0 | 0.00% | 0.00% | 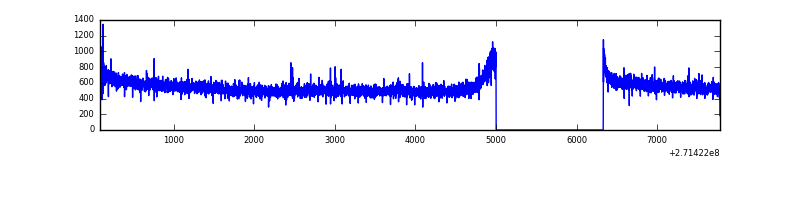 |
| D | 7694 | 6364 | 365 | 365 | 4.74% | 5.74% | 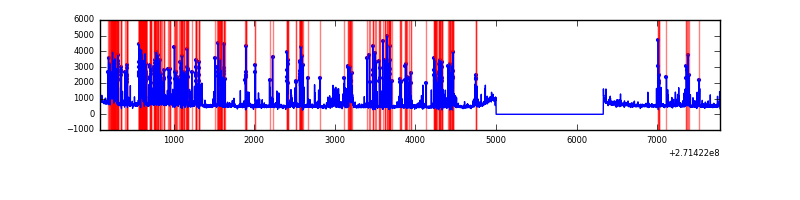 |
Top three noisy pixels from each quadrant. If the there are fewer than three noisy pixels in the level2.evt file, extra rows are filled as -1
| Pixel properties | Quadrant properties | ||||||
|---|---|---|---|---|---|---|---|
| Quadrant | DetID | PixID | Counts | Sigma | Mean | Median | Sigma |
| A | 9 | 143 | 14171 | 74.1 | 901 | 885 | 179.3 |
| A | 0 | 226 | 8026 | 39.82 | 901 | 885 | 179.3 |
| A | 12 | 194 | 6823 | 33.12 | 901 | 885 | 179.3 |
| B | 15 | 222 | 96898 | 575.37 | 889 | 871 | 166.9 |
| B | 3 | 209 | 38566 | 225.86 | 889 | 871 | 166.9 |
| B | 0 | 230 | 27526 | 159.71 | 889 | 871 | 166.9 |
| C | 14 | 238 | 133390 | 673.56 | 850 | 858 | 196.8 |
| C | 3 | 233 | 16405 | 79.01 | 850 | 858 | 196.8 |
| C | 13 | 61 | 6285 | 27.58 | 850 | 858 | 196.8 |
| D | 1 | 52 | 1508950 | 7316.75 | 848 | 823 | 206.1 |
| D | 5 | 222 | 182055 | 879.26 | 848 | 823 | 206.1 |
| D | 12 | 221 | 27192 | 127.93 | 848 | 823 | 206.1 |
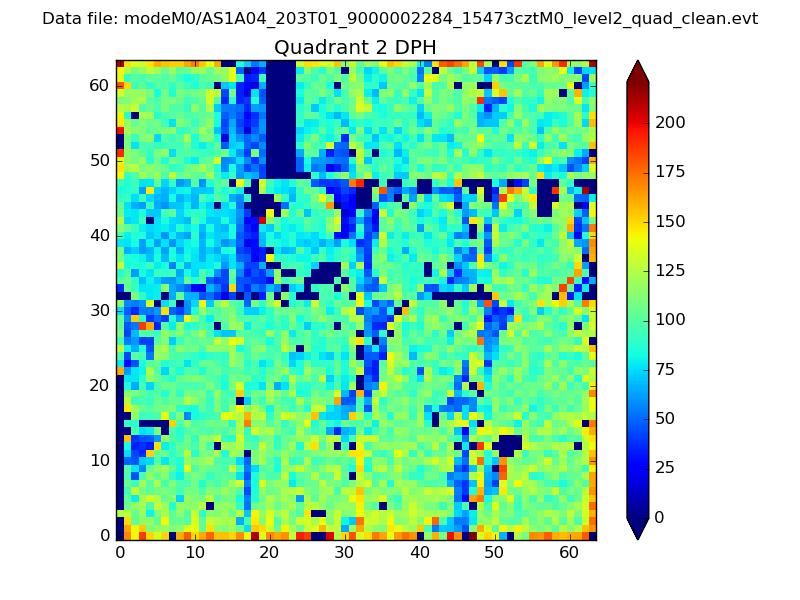
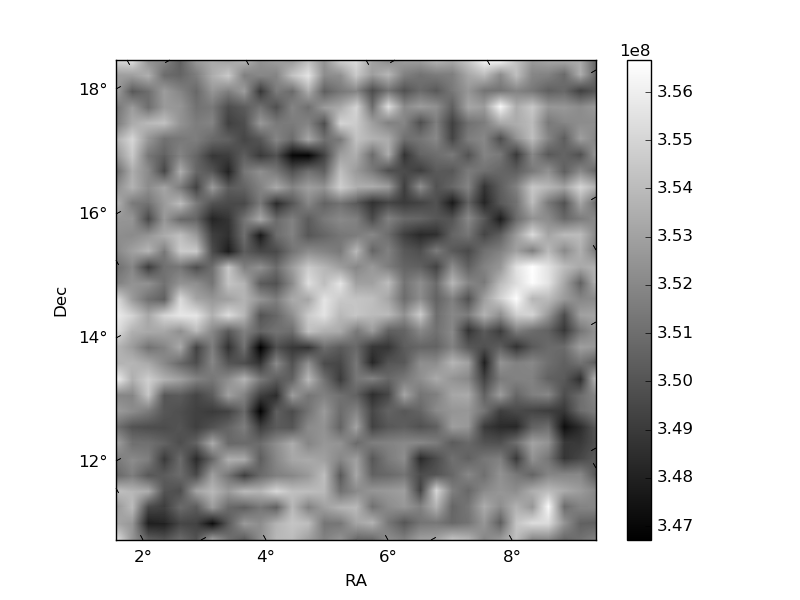
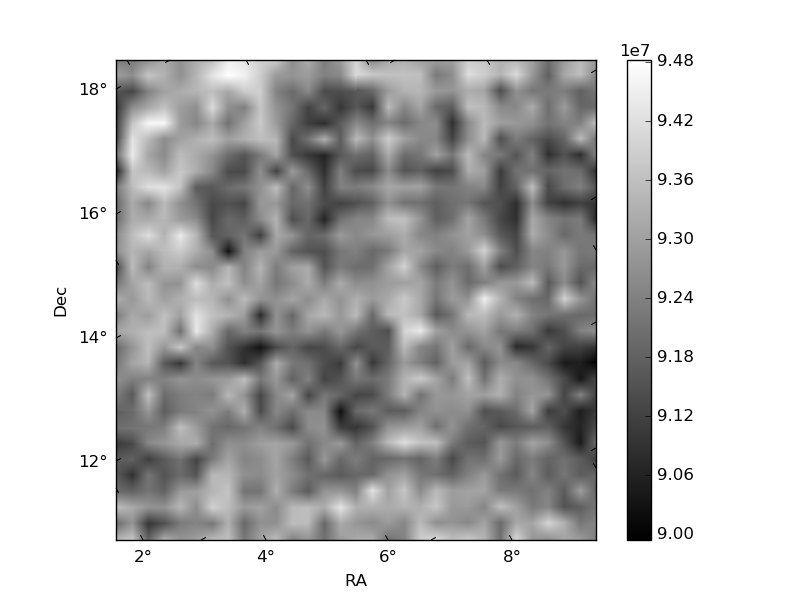
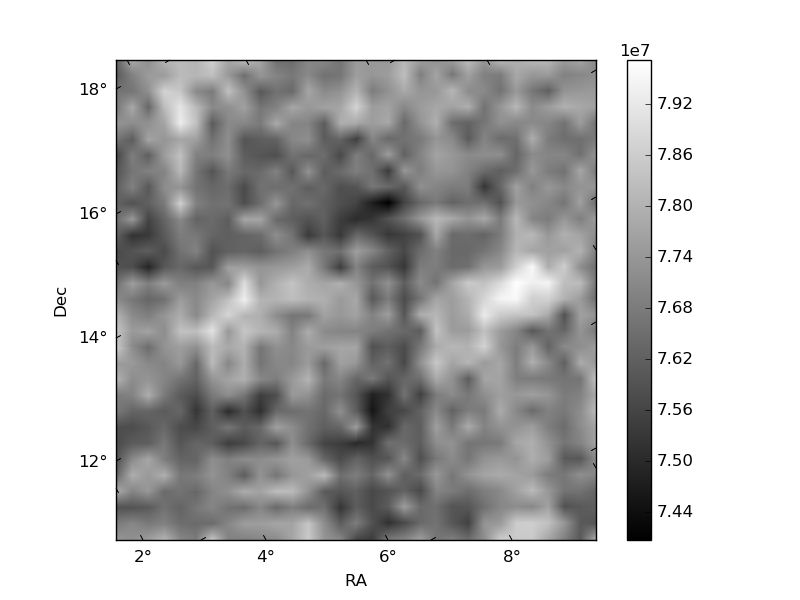
Histogram calculated using DETX and DETY for each event in the final _common_clean file
| Quadrant A | 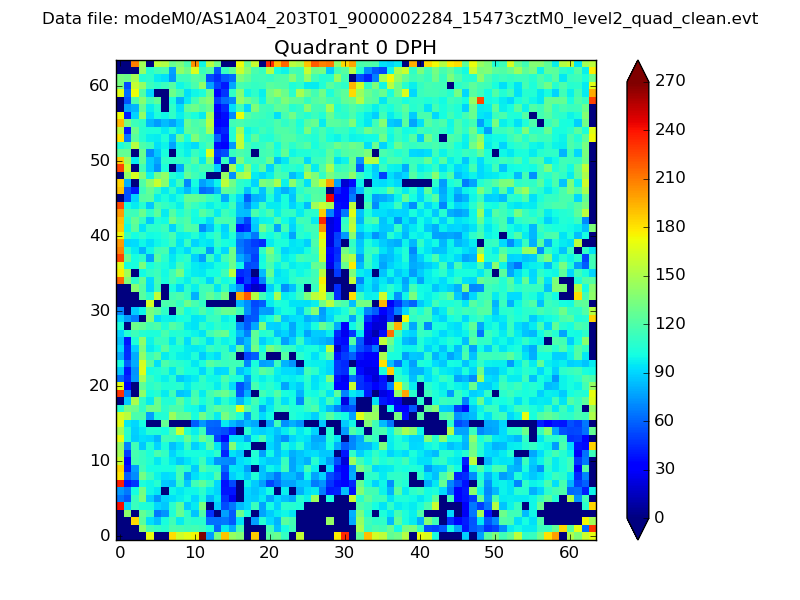 |
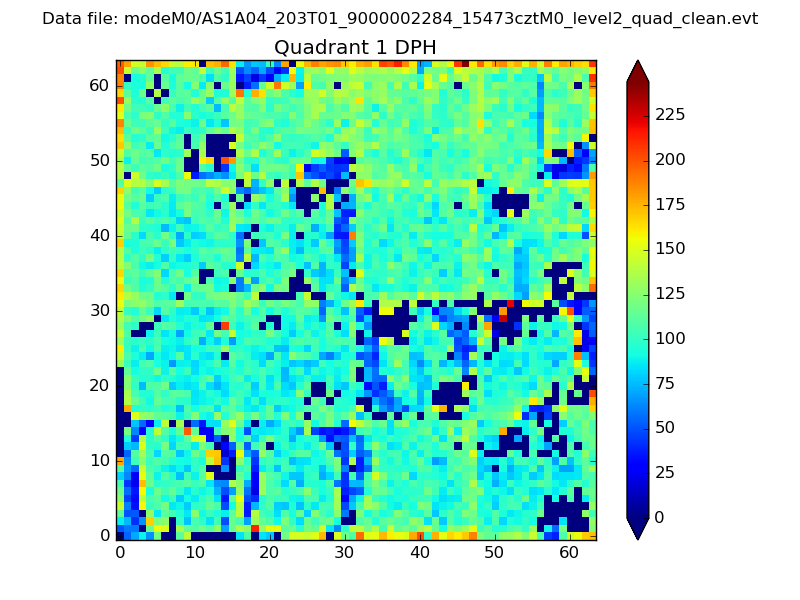 |
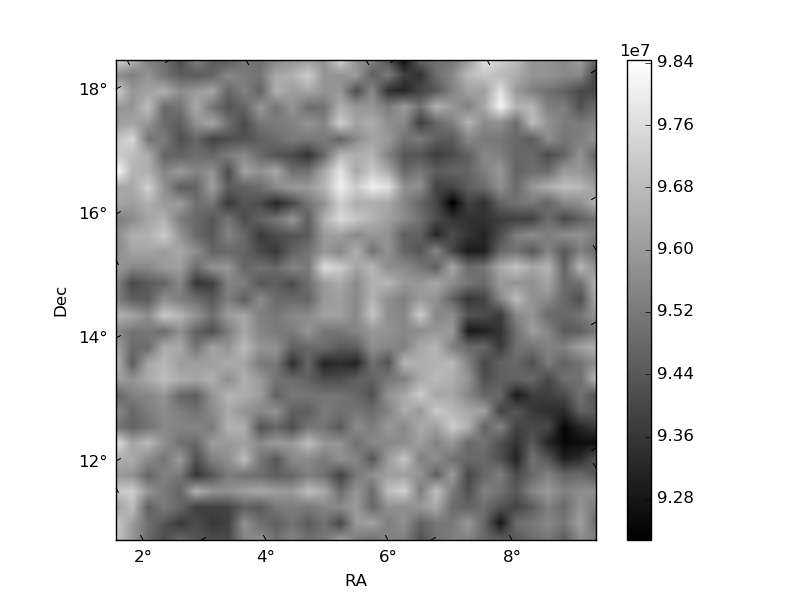
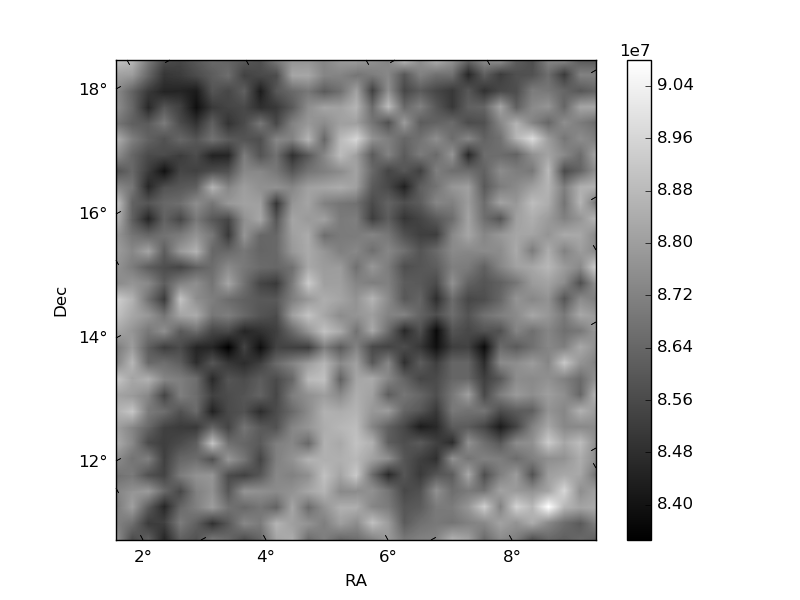
Quadrant B |
|---|---|---|---|
| Quadrant D | 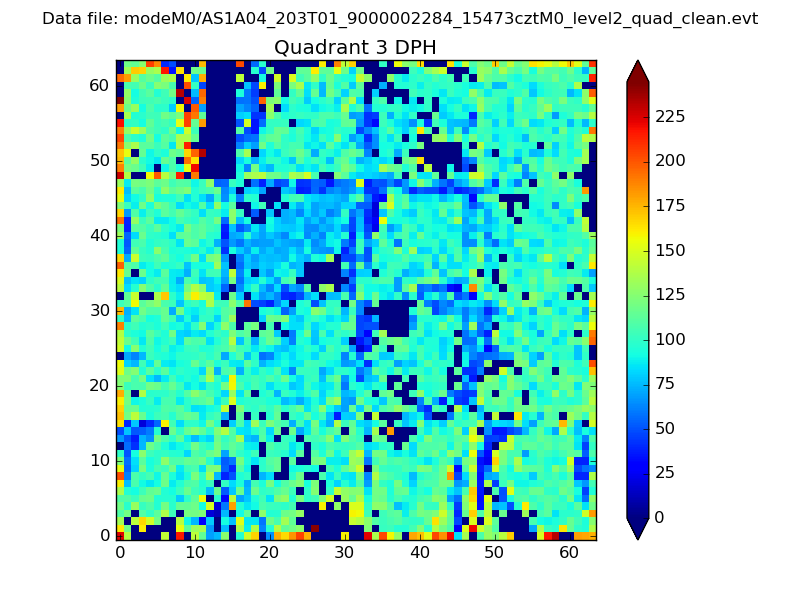 |
 |
Quadrant C |
| Plot type | Count rate plots | Images |
|---|---|---|
| Comparison with Poisson distribution Blue bars denote a histogram of data divided into 1 sec bins. Red curve is a Poisson curve with rate = median count rate of data. |
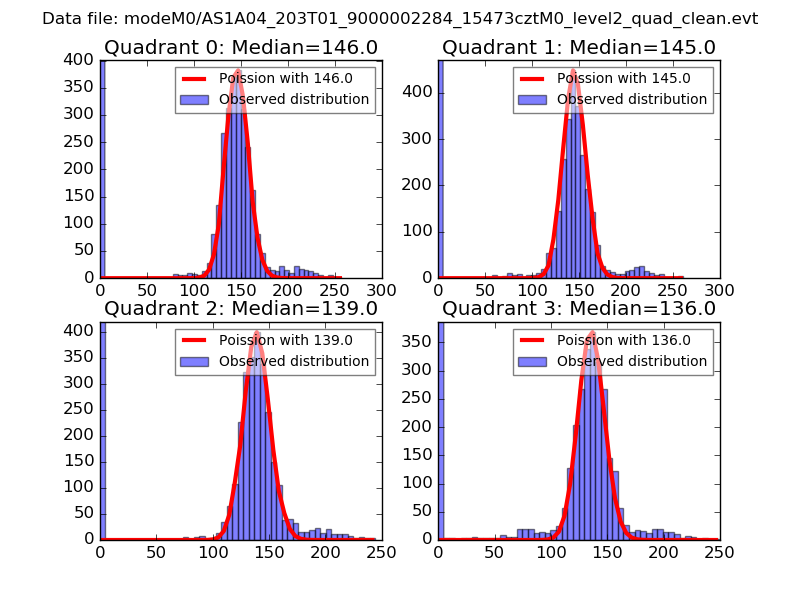 |
 |
| Quadrant-wise count rates Data is divided into 100 sec bins |
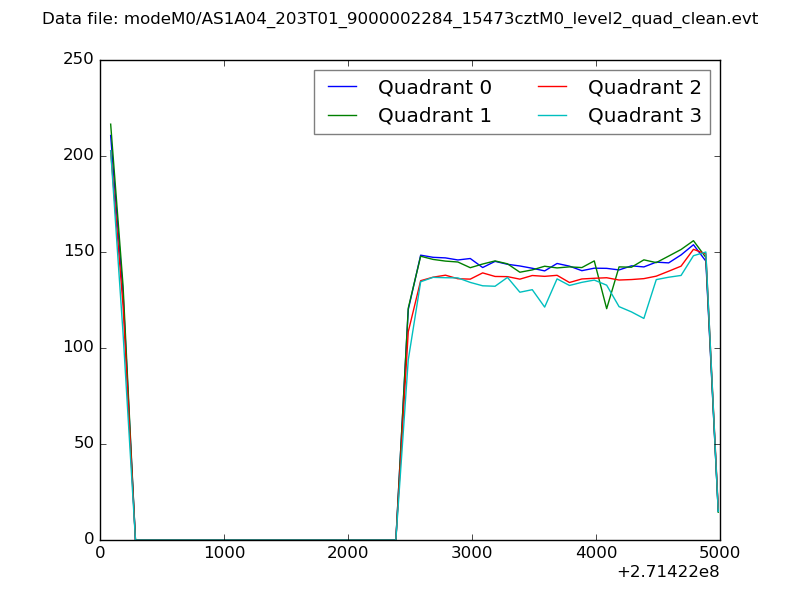 |
|
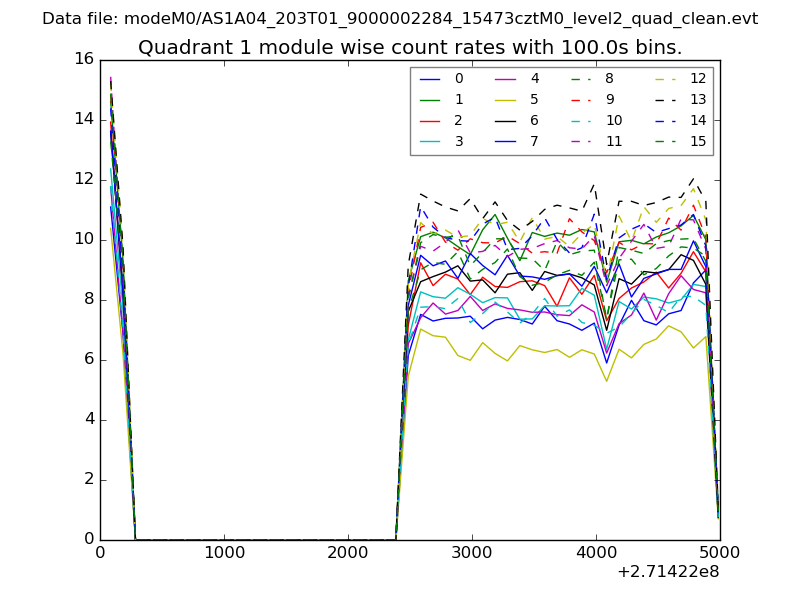
| Module-wise count rates for Quadrant A Data is divided into 100 sec bins |
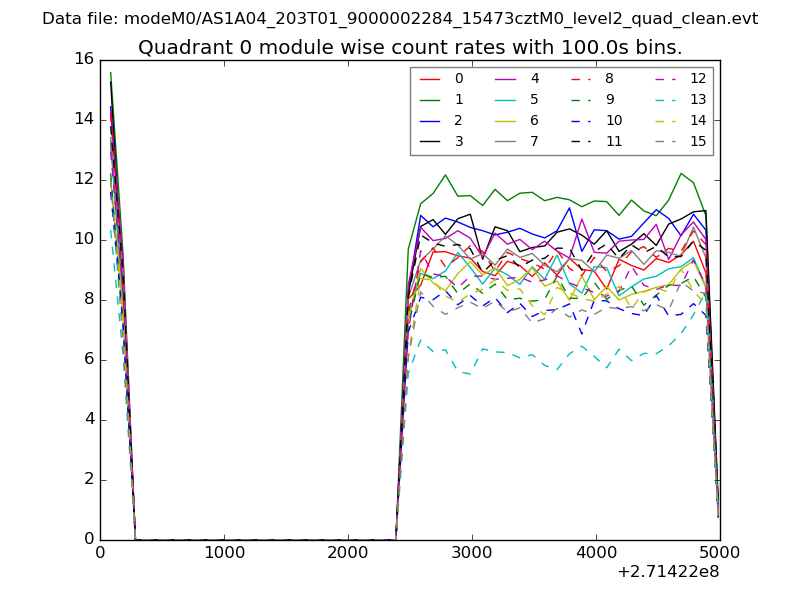 |
 |
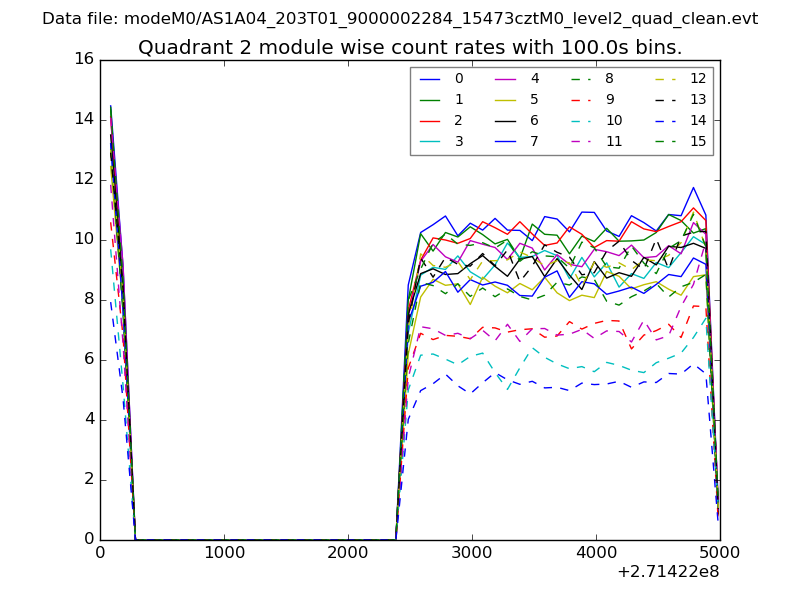
| Module-wise count rates for Quadrant B Data is divided into 100 sec bins |
 |
 |
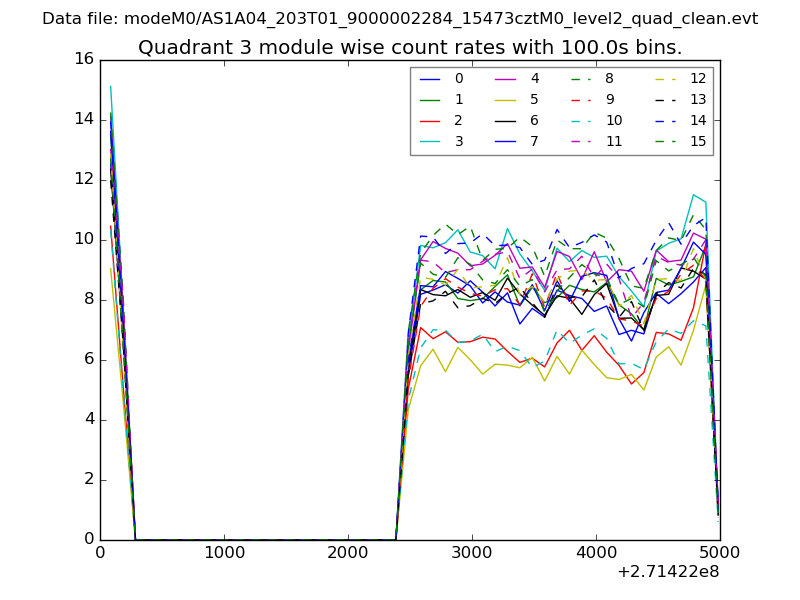
| Module-wise count rates for Quadrant C Data is divided into 100 sec bins |
 |
 |
| Module-wise count rates for Quadrant D Data is divided into 100 sec bins |
 |
 |
| Parameter | Plot |
|---|---|
| CZT HV Monitor | 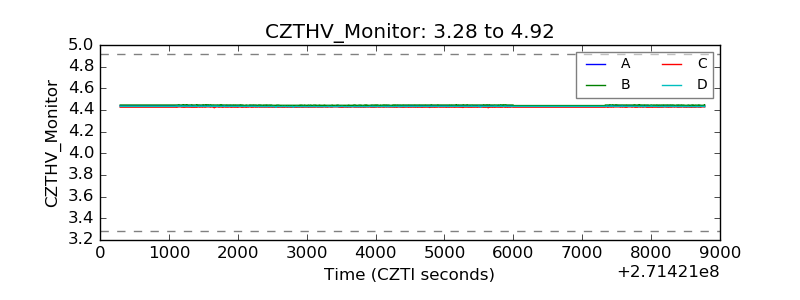 |
| D_VDD | 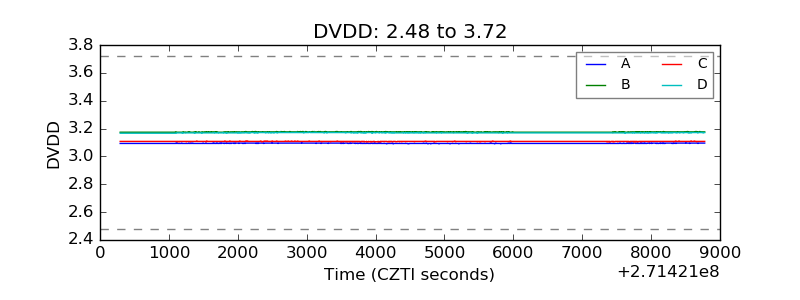 |
| Temperature 1 | 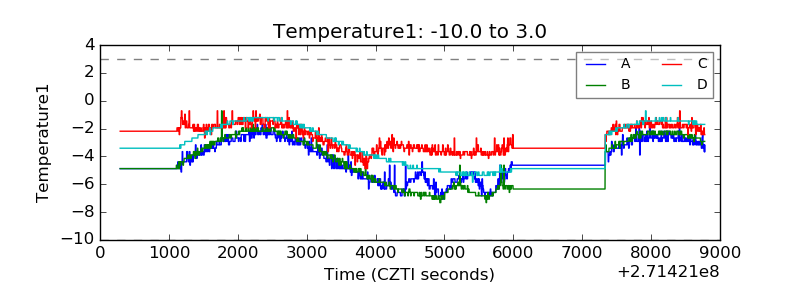 |
| Veto HV Monitor | 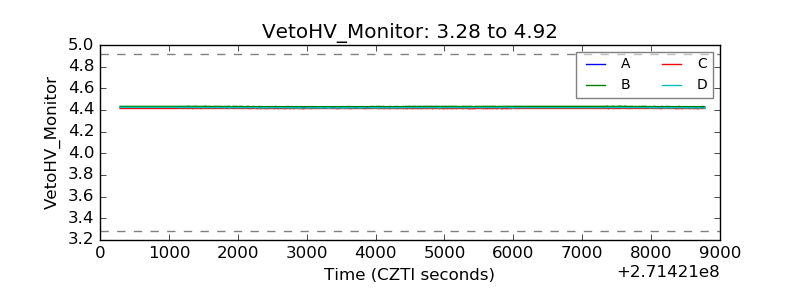 |
| Veto LLD | 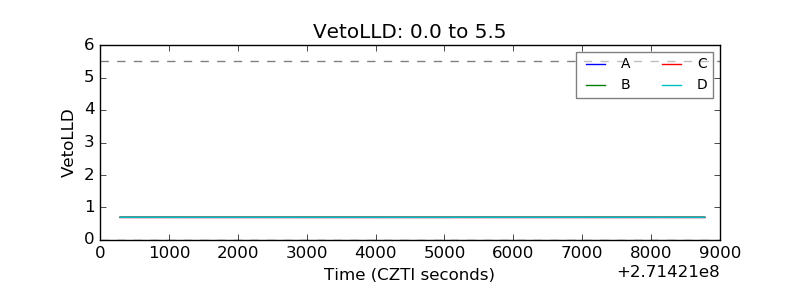 |
| Alpha Counter | 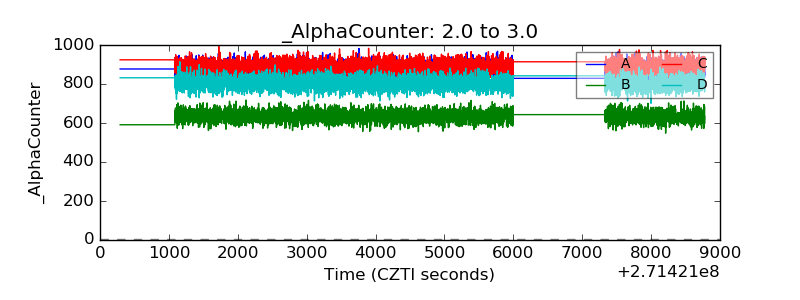 |
| _CPM_Rate | 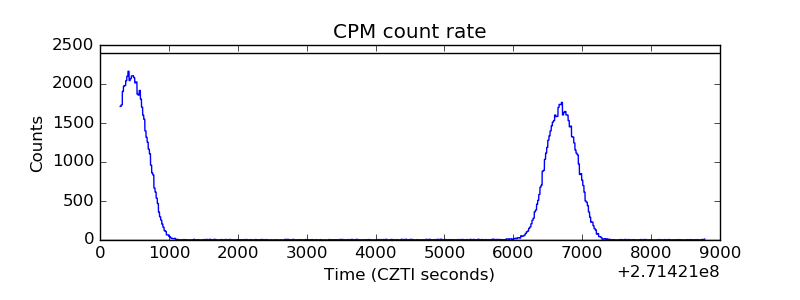 |
| CZT Counter | 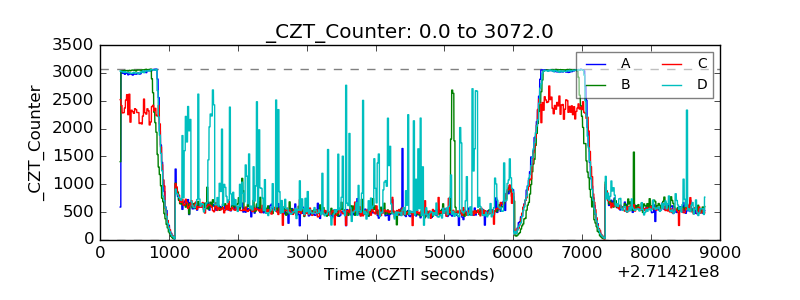 |
| +2.5 Volts monitor |  |
| +5 Volts monitor |  |
| _ROLL_ROT | 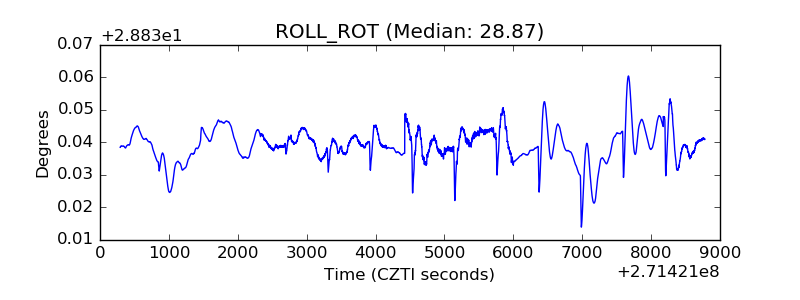 |
| _Roll_DEC | 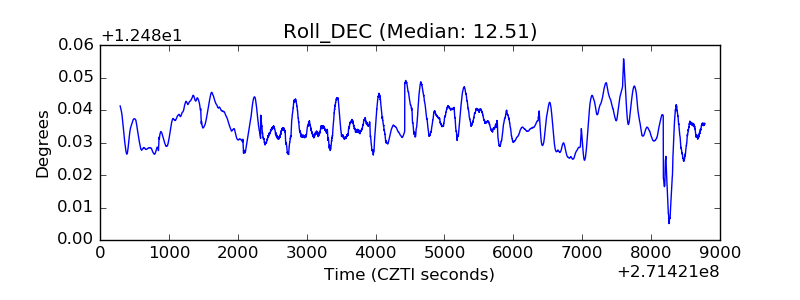 |
| _Roll_RA |  |
| Veto Counter |  |